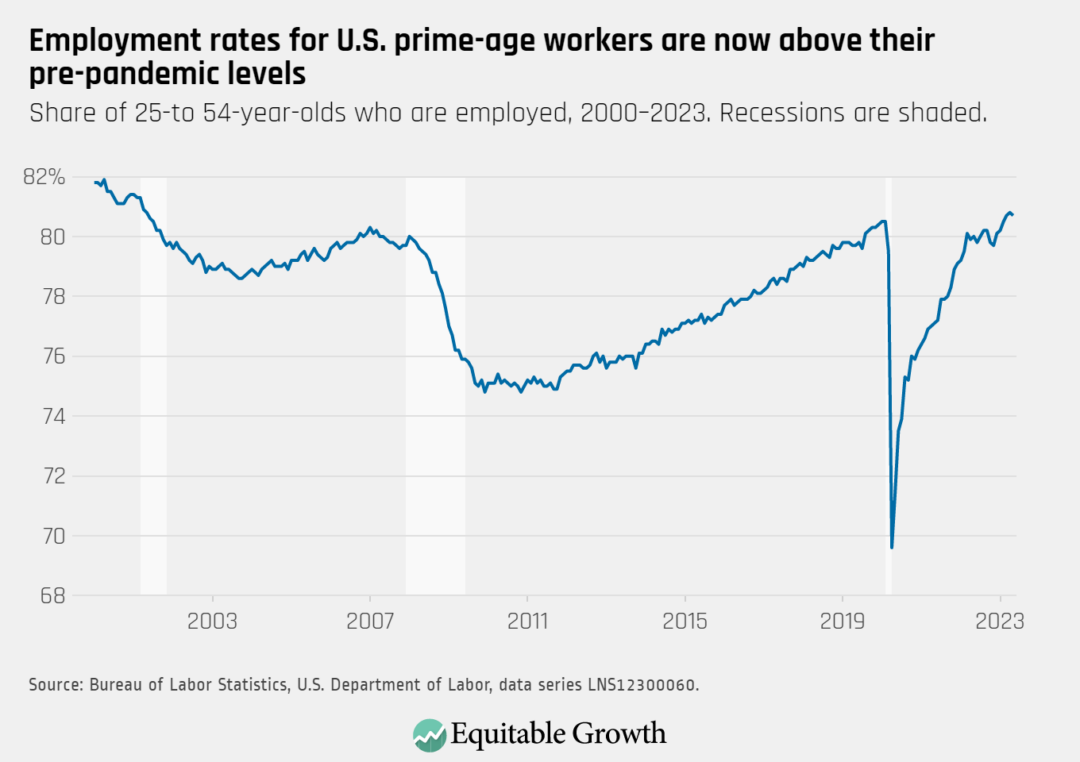
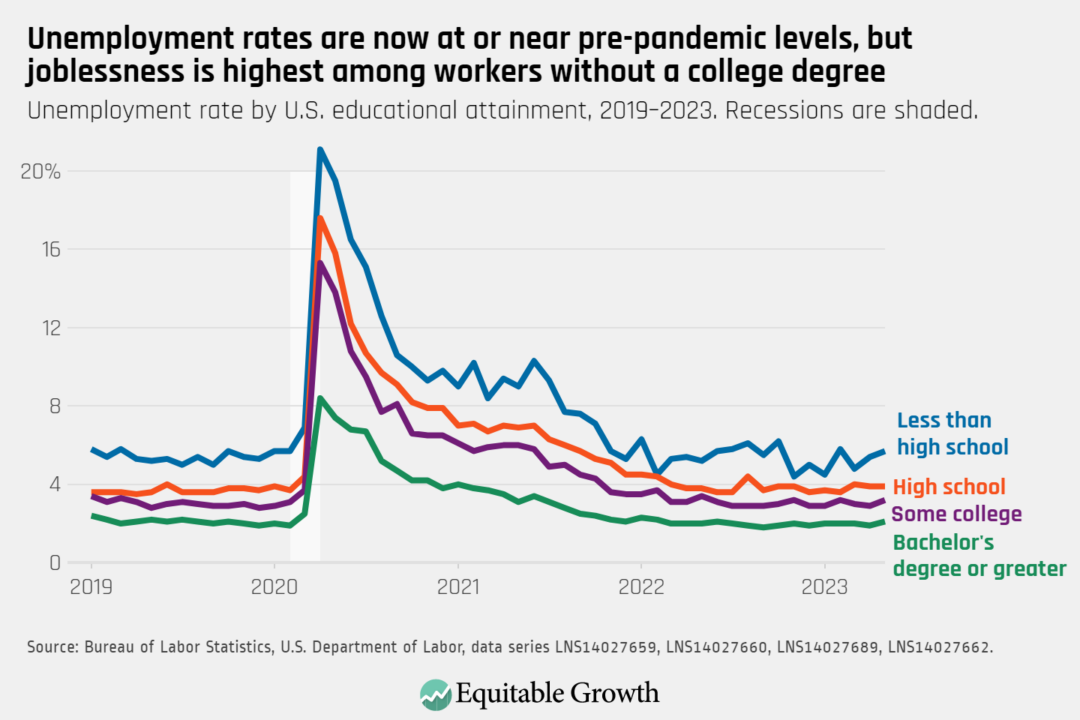
On June 2nd, the U.S. Bureau of Labor Statistics released new data on the U.S. labor market during the month of May. Below are five graphs compiled by Equitable Growth staff highlighting important trends in the data.
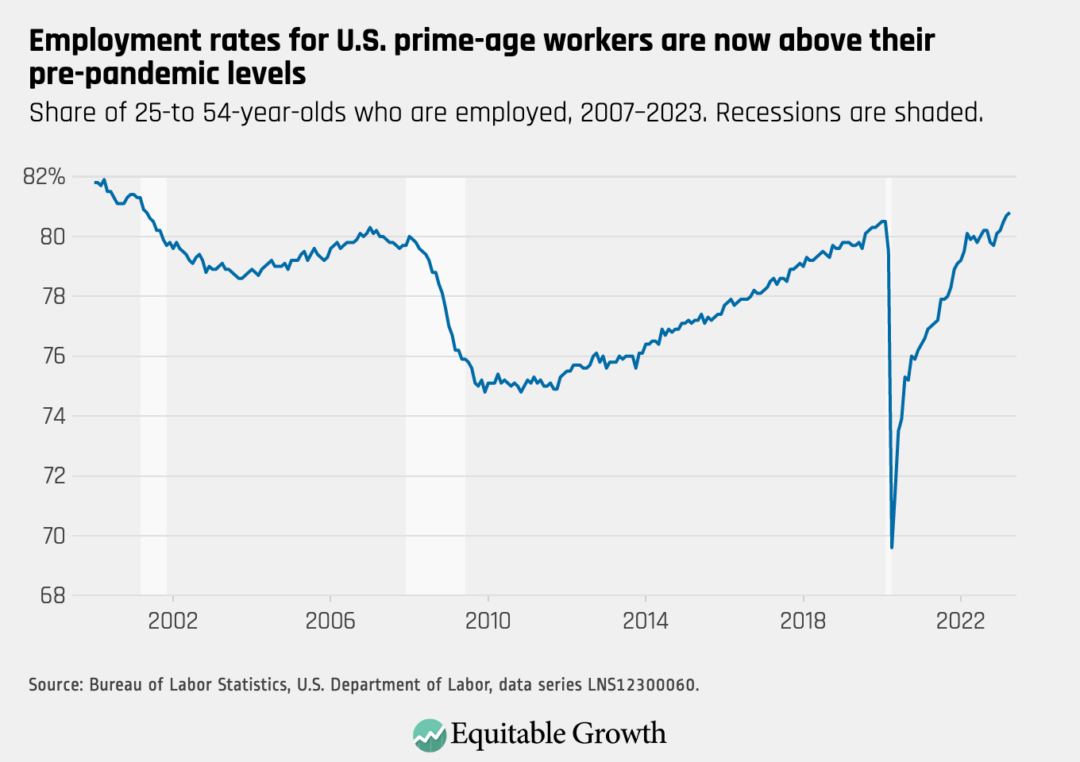
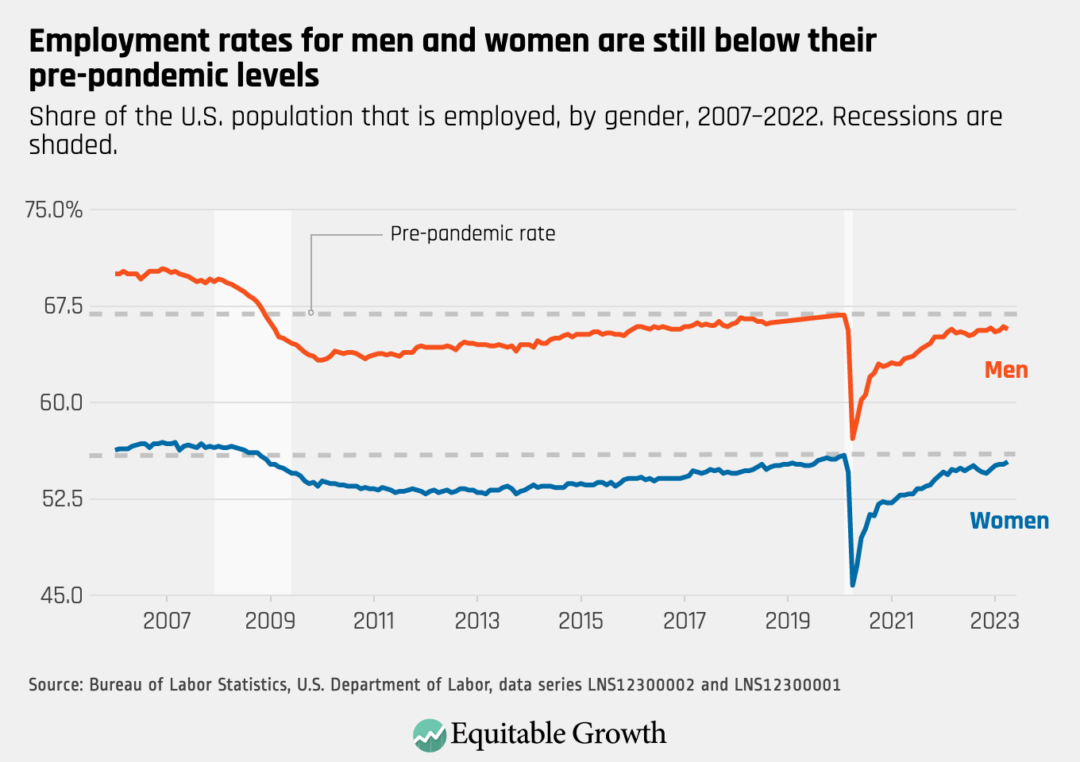
The U.S. labor market added 339,000 jobs last month, but the employment-rate for prime-age workers fell slightly from 80.8 percent in April to 80.7 percent in May.
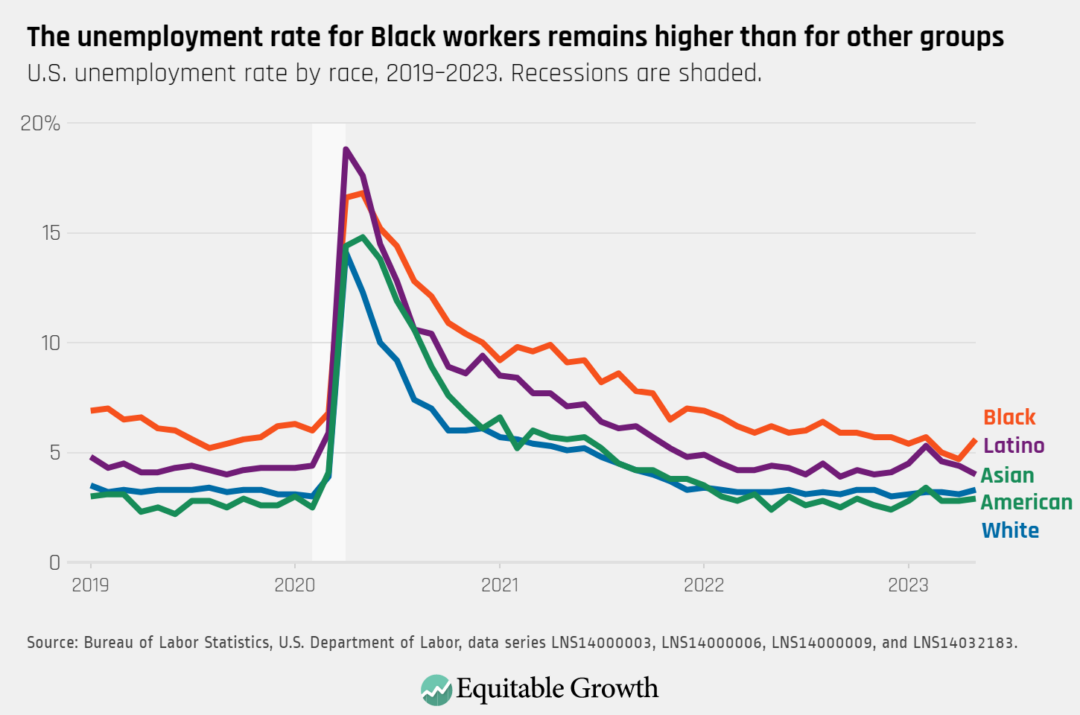
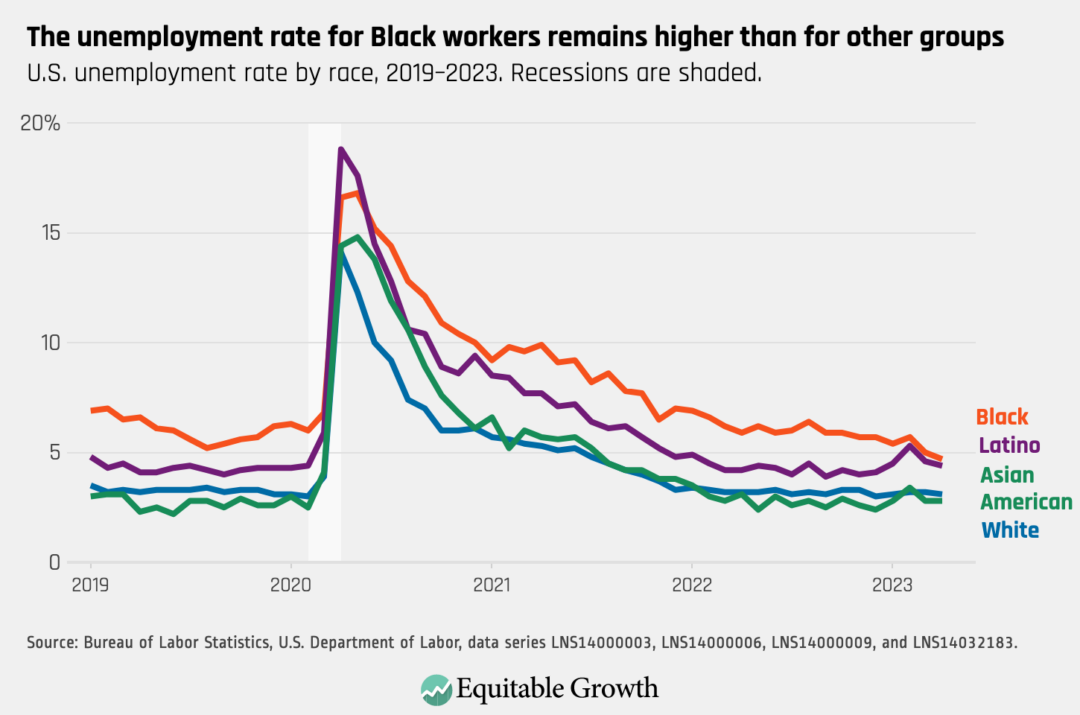
The national unemployment rate rose to 3.7 percent in May, with increases for White workers (3.3), Asian American workers (2.9), and Black workers (5.6). The jobless rate for Latino workers declined to 4 percent.
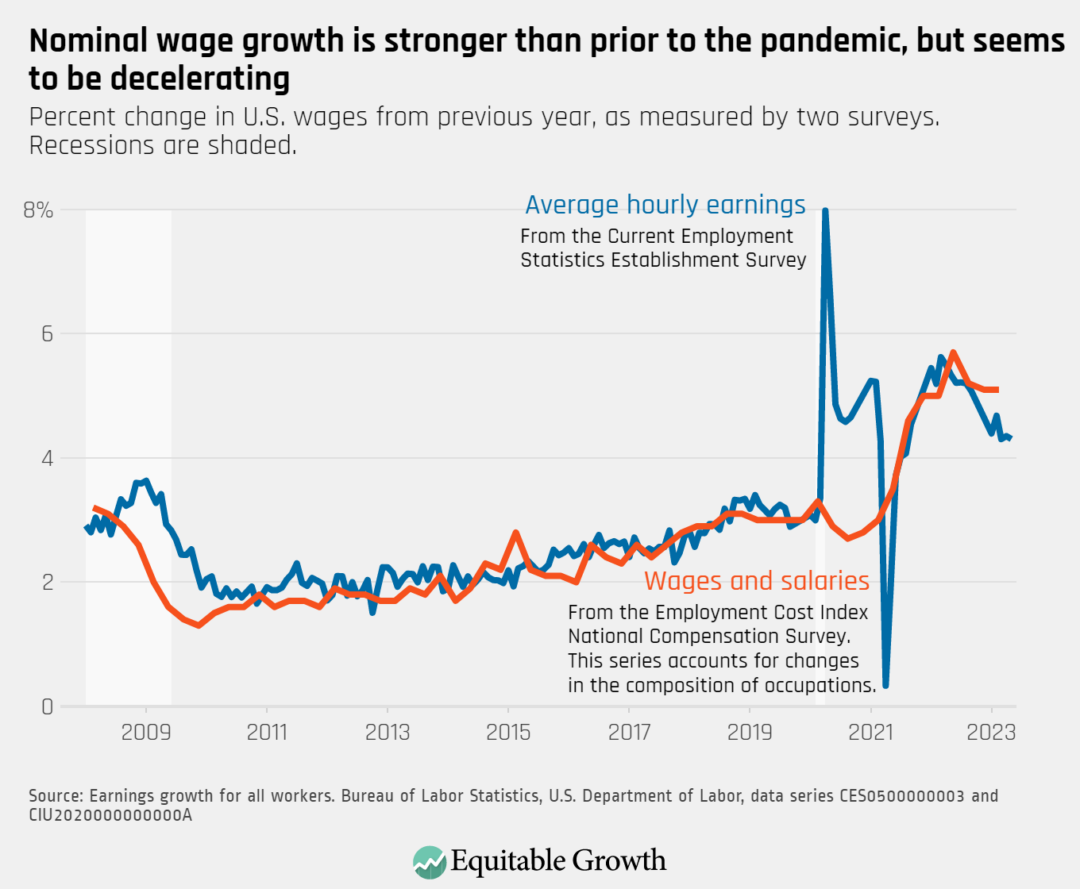
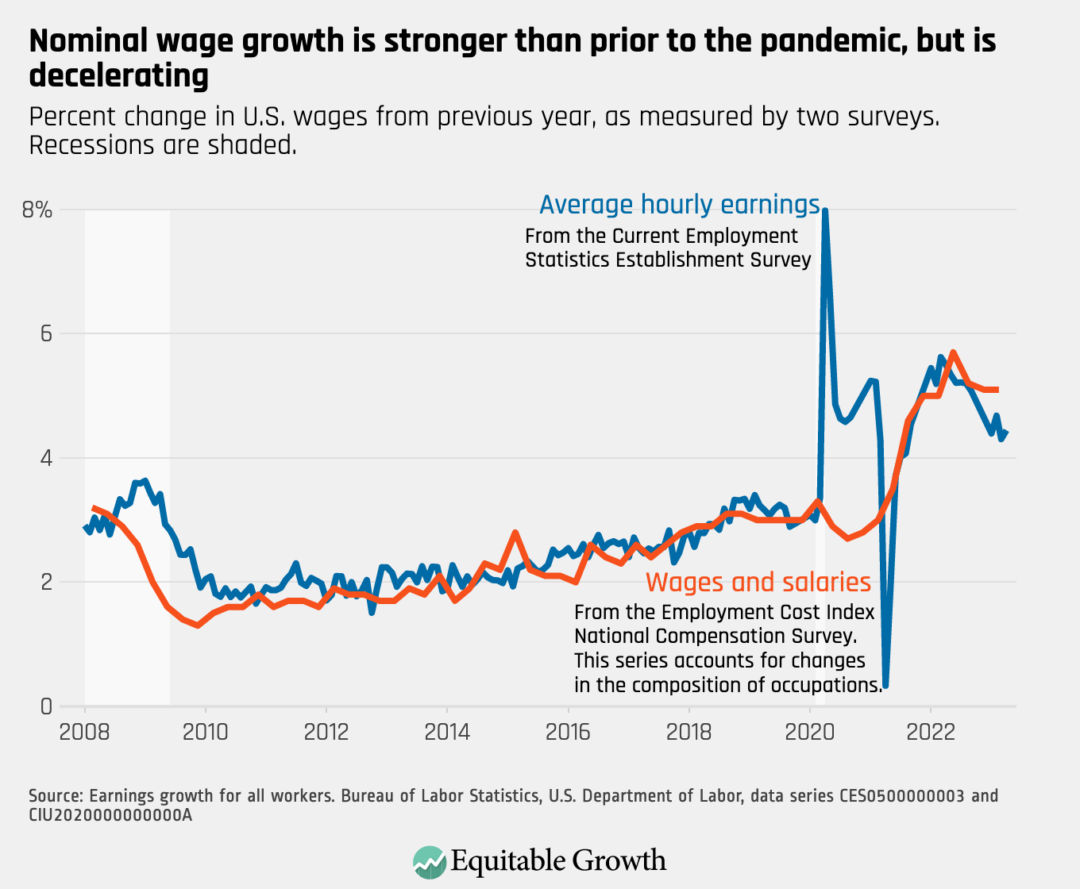
Year-over-year nominal wage growth (not accounting for inflation) declined slightly in May, with average hourly earnings growth at 4.3 percent over the past 12 months.
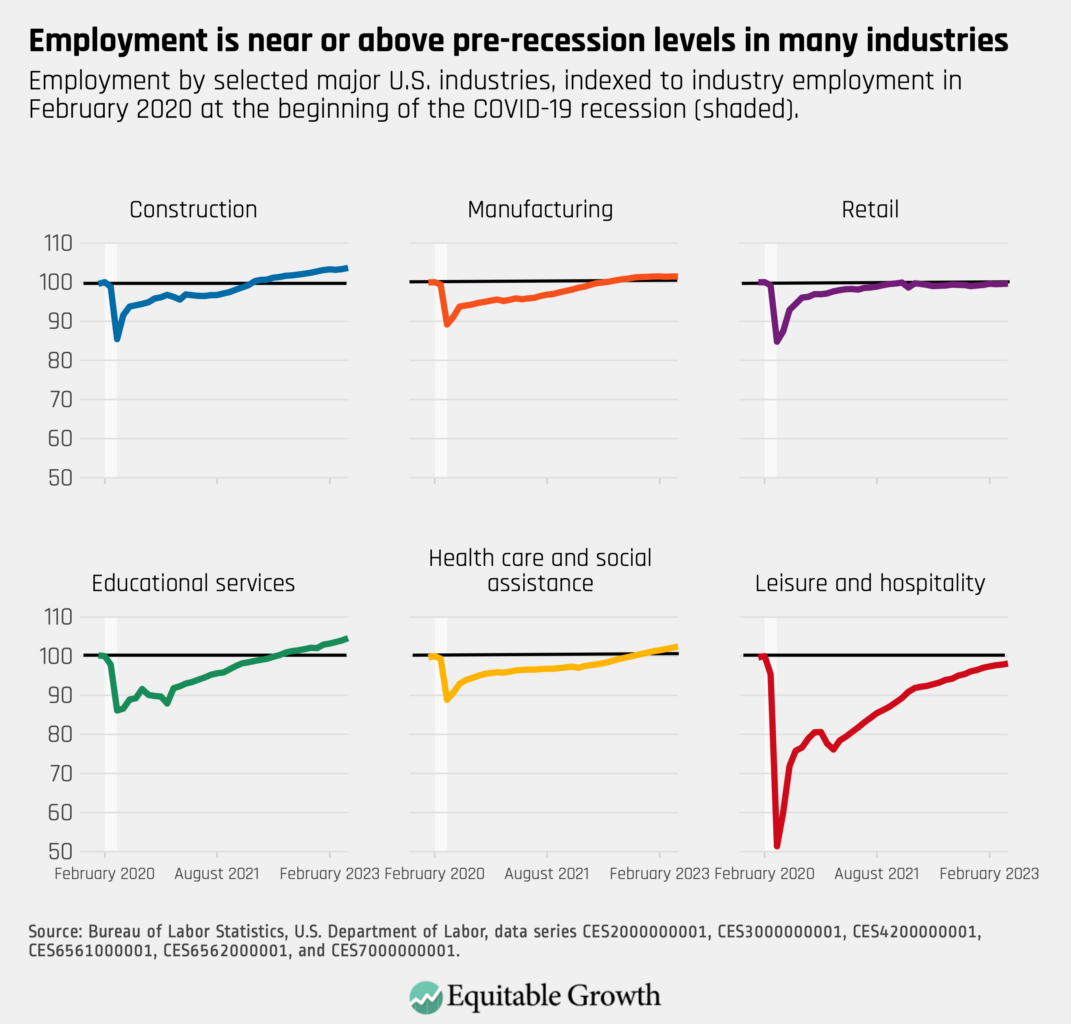
Net job gains were particularly strong in private education and health services (+97,000) and professional business services (+64,000). The manufacturing and information industries reported net employment losses in May.
The unemployment rate for workers without a high school degree ticked up to 5.7 percent, and is consistently higher than for workers with high school (3.9 percent), some college (3.2), and a bachelor’s degree (2.1).
Filing a tax return with the Internal Revenue Service is one of the most common interactions Americans have with the federal government. Unfortunately, this process is often time-consuming and complex. As a result, many Americans have turned to online software run by tax preparation companies to try and streamline the process. Yet these companies cause their own set of costly headaches.
Tax preparation companies prey upon low-income taxpayers, purposefully obfuscate existing free filing options for people who qualify for them, and consistently register high filing error rates for their customers. These tax filing practices and high fees are regressive, which means low-income individuals and households are disproportionately impacted. Resolving these issues would reduce the cost and complexity faced by U.S. taxpayers filing their taxes, particularly those toward the bottom of the earnings ladder. This in turn would help alleviate income inequality, and enable these individuals and households to spend their earnings on more important things or to save for the future, thus contributing more fruitfully to broader U.S. economic growth and prosperity.
In an attempt to alleviate these problems, the IRS recently released a report investigating the feasibility and cost of filing directly through the IRS via a new proposed service called Direct File. The report finds:
A majority of taxpayers reported an interest in using an IRS-provided tool to prepare and file their taxes.
Those who self-prepare their taxes, are younger, or have limited English proficiency are more likely to be interested in directly filing with the IRS.
The annual cost of the IRS providing this Direct File tool ranges from $64 million to $249 million depending on assumptions around the number of users and scope of covered tax situations.
But before looking closely at these findings and potential next steps for the IRS, it is first worth examining the uptake of current free filing options available to taxpayers, the costly impact of these tax preparation services, and the disproportionate impact these practices have on low-income individuals and households under the current system.
Issues with current Free File partnership between IRS and tax preparation companies
Despite the IRS partnering with online tax preparation companies to provide tax filing services for free—called Free File—there are few taxpayers taking advantage of Free File. Approximately 70 percent of taxpayers are eligible for Free File, but less than 3 percent of taxpayers utilize it. The Volunteer Income Tax Assistance grant program, an initiative designed to support free tax preparation services for the underserved through various partner organizations, faces even lower rates of uptake—only 0.9 percent of all tax returns comes through this program.
While this is quite damning, the negative impact of tax preparation services is even more pernicious. Companies including Liberty Tax Inc. and Jackson Hewitt Tax Service Inc., target their services toward low-income communities to take advantage of the complex tax code and taxpayers who are eligible for the Earned Income Tax Credit. (To qualify for the EITC, a taxpayer must have worked and earned income of under $59,187, have investment income below $10,300, and meet other certain qualifying rules.) Zip codes with the highest level of EITC filers have approximately 75 percent more tax preparation storefronts per filer than zip codes with more moderate levels of EITC filers.
Furthermore, government and nonprofit studies consistently show that these tax prep services have high error rates for returns filed on behalf of EITC recipients. Two separate studies by the nonpartisan U.S. Government Accountability Office found that error rates of tax preparers ranged from 60 percent up to 89 percent.
The disproportionate burden of filing taxes on low-income individuals and families
The burdens associated with filing taxes go beyond simply paying the filing fee that tax preparation companies charge. Individual taxpayers often must educate themselves on what credits they qualify for, find an appropriate method for filing their taxes, spend time gathering all the requisite materials, and then spend even more time filling out the necessary forms.
Recent estimates show Americans spend more than 1.7 billion hours and $33 billion preparing individual tax returns, with each individual averaging anywhere from 8 hours to 13 hours to 17 hours filing their personal taxes. These requirements are burdensome enough for the average American, but become even more onerous for those with more complicated tax situations.
These burdens—both in time and money spent—are regressive and disproportionately impact low-income individuals and families. Individuals with low incomes often rely on anti-poverty income support programs that are distributed through the U.S. tax code, most notably the Earned Income Tax Credit. Unfortunately, the stiff filing fees charged by large tax preparation services eat up a significant amount of that earned income, weakening a key income support for the most vulnerable workers.
One recent study conducted among service workers finds that tax refunds total anywhere from 5 to 14 percent of their estimated annual earnings, and that the median service sector worker saw 7 percent of their refund go toward tax-filing costs. For 1 in 4 workers this increased to 15 percent or more of their refund being spent on filing costs. For those who use in-person tax preparation services, filing fees can cost up to an average of 13 percent to 22 percent of a refund.
What’s more, the costs between online and in-person services vary significantly, with in-person services costing nearly 3 times as much as online filing despite it essentially being the same service. As recently as 2011, tax preparers filed approximately 60 percent of returns claiming the Earned Income Tax Credit, demonstrating just how pervasive tax preparation companies are and how much money is being left on the table by EITC recipients using their services.
The high error rates of large tax preparation services also expose EITC filers to more audits. EITC filers are more likely to be audited than non-filers, and audit rates are higher among Black Americans at all levels of income, especially Black Americans who claim the tax credit. A single Black man with dependents who claims the Earned Income Tax Credit, for example, has a 7.73 percent chance of getting audited, in comparison to 0.54 percent of Americans as a whole. This only compounds the problems faced by low-income individuals and leaves them exposed to losing potentially even more income.
IRS report on the feasibility and cost of Direct File
As directed by Congress in § 10301(1)(B) of the Inflation Reduction Act of 2022, the IRS was required to release a report investigating the cost and feasibility of an IRS-run, free e-file tax return system for filing federal taxes. The initial results of its investigation look promising, with a majority of taxpayers (up to 72 percent) saying they were either “very interested” or “somewhat interested” in using an IRS-provided tool to prepare and file their taxes. Among those who file their own taxes with commercial software, 68 percent said they were either very or somewhat likely to switch to a free, IRS-provided online tool.
Taxpayers who are younger, prepare their own taxes, or have limited English proficiency are more likely to be interested in Direct File. Interestingly, the desire for taxpayers not to pay for filing their taxes was so strong that 59 percent of respondents said they would still prefer using an IRS option even if it didn’t support filing state taxes.
There are some qualifying factors around this robust support for Direct File. Many of the preferences collected in this report are based on the assumption that Direct File would be about the same or easier to use than other tax preparation software. Other respondents indicated concerns about the motives of the IRS, potential implications for tax enforcement, and potential for preferential treatment of those who use Direct File. Many respondents also indicated they wouldn’t adopt Direct File because they’re already comfortable with how they currently file their taxes.
Despite some hesitations, many respondents were interested in Direct File specifically because it was run by the IRS. Furthermore, taxpayers who were shown a prototype of Direct File said the software exceeded their expectations when it came to ease of use and simplicity.
Some questions still remain about how Direct File would be implemented. It remains unclear whether this system would only apply to federal taxes or if it would also include an option for filing state taxes. It also remains unclear how user-friendly Direct File would be and whether it would explain the tax code in a straightforward fashion.
Finally, it’s worth highlighting the estimated cost of creating and implementing Direct File. Any cost estimate is subject to uncertainty, which is largely dependent on assumptions around how many taxpayers would use Direct File and the complexity of their tax situations. The lower bound cost estimate is $64 million, which assumes 5 million users and a narrow scope of covered tax situations. The upper bound cost estimate is $249 million, which assumes 25 million users and a broader scope of covered tax situations.
The cost of customer support accounts for more than half of the cost in every scenario, all the way up to 84 percent of the cost in the upper bound estimate. It’s worth noting that none of these estimates take into account any potential cost savings for the IRS that would result from people shifting from paper filings to Direct File. Identifying those savings due to e-filings would be well worth investigating and documenting.
Going forward, the IRS also needs to develop and implement an outreach plan to promote Direct File, as well as work with Congress and other stakeholders to ensure adequate funding is allocated for the program. While the IRS has the authority to launch this program tomorrow if it so chooses, it would require ongoing funding from Congress at adequate levels to ensure that such a program is a success.
IRS funding has been drastically slashed over the past decade, and the recent $80 billion infusion of additional funding included in the Inflation Reduction Act was cut by about $20 billion due to attacks on the agency by conservatives in Congress as part of the recent budget deal to raise the federal debt ceiling. Alongside significant opposition from tax preparation companies, it would be difficult for the agency to ensure the Direct File program is a success without additional funding from Congress.
Indeed, the new report from the IRS understands this reality. It recognizes that the agency’s “ability to deliver [Direct File] would require ongoing funding at adequate levels, and other operational considerations and challenges remain.”
Future options for reforming tax filing
While looking into and eventually developing Direct File is a logical step for the IRS to take, the agency also should investigate the feasibility of other tax filing options. Their recently released report finds that 37 percent of respondents in one survey would prefer a free “return-free” option, defined as when the “IRS prepares and files the tax return for you using W-2 and 1099 information that it receives from your employer.” Indeed, other countries and certain U.S. states have already experimented with similar programs.
The most notable example is the “Simple Return,” where taxpayers are sent a prefilled return along with a letter explaining the program. California implemented a pilot program with a Simple Return system in 2005 and 2006 before authorizing the program for widespread use in 2007. The program focused on residents who previously filed as single taxpayers with no dependents or itemized deductions and only received income from wages. For those who participated in the program and filed electronically, 95 percent said that it saved time.
For most Americans, their income only comes from wages via one employer and interest income from a single bank. Under the current system, the IRS already receives information about these common sources of income and then essentially asks taxpayers to copy that information into a tax return. If the recipients’ tax status is simple enough, then a Simple Return could be sent to them with prefilled information. For these recipients, filing a tax return could be as straightforward as checking the numbers, signing the return, and then sending a check or receiving a refund.
If taxpayers choose not to participate, they can simply ignore the prefilled return entirely or use the data as a starting point for filing their own taxes normally. A 2006 study found that a Simple Return could apply to 42 percent to 48 percent of all taxpayers, saving them up to 225 million hours of time and more than $2 billion per year in tax preparation fees. These savings are likely much higher today considering population and economic growth since the study’s release.
The IRS can benefit as well. A U.S. Government Accountability Office report from 1996 estimated that a plan similar to Simple Return could save the IRS up to $36 million per year through reduced errors in tax filings and subsequent investigations.
Of course, a Simple Return option won’t work for all taxpayers. Some taxpayers face high compliance costs because of their economic situation, for example those who are self-employed and who receive income from a variety of sources, those with multiple investments, or those with large tax-deductions. These taxpayers therefore would likely need to continue filing their own taxes.
People in these situations usually earn higher incomes and don’t fall within the two-thirds of taxpayers who take only the standard deduction and don’t itemize. Finally, it is worth mentioning that because of the U.S. reliance on the tax code to administer social programs such as the EITC and the Child Tax Credit, it may be difficult for complicated eligibility rules and conditions to get translated into a Simple Return system.
Conclusion
The creation of an electronic filing option that would allow taxpayers to submit their taxes directly to the IRS for free has the potential to both ease taxpayers’ burdens and reduce costs for the IRS. In addition to further exploring the feasibility and cost of Direct File, investigating the feasibility of a federal program akin to Simple Return can amplify these benefits even further.
No matter what program the IRS eventually chooses to implement, the recently released report provides a good first step toward exploring the feasibility of a convenient option the IRS can use to reduce the regressive burdens of filing taxes. Continuing to investigate and then implement a feasible free tax-filing service by the IRS can help alleviate income inequality in the United States and put earned income to more beneficial uses by individuals and households to boost more equitable and thus more sustainable U.S. economic growth.
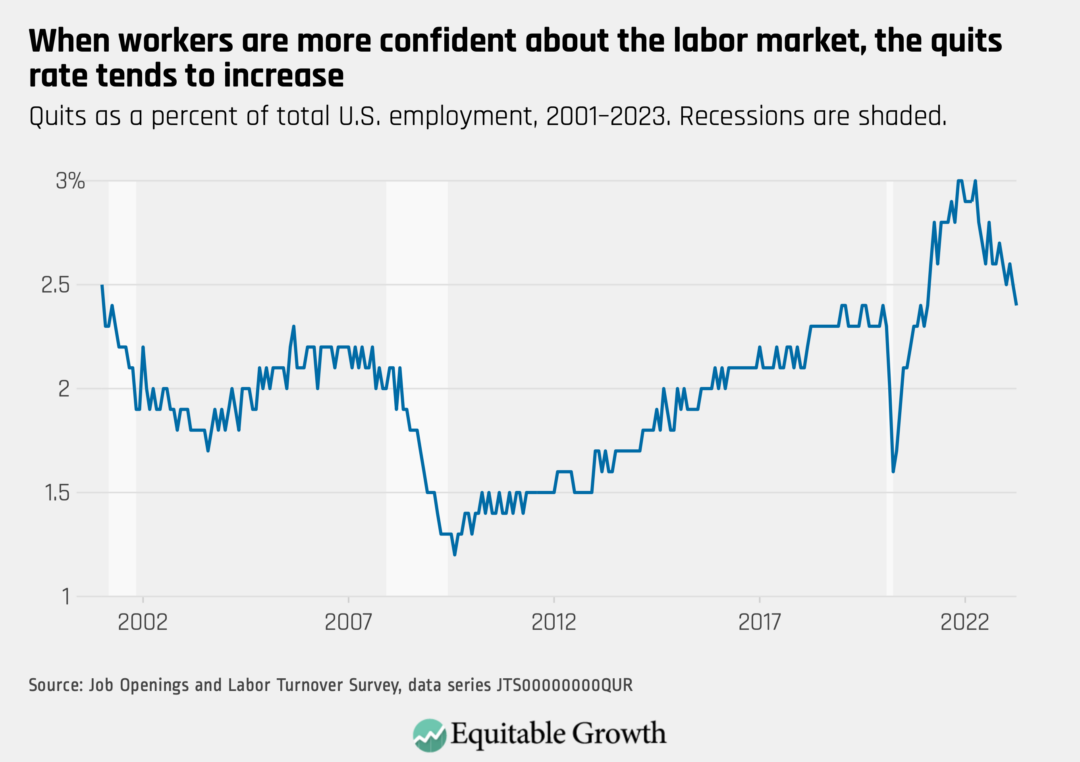
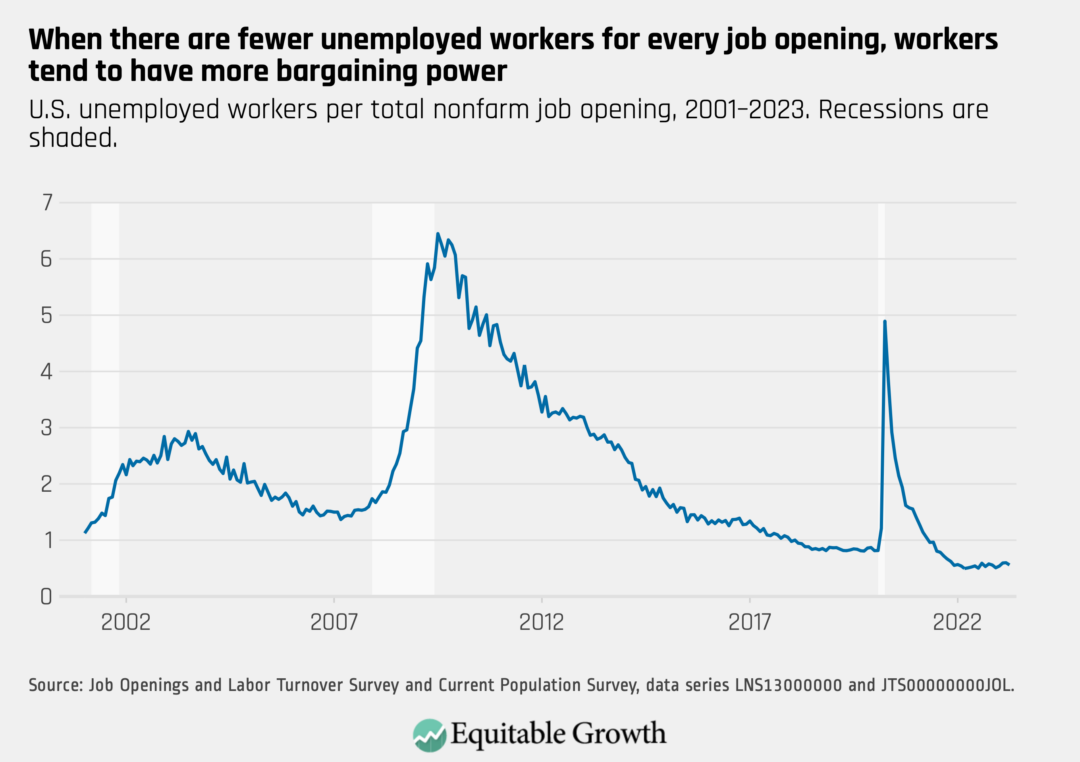
Every month the U.S. Bureau of Labor Statistics releases data on hiring, firing, and other labor market flows from the Job Openings and Labor Turnover Survey, better known as JOLTS. Today, the BLS released the latest data for April 2023. This report doesn’t get as much attention as the monthly Employment Situation Report, but it contains useful information about the state of the U.S. labor market. Below are a few key graphs using data from the report.
The quits rate fell from 2.5 percent in March to 2.4 percent in April as 3.8 million workers voluntarily left their jobs last month.
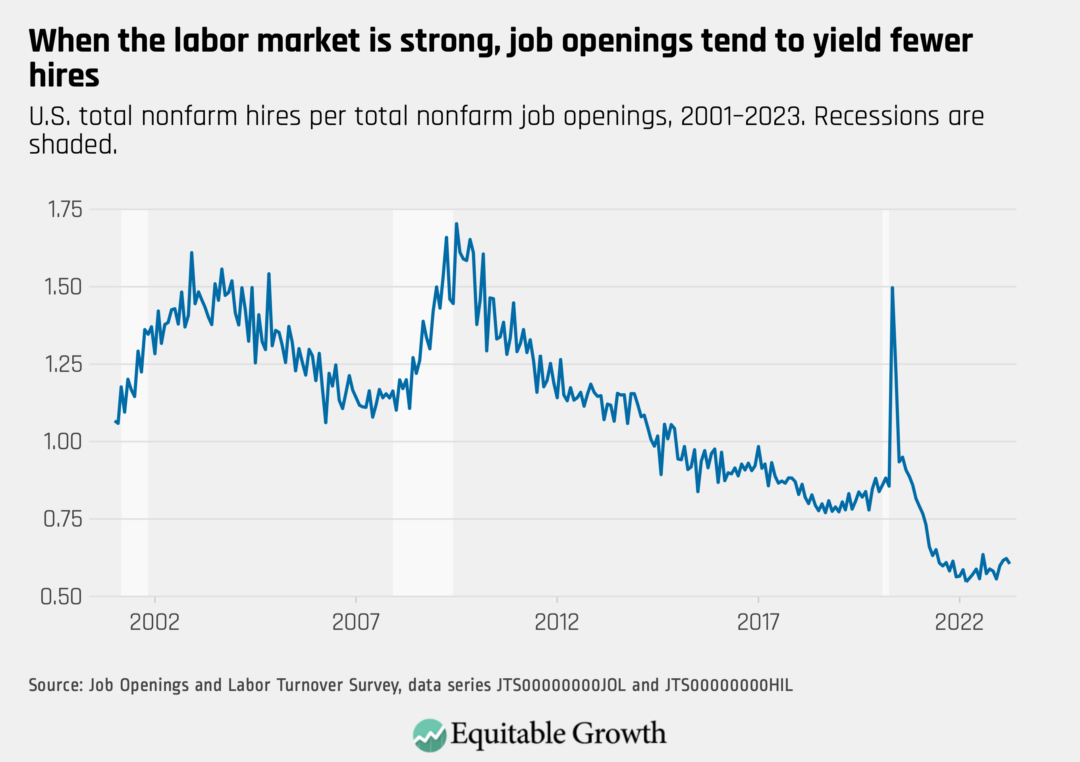
The vacancy yield, a measure that captures how easy it is for employers to fill open positions, fell in April as job openings increased to 10.1 million and hires stayed roughly the same at 6.1 million.
The ratio of unemployed workers to job openings decreased slightly in April, as the number of unemployed workers fell and the number of job openings increased.
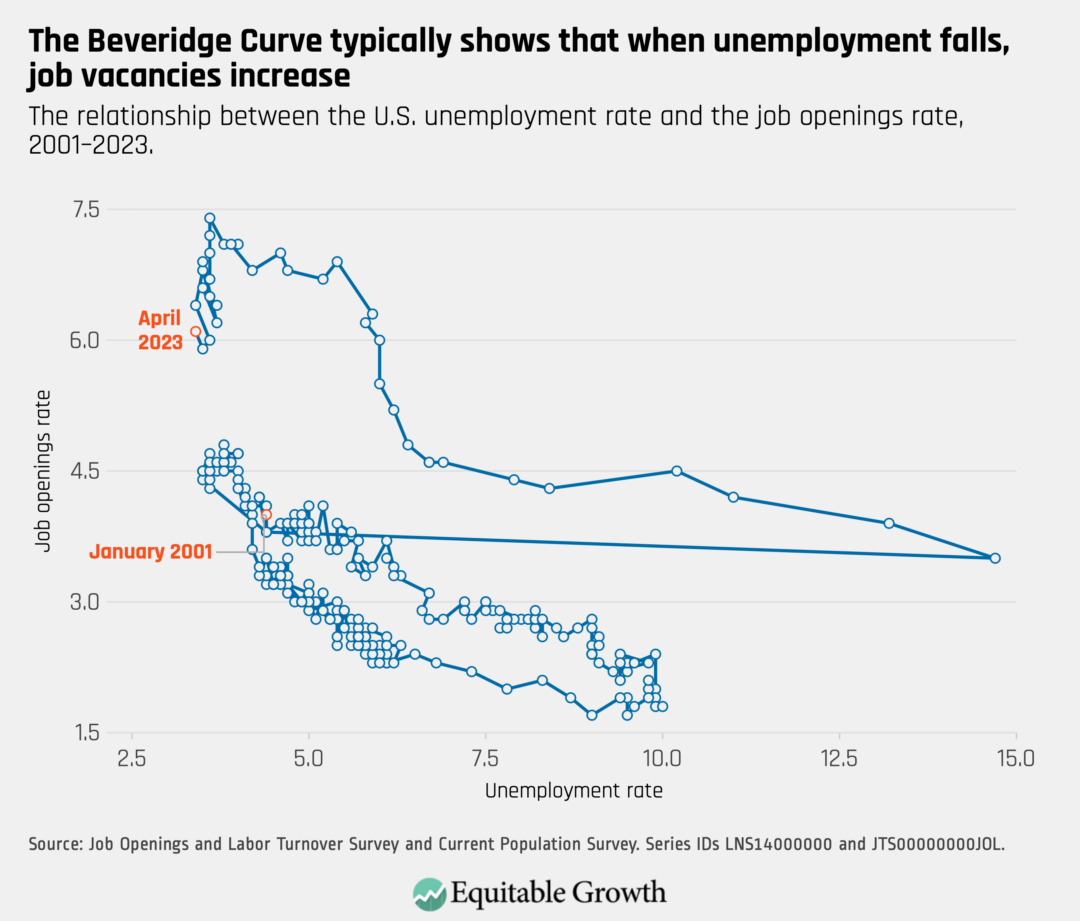
The Beveridge Curve, which typically captures that there tends to be relatively more open positions when the labor market is strong, moved up and to the left in April as the unemployment rate declined and the job openings rate increased.
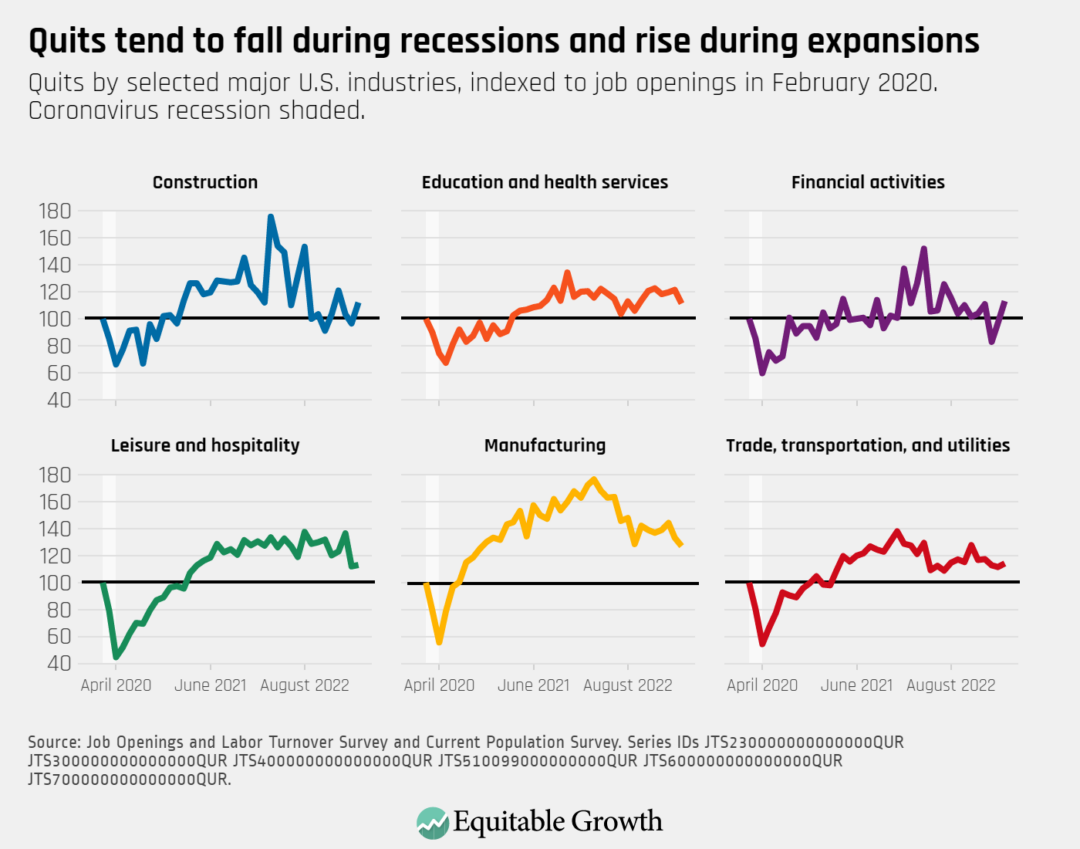
The overall number of quits fell slightly in April, including in industries such as manufacturing and education and health services. But quits rose in industries such as construction and financial activities.
The post-COVID-19 economy is a strange beast. Unemployment rates are at historic lows, but inflation—despite some cooling—remains high. Many parents continue to struggle with child care and their children’s schooling, and key income supports enacted in response to the pandemic are expiring. The prospect of recession looms as policymakers debate issues of public spending, debt, and rising interest rates.
Amid this economic uncertainty, the Supplemental Nutrition Assistance Program, or SNAP, is a lifeline for millions of families. As negotiations about the budget and the debt ceiling continue to unfold, legislators are currently debating proposals to scale back SNAP benefits and impose stricter work requirements that will make food assistance more difficult to access.
Threats to the Supplemental Nutrition Assistance Program must reconcile with the research on the program’s impressive record of results. SNAP benefits lift millions of families with children out of poverty every year. Moreover, researchers have demonstrated again and again using the most rigorous causal methods that SNAP benefits reduce “food insecurity,” or the inability to meet routine food expenses, while stimulating economic growth. Recent research estimates that every $1 in additional SNAP spending can increase the GDP by $1.54 during economic slowdowns.
These short-term benefits are striking on their own, but the reach of the Supplemental Nutrition Assistance Program into families’ and children’s well-being extends much farther.
Given these established effects, one major unknown is whether the program also has the power to disrupt the cycle of poverty, and long-standing disparities by race in the link between childhood poverty and poverty in adulthood. In our new working paper, “The Effectiveness of the Food Stamp Program at Reducing Racial Differences in the Intergenerational Persistence of Poverty,” with the Washington Center for Equitable Growth, we tackle this question head on.
We use long-term intergenerational data from the University of Michigan’s Panel Study of Income Dynamics to assess whether early exposure to the Food Stamp Program (the precursor to today’s Supplemental Nutrition Assistance Program) causally leads to a disruption in the persistence of poverty across generations. And given long-standing disparities in poverty by race, how do these causal linkages result in reductions in racial differences in the intergenerational persistence of poverty?
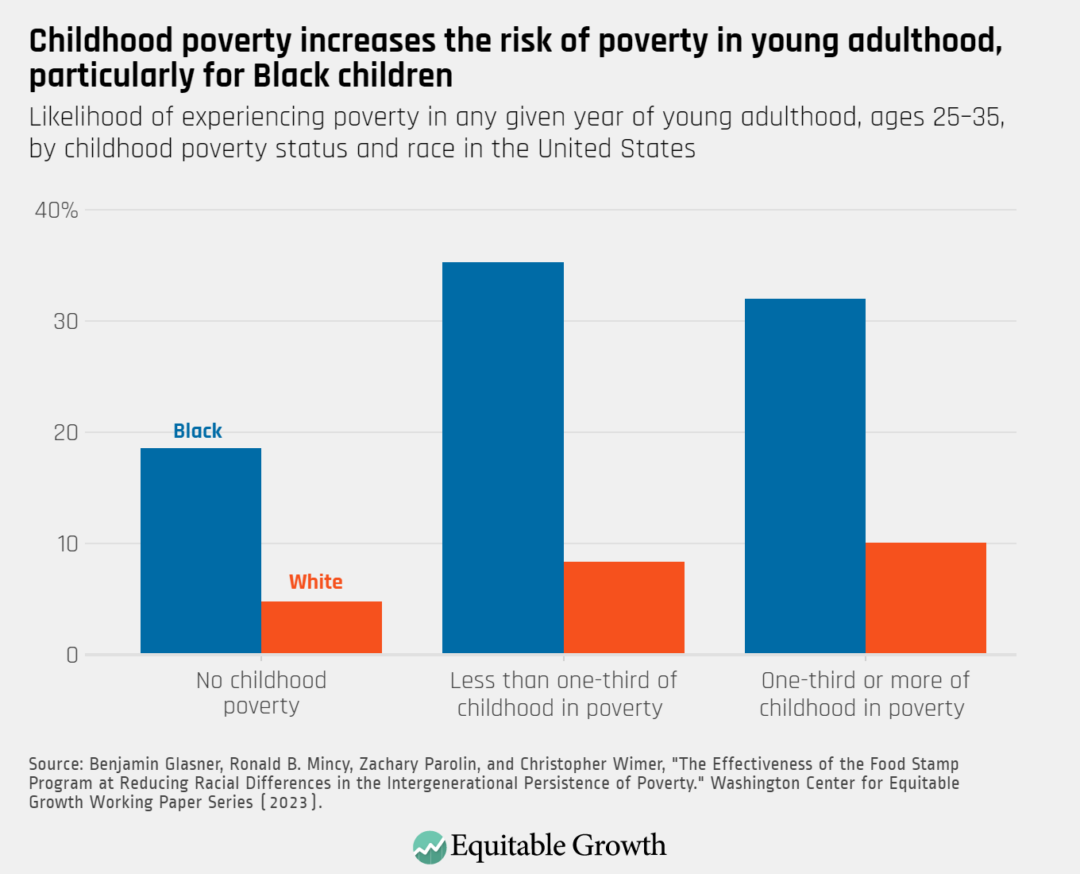
Research previously shows that experiencing poverty as a young child significantly increases the risk of poverty by the time one reaches young adulthood. And in addition to planting the seeds for poverty later in life, childhood poverty appears to exacerbate already deep racial inequities. Black children who experience childhood poverty are three times as likely to be poor in young adulthood relative to comparable White children. (See figure 1.)
Figure 1
Using the latest advances in causal inference based on the county-by-county rollout of the Food Stamp Program in the 1960s and 1970s, our paper finds that exposure to food stamps in early childhood reduces the likelihood of poverty for all adults by 5 percentage points, and that these reductions are strongest for Black individuals whose parents did not finish high school—a proxy for childhood poverty. Among these respondents, childhood exposure to food stamps led to a 7 percentage point reduction in adult poverty.
In addition to reducing the likelihood of overall poverty in adulthood, the Food Stamp Program also reduced the depth of poverty individuals experienced as adults. For Black adults exposed to food stamps as children, we saw an 8.6 percentage point reduction in deep poverty in young adulthood (income less than half the poverty line).
The takeaway is clear: income support from food stamps in early childhood not only has long-reaching effects into adulthood, but also holds power for reducing racial inequality in the cycle of poverty. As policymakers debate the future of policies such as the Supplemental Nutrition Assistance Program, it is critical to understand this program does more than just reduce hunger and food insecurity. It also contributes to our nation’s widely-shared goal of promoting equality of opportunity. This program’s role in promoting opportunity and mobility promotes both short-term stability as well as long-term economic growth.
The White House last month unveiled a proposed update to an obscure but highly influential government document called the Circular A-4, which governs how the federal government conducts regulatory cost-benefit analysis. The announcement of the proposal and the accompanying executive order, both of which were foreshadowed by an earlier presidential memorandum on “modernizing regulatory review,” was not front-page news, yet if the proposed revisions to the A-4 are adopted they will have major consequences for regulatory policy across the federal government.
More specifically, the proposed reforms to the Circular A-4 would nudge federal agencies to account for inequality across an array of categories—from income and wealth to geography, race, and age—when analyzing regulations. While this kind of distributional analysis was allowed under the previous iteration of the Circular A-4, the Biden administration’s proposal would provide agencies with clearer guidance on how to conduct the analysis and how to embed and weight distributional effects in their decision-making.
This issue brief covers the following topics:
The history of the Circular A-4 and why agencies aren’t already conducting distributional analysis
How distributional analysis can help policymakers make sounder and more equitable decisions about economic policy
A summary of the Biden Administration’s proposed guidance on distributional analysis, which is evidence-backed and reflects the current state of economic research
Potential improvements, use cases, and next steps for the proposal
The Biden administration’s proposed new approach, if successfully implemented, would be the first time that distributional analysis is systematically incorporated into regulatory reviews, helping policymakers better understand the impact of their decisions on inequality and the economy writ large.
The history of the Circular A-4 and why agencies aren’t already conducting distributional analysis
The Circular A-4 is the official guidance to federal agencies from the White House Office of Information and Regulatory Affairs within the U.S. Office of Management and Budget on how to conduct regulatory impact analysis, which is used to justify most major regulatory decisions.1 The Circular A-4 was last revised two decades ago and is significantly out of date given the wealth of evidence-based research and analysis since then on key economic topics such as inequality, market power, and behavioral biases.
The U.S. Congress, of course, writes the nation’s laws, but the legislative branch delegates immense rulemaking powers—including some of the thorniest policy design and implementation decisions—to expert agencies in the executive branch. These agencies, operating under the auspices of the president, promulgate rules that have the power of law, making these executive actions one of the most important channels through which economic policy gets made, especially during periods of divided government.
A key part of many regulatory impact analyses is a cost-benefit analysis, which must show that the benefits of regulating in the way an executive branch agency proposes outweigh the costs of doing so—or that the costs are justified for other reasons. The objective is to take the regulatory approach that maximizes net benefits.2 This analysis is done by agencies estimating, monetizing, and summing all the costs and benefits impacting the populations affected by the draft proposal. The agencies then compare that against a baseline of costs and benefits that are projected based on the assumption that the proposed policy will not be enacted, and calculate the resulting total net benefits.
The White House Office of Information and Regulatory Affairs then reviews the agency’s work and circulates it for feedback among other government agencies. If OIRA officials find the analysis and policy satisfactory, then they allow the agency charged with implementing the rules to move forward with the rulemaking.3
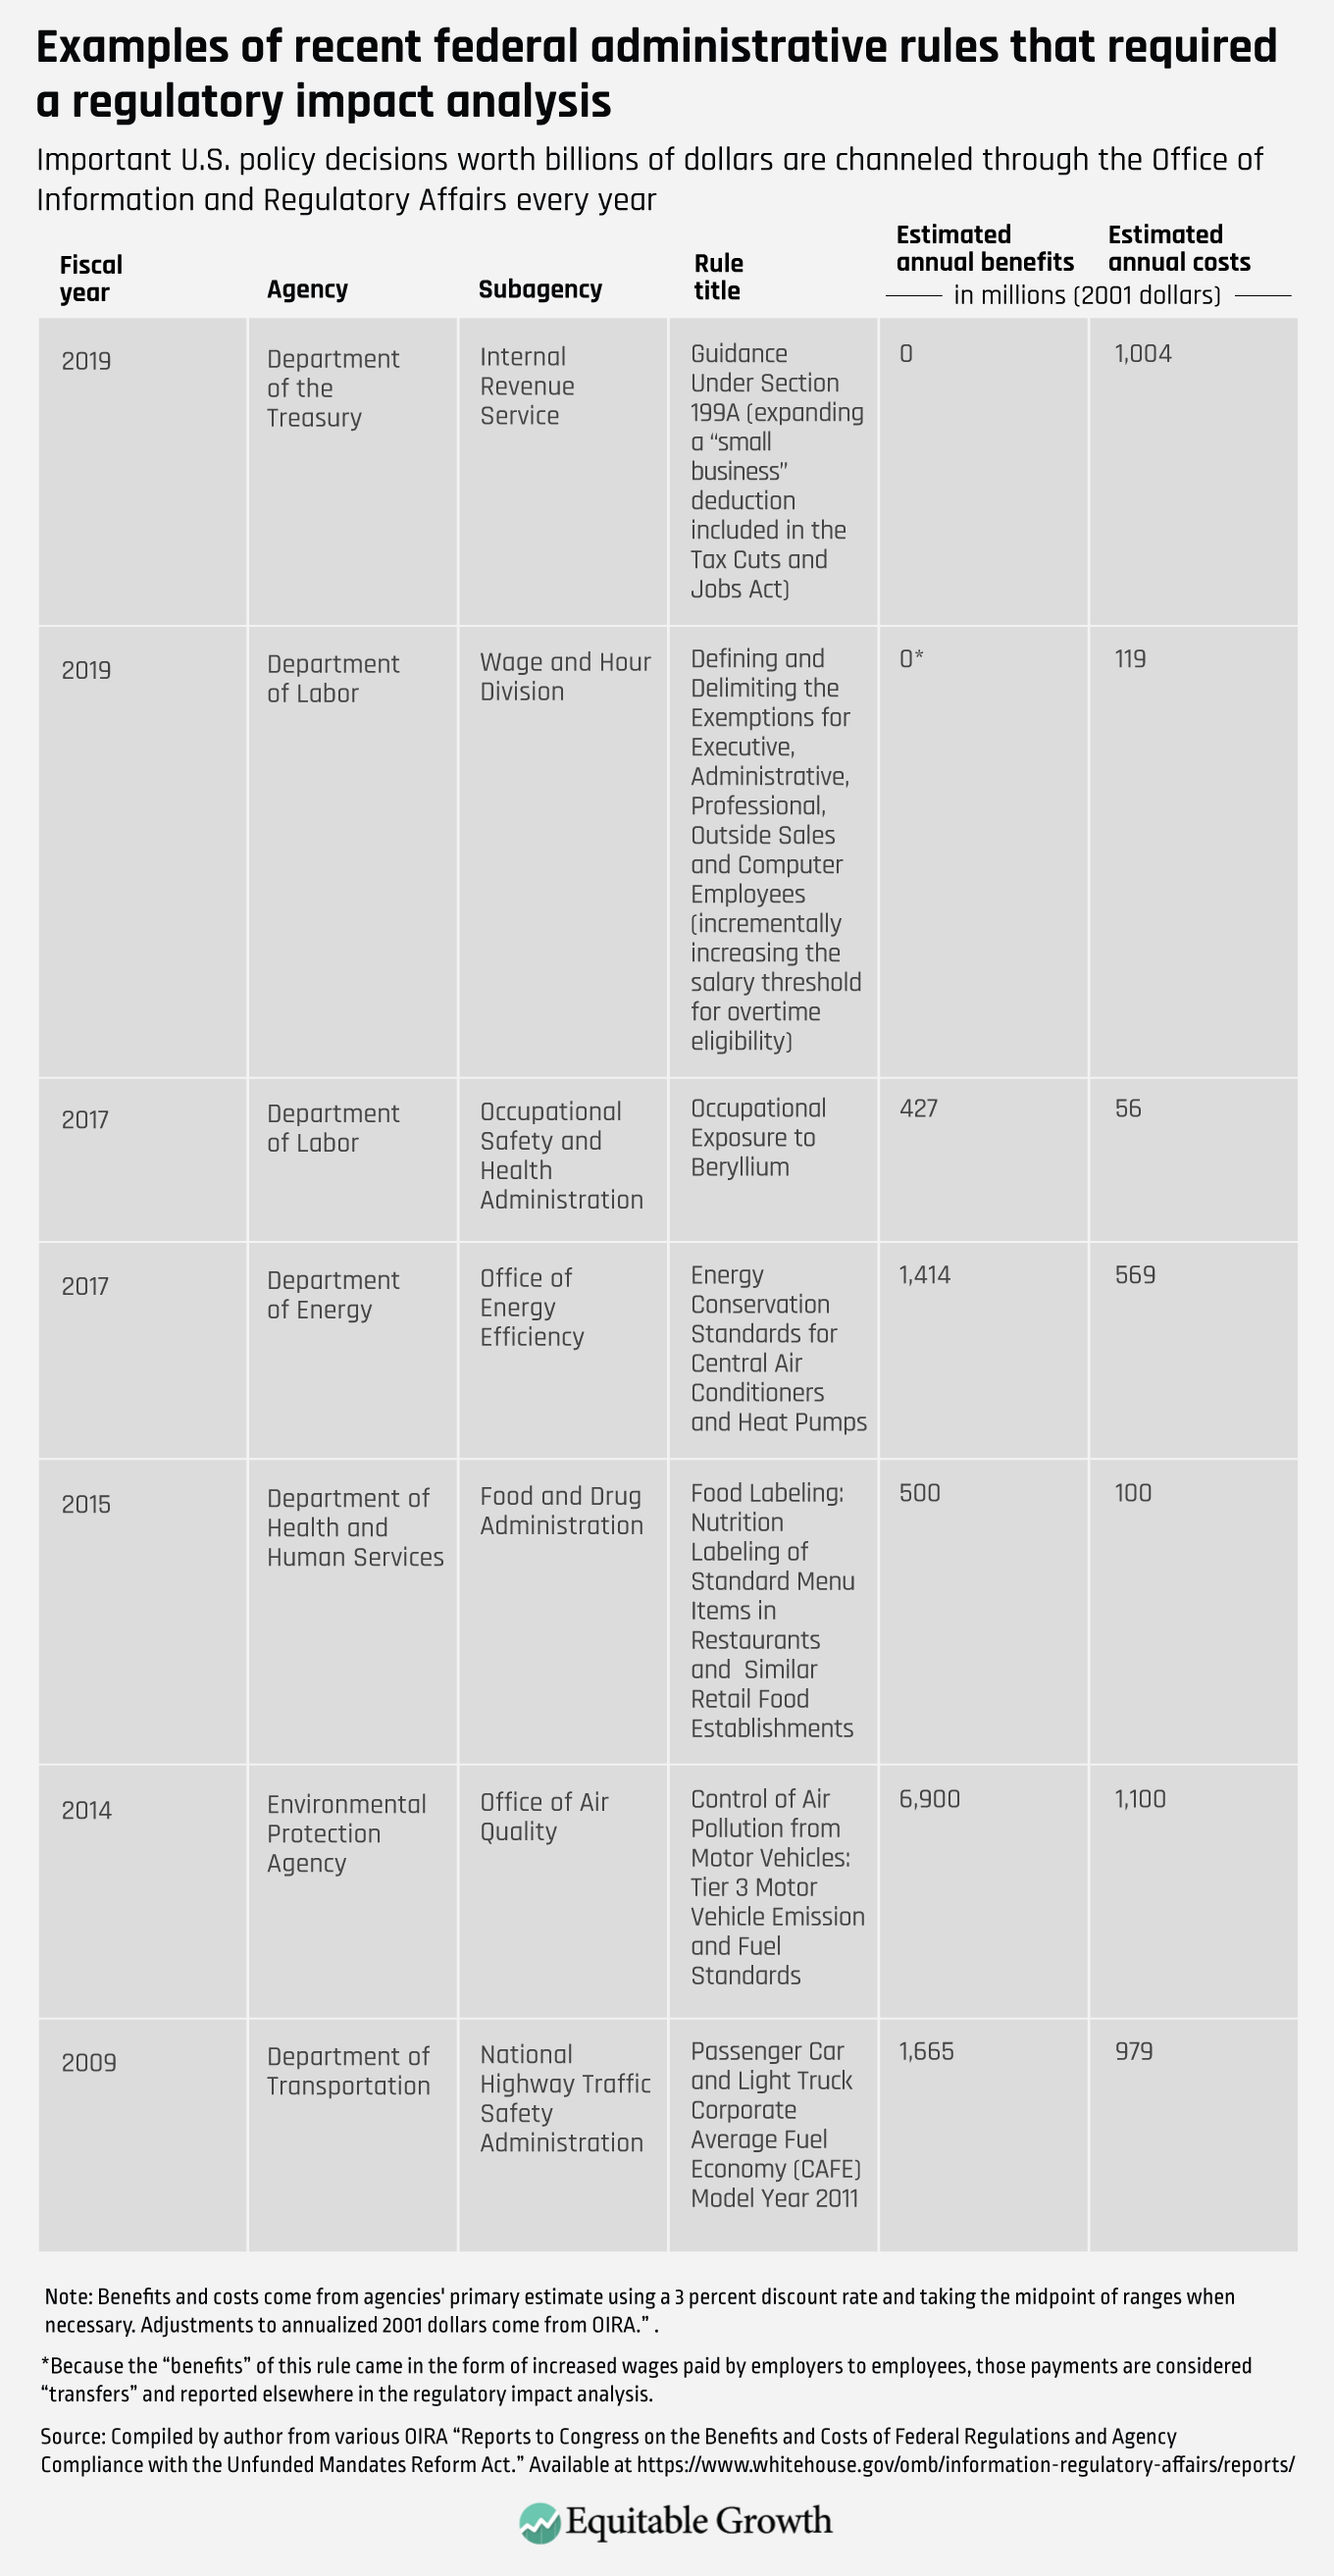
This process sounds highly technical and bureaucratic—and it is. But it is also of vital importance. The choices that agencies make on how to conduct cost-benefit analyses in advance of rulemaking determine exactly how a rule will be designed and implemented, which in turn sets federal policy on everything from mitigating climate change and protecting worker safety, to the pricing of life-saving medicine and designing income support programs such as Unemployment Insurance and the Supplemental Nutrition Assistance Program. (See Table 1 for examples of recent rules that have gone through OIRA review.)
Table 1
The Biden administration’s proposed revision to the A-4—and to a sister document, the Circular A-94, that guides agencies’ cost-benefit analysis of federal spending programs—are far–ranging, affecting important methodological questions around issues such as:
Discount rates, or how to treat costs and benefits that appear in the future
Quantification, or how to treat costs and benefits that are especially hard to quantify or monetize
Uncertainty, or how to treat costs and benefits that are inherently speculative or that affect populations who are not perfectly risk-neutral
Global impacts, or how to treat costs and benefits that affect foreigners and American citizens living abroad4
This brief, though, focuses solely on distributional analysis, the most concrete way that cost-benefit analyses incorporate equity into regulatory decision-making.
The A-4’s current approach to distributional analysis
Past presidential administrations have paid lip service to distributional analysis being a key input to regulatory policy decision-making. In 1993, then President Bill Clinton issued what is now the key executive order governing the regulatory review process (#12,866).5 This executive order for the first time included “distributive impacts” and “equity” as examples of what constitute “net benefits.”
President Barack Obama reaffirmed that approach in his Executive Order (#13,563) on “improving regulation and regulatory review” in 2011, but he did not revise Circular A-4, which was issued in 2003 by President George W. Bush. The Trump administration, for its part, kept the existing regulatory review process intact, though it was often caught conducting cost-benefit analysis shoddily and in bad faith. President Trump also instituted a “one in, two out” rule that focused on minimizing regulatory costs rather than maximizing net benefits. President Biden rescinded this rule on his first day in office.
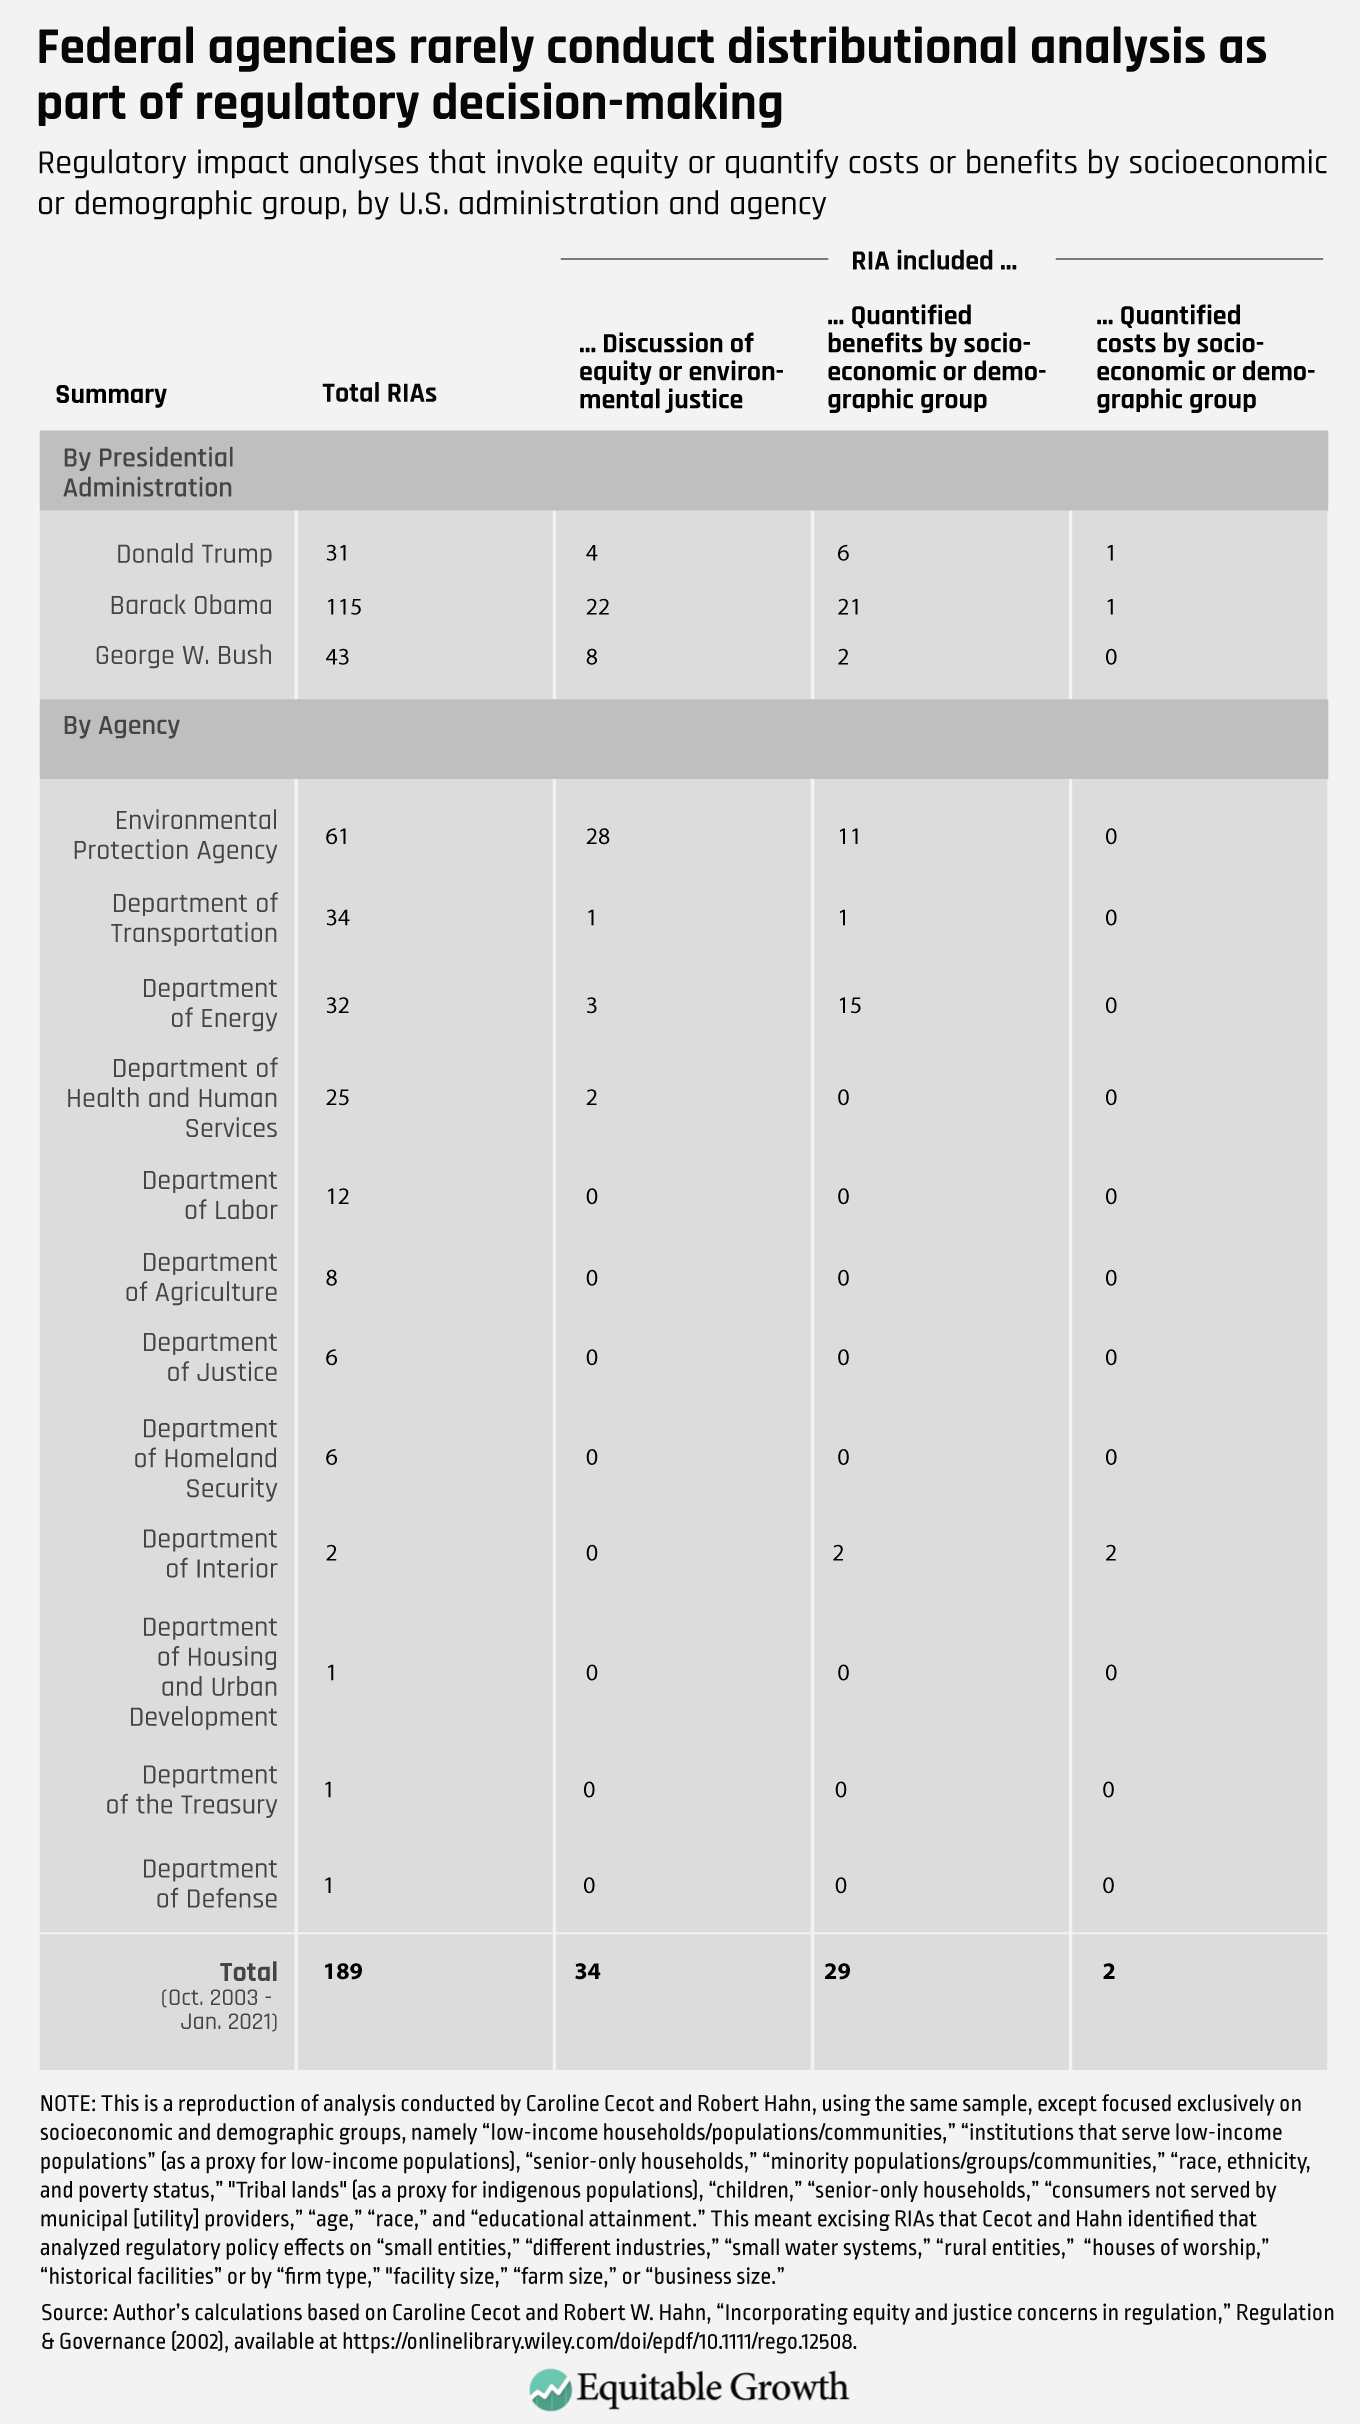
The 2003 A-4, which is what the Biden administration is now trying to revise, directs agencies to “provide a separate description of … how both the benefits and costs are distributed among sub-populations of particular concern … so that decision-makers can properly consider them along with the effects on economic efficiency.” But this analytical mandate is rarely followed by federal agencies in any meaningful way, according to research by legal scholar (and now OIRA administrator) Richard L. Revesz, and his co-author Samantha Yi at New York University School of Law. This has been true even during the first two years of the Biden administration,6 and has been corroborated by others.
Caroline Cecot at George Mason University’s Antonin Scalia School of Law and Robert W. Hahn at the University of Oxford, for example, analyzed 189 regulatory impact analyses published between October 2003 and January 2021, finding only two that quantified net benefits for a specific socioeconomic or demographic group, and only 18 percent that referenced equity in any way, with most of those references being made by the U.S. Environmental Protection Agency. (See Table 2.)
Table 2
Obstacles to change
There are a number of reasons—some good and some bad—for why agencies today mostly overlook the distributional consequences of their actions. Among them are concerns about:
Analytical irrelevance
Judicial review
Data limitations
Undue delay
Political transparency
Unclear guidance
Let’s examine each briefly below.
Analytical irrelevance
Some who conduct cost-benefit analyses at executive branch agencies justify ignoring distributional concerns by claiming that their job is to maximize total pre-tax dollars produced in the economy, then leave it to the nation’s progressive tax system to more efficiently redistribute as much as society desires.
But that is increasingly an unrealistic assumption, because the U.S. tax system has grown less progressive in recent decades, a result of misguided and outdated views on the benefits of tax cuts and the outsized political influence of the rich. As Zachary Liscow at Yale Law School notes (before he took his current role as Associate Director for Economic Policy at the Office of Management and Budget), the distributional effects of legal rules in our current political economy are “sticky,” meaning Congress is unlikely to revise the tax code or make other policy changes in response to a regressive regulation. Therefore, it makes sense to include distributional analysis in modern regulatory cost-benefit analysis to ensure rulemakings don’t needlessly perpetuate different forms of economic inequality.
Judicial review
Federal regulations are consistently challenged in court, and judges—particularly powerful ones on the U.S. Supreme Court—have used recent precedent-setting cases to push the law to be less deferential to agency rulemaking authority. Nationwide (or “absent-party”) injunctions against agency actions, once a rarity, have become commonplace. Additionally, Congress has provided inconsistent guidance on regulatory impact analysis. This allows the judiciary to fill in gaps, and in some cases, to require agencies to conduct more pre-promulgation analysis than what’s called for in the main statute governing federal rulemaking—the Administrative Procedure Act—which itself doesn’t explicitly require cost-benefit analysis.
In such a hostile judicial environment, agencies are reticent to change practices, especially in ways that could be seen as giving special treatment to certain citizens. This concern, however, should not outweigh good historical and policy reasons for federal agencies to ensure public investments in social infrastructure and accompanying income support programs reach historically underserved communities.7
Data limitations
Doing cost-benefit analysis well is hard enough when analysts are simply estimating average, society-wide effects. Making the analysis more granular by looking at population sub-groups adds an additional element of difficulty, especially in policy areas that lack good data on the incidence of costs and benefits.
Academics have spilled much ink on perennial policy questions such as who bears the cost of the corporate tax. But more novel questions of cost incidence, such as who pays for prescription drug development, or how improvements in the local environment might increase rents, suffer from a lack of well-calibrated models. In some cases, the only analysis comes from the regulated industry itself using proprietary data, an obviously biased source.
Undue delay
Even in the rare cases where solid distributional data are available, conducting a rigorous distributional analysis takes time, which agencies often don’t have. Theevidenceismixed on just how “ossified” the regulatory process is, but there is no denying that rulemaking takes longer and there are more potential pitfalls than in the past.
In 2012, for example, the non-partisan Government Accountability Office found that the U.S. Occupational Safety and Health Administration takes, on average, more than seven years to promulgate a new worker safety standard, a result in part of excessive procedural requirements. So requiring agencies to do more analyses before presenting their findings for OIRA review could dissuade them from regulating at all or further slow an already torturous process with many choke points.
Political transparency
It is not entirely true to say that executive agencies and the White House do not consider distributional concerns at all. Indeed, political appointees are notoriously attuned to who will win or lose from a regulatory decision, and thereisevidence that they intervene at times behind the scenes to push for a particular constituency. And constituency groups themselves are of course not shy about weighing in with agencies and OIRA if they believe their interests are at stake.
By not including distributional analysis in the regulatory impact analysis—or by merely including a perfunctory qualitative statement—political decision-makers are shielded from the public accountability that would come from a systematized and transparent approach. This may be, at least in part, by design, helping to explain why agencies have been slow to adopt previous nudges from OIRA and why OIRA has not insisted on agencies changing their practices.
Unclear guidance
Finally, the lack of specific guidance from the Office of Information and Regulatory Affairs on how to conduct distributional analysis is a serious problem. According to NYU’s Revesz and Li, the current A-4 “deals with distributional issues in a perfunctory and unhelpful manner,” leaving key questions unanswered, among them:
Which sub-populations should be highlighted and how should they be defined?
What trade-offs (real or imagined) should agencies be prepared to make? Is the goal to minimize harm to or reduce the burden on disadvantaged communities, or is to reduce inequality across the population?
These are thorny questions that need clear answers from the Office of Information and Regulatory Affairs.
How distributional analysis can help policymakers make sounder and more equitable decisions about economic policy
By not conducting a distributional analysis, agencies are allowing two flaws of traditional cost-benefit analysis to fester, and are thus providing incomplete information to policymakers tasked with making critical regulatory decisions. To counteract this, agencies must, where possible:
Disaggregate cost-benefit analyses to capture how differences by income, wealth, race, ethnicity, region, and other socioeconomic and demographic factors are affected.
Reweight cost-benefit analysis so as to not underestimate or overlook possible adverse impacts on low-income and less wealthy Americans.
Let’s briefly consider each of these issues in turn.
The need for disaggregating cost-benefit analysis
As we know from other key economic indicators, an analysis that focuses just on society-wide aggregates or averages will inevitably conceal variation across the population. Simply stated, the costs and benefits of regulations (and other policies) rarely accrue equally up and down the income and wealth ladders, across regions, or among different demographic groups.
Relaxing a financial regulation, for example, might increase the incomes of banks and their executives while pushing middle-class investors into financial products with higher fees. But if the benefits to Wall Street firms and their senior executives outweigh the costs to Main Street, then the regulation would pass a cost-benefit analysis test, and under current rules, little consideration would need to be paid to which groups were reaping more of the benefits or accruing more of the costs.
This isn’t purely theoretical. In 2017, the Trump administration proposed multipledelays to the so-called “fiduciary rule,” which would have required certain financial advisers to serve in the best interest of their clients in more instances, reducing conflicts of interest in the financial advice market. To effectuate the delays, the Trump administration’s U.S. Department of Labor conducted a regulatory impact analysis that argued that the costs of delay to investors were justified by the benefits in reduced compliance burdens. This analysis was suspect on its face, but it would have been particularly scandalous if the Trump administration had disaggregated the costs and benefits by income or wealth since that probably would have revealed the extreme regressivity of the proposal.8
The lack of distributional analysis also is problematic because the conventional approach to cost-benefit analysis is already weighted against low-income and low-wealth Americans. The currently prescribed way that agencies calculate costs and benefits employs so-called “willingness-to-pay” and “revealed preference” models that use sophisticated methods to quantify how much value individuals place on avoiding certain costs or acquiring certain benefits.
These two models often quantify how much extra consumers are willing to pay for additional safety features in cars, for example, or how much higher salaries workers demand for slightly riskier jobs. The underlying assumptions of these models privilege those who are able to place higher dollar figures on costs and benefits simply because they have more money overall to spend.
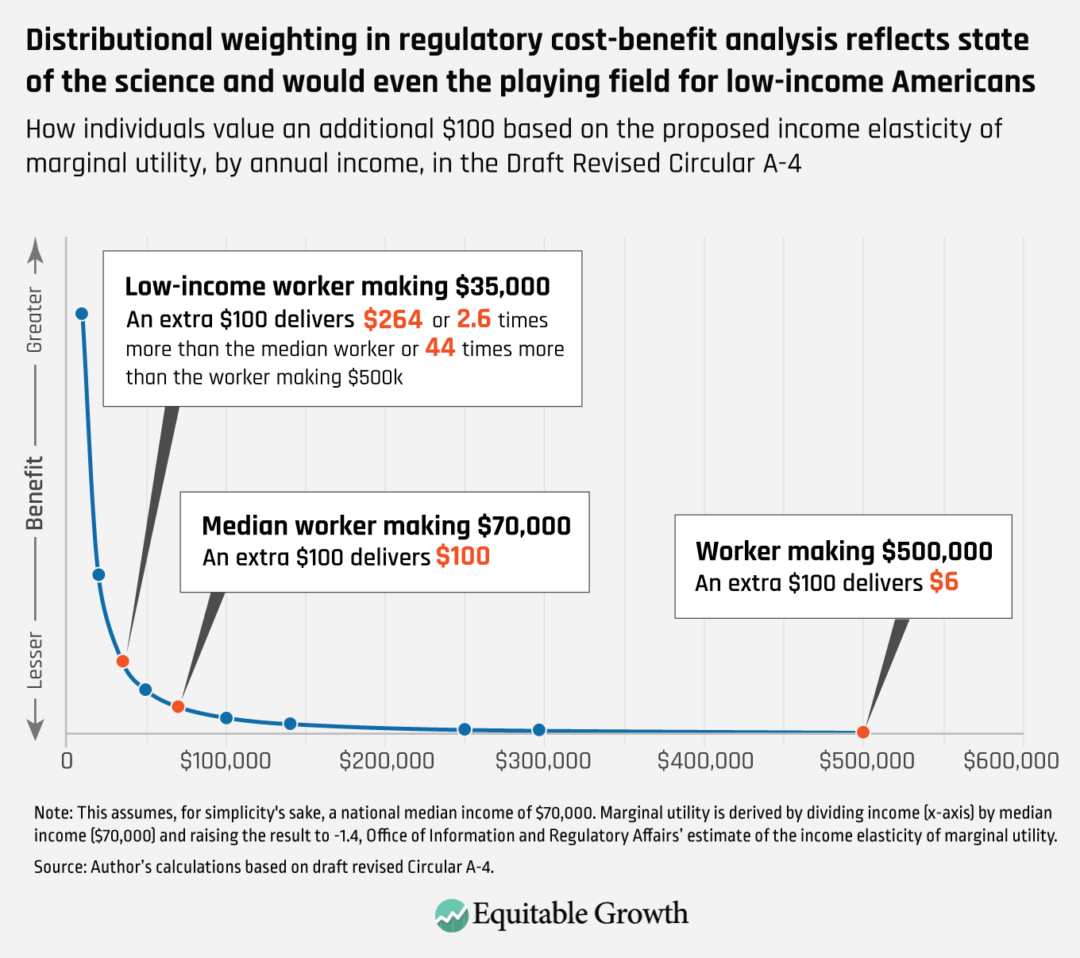
Importantly, this is true even if those higher dollar figures don’t equate to higher utility or well-being for the recipients. The economic term for this is diminishing marginal utility, but you don’t need formal economic training to know, intuitively, that $100 for Bill Gates is less valuable to him than is $100 for a low-income person. Yet current cost-benefit analyses treat both amounts at face value.10
Because of the structural racism baked into our history and economy, Black, Latino, and Native American people are overrepresented among the low-income, and so are especially hurt by this practice, which can be particularly harmful when the policy questions at issue have major distributional consequences.
A concrete example comes from the U.S. Department of Transportation. It currently puts greater weight on the time savings that accrue to richer Americans than poorer ones when determining which transit infrastructure projects to pursue, which will ultimately lead to the building of more airports and fewer bus lines, all else being equal.
This approach, as Yale Law School’s Liscow explains, makes sense purely as a matter of efficiency because airport travelers tend to have higher earnings potential—a measure of how much they value their time—so reducing their transit delays technically creates more value in the economy. But he points out that measuring efficiency in this way assumes the creation of an extra $200 of value in the U.S. economy is always superior to creating $199 of value—even if the $200 accrues to an already-rich person who gains no utility from the money and the $199 accrues to a lower-income person who will use the money to greatly improve their standard of living.11
This is why, as I’ve written elsewhere, that producing a cost-benefit analysis without information on who will win and lose from the rulemaking proposal is doomed to reproduce existing inequities.
A summary of the Biden Administration’s proposed guidance on distributional analysis, which is evidence-backed and reflects the current state of economic research
The Biden administration immediately recognized the promise of more robust distributional analysis. On day one of his term, President Biden issued a memorandum calling for the revision of Circular A-4 and new “procedures that take into account the distributional consequences of regulations, including as part of any quantitative or qualitative analysis of the costs and benefits of regulations, to ensure that regulatory initiatives appropriately benefit and do not inappropriately burden disadvantaged, vulnerable, or marginalized communities.”12
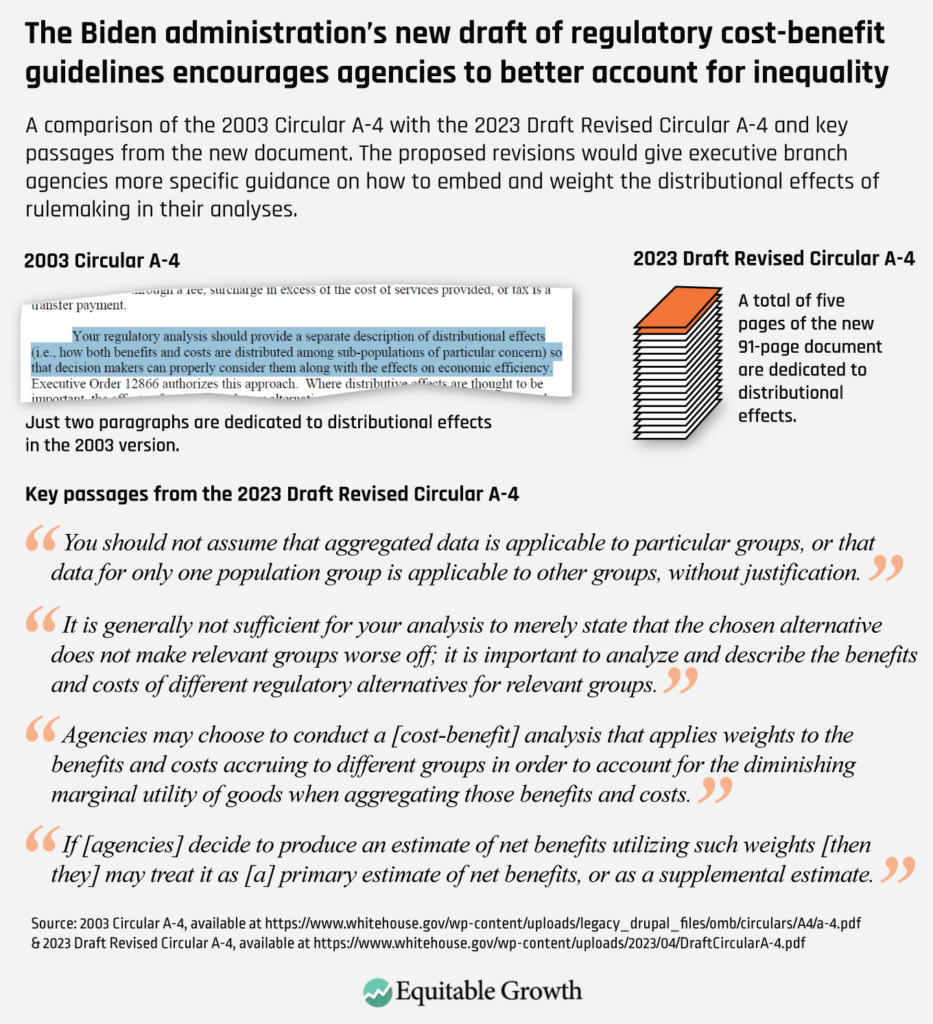
Last month, the White House released its proposal, which attempts to go further than previous administrations when it comes to centering equity and distribution in regulatory impact analyses. Indeed, the 2003 A-4 spent two paragraphs on “distributional effects,” whereas the 2023 draft revision spends roughly five pages on the topic, and the preamble to the revision spends another five pages. (See Figure 1.)
Figure 1
There are five key elements in the new proposal related to distribution, which are mirrored almost identically in the A-94 proposal.13 They are:
Equity as a rationale for taking regulatory action
Optional distributional weighting incorporated into analysis
Relevant sub-groups determined by executive branch agencies
Optional inclusion of transfers incorporated into analysis
Other specifics described in guides to be written by executive branch agencies
A brief analysis of each of these key elements in the new draft A-4 proposal follows.
Equity as rationale for taking regulatory action
Every regulatory impact analysis conducted by a federal agency must include a statement from that agency on the need for regulatory action. Historically, based on OIRA guidance, these statements have focused on correcting market failures, a reflection of the neoliberal ideology that reigned in 2003 when the current A-4 was written.
The proposed revision would better capture the progress scholars have made in understanding how the U.S. economy actually works—namely, that economic inequality, climate change, institutional racism, behavioralbiases, monopsony, and other forms of market power pose serious short-term and long-term threats to broad U.S. economic prosperity and growth. In the draft revised A-4 proposal, for example, “promoting distributional fairness and advancing equity,” is now broken out as a separate “common need for regulation” that agencies can invoke when justifying their regulation.
Optional distributional weighting incorporated into analysis
The proposed OIRA draft guidance opens the door to a major change in how cost-benefit analyses by executive branch agencies incorporate distributional information by encouraging them to consider weighting the costs and benefits to account for the aforementioned diminishing marginal utility of income. The White House regulatory agency even provides a number, 1.4, that it says is a “reasonable estimate of the income elasticity of marginal utility.”
This number connotes that someone making a median income—roughly $70,000 in the United States today—would value an additional dollar 2.6 times greater than someone making double the median income ($140,000) and 4.7 times greater than someone making triple the median income ($210,000). Said another way, $100 to the person making $210,000 produces the same utility, or well-being, as when a median worker making $70,000 receives $21.48.14 (See Figure 2.)
Figure 2
Given the individual subjectivity involved in translating income into utility or welfare, there is no way to know for sure that 1.4 is the “correct” weight, but the Office of Information and Regulatory Affairs based its estimate on academicevidence that reverse engineers from trade-offs that individuals are observed making in the real world, such as between insurance and risk at various premium costs. Deriving the number is complicated, but much of the scientific literature finds a value of between 1.2 and 1.8, putting the OIRA’s estimate well within the range.
The new proposal says that executive branch agencies can use this weight, either within their primary cost-benefit analyses or as supplemental analyses, to discount costs and benefits that accrue to high-income Americans and amplify the costs and benefits that accrue to low-income Americans. A numberofscholarsdescribe how these weights—as part of what’s sometimes called a utilitarian or “prioritarian” social welfare function15—could be implemented, and the United Kingdom prescribes such an approach in its own guidance document for cost-benefit analyses.16 But this new proposal would be a major sea change for how cost-benefit analysis is conducted in the United States.
Put simply, it would level the playing field between low- and high-income Americans by essentially transforming everyone’s willingness-to-pay into that of a median-income American for purposes of cost-benefit analysis. So when a low-income American is willing to spend $100 to, say, live closer to public transit, that would count, under a weighted cost-benefit analysis, as a willingness-to-pay of $264, or the amount that a median-income American would pay to get the same benefit.
Given the work involved in doing a thorough distributional analysis, and the fact that some rules will not have many distributional effects, the Office of Information and Regulatory Affairs leaves it to agencies to determine which rules are “most likely to have differentiated effects on particular demographic groups and to analyze important distributional effects in those cases.”
Relevant sub-groups determined by executive branch agencies
The Office of Information and Regulatory Affairs’ proposed draft lists a number of types of economic and demographic categories that could be considered as part of a distributional analysis. They include race and ethnicity, sex, gender, geography, wealth, disability, sexual orientation, religion, national origin, age or birth cohort, family composition, or veteran status. This is consistent with President Biden’s presidential memorandum on modernizing regulatory review, which, as mentioned above, directed the U.S. Office of Management and Budget to update its practices so as to “appropriately benefit and … not inappropriately burden disadvantaged, vulnerable, or marginalized communities,” though those descriptors were not defined.17
The proposed draft guidance provides few details about which subpopulations to build analyses around. Instead, the OIRA proposal defers to agencies to decide which groups are most relevant for their set of regulatory policies.
Optional inclusion of transfers incorporated into analysis
In economic parlance, “transfers” are payments from one party to another, such as government to households, consumers to producers, or employers to workers. Economic theory holds that these payments are made without anything provided in return, often as a result of a government directive or market power. Since economists think of transfers as not affecting total social welfare (not changing the size of the pie), they have historically been reported separately in agencies’ regulatory impact analyses.
Under the new draft OIRA guidance, executive branch agencies are given the option, for the first time, to include transfers directly in their cost-benefit analyses as both a benefit to the transferee and a cost to the transferer. Though transfers, by definition, cancel out when calculating a net benefit, they can be very relevant in a distributional analysis. The so-called “overtime rule” from the U.S. Department of Labor is a good example. As referenced in Table 1 above, increasing the number of workers eligible for overtime is, in economic terms, a forced economic transfer from employers to employees. As such, those higher wages are not counted as benefits—resulting in an incomplete picture of the rule’s impact.
Similarly, in 2019, the Trump administration proposed a restriction to eligibility for the Supplemental Nutrition Assistance Program in which the billions in benefits cuts appeared only as a “transfer” from beneficiaries to the federal government in the regulatory impact analysis. The new OIRA draft guidance specifically mentions distributional analysis as a reason agencies might want to include transfers in future cost-benefit calculations.
Other specifics described in guides to be written by executive branch agencies
Distributional analyses can take many forms depending on the policy area at issue. The new draft OIRA guidelines recommend that executive branch agencies create their own guidelines for incorporating distributional analysis into the cost-benefit analyses they submit to the Office of Information and Regulatory Affairs.
Agencies already have guidancedocuments along these lines, but they would likely need to be updated once the new A-4 is finalized.
Potential improvements, use cases, and next steps for the proposal
If finalized, these proposed reforms would constitute a major shift in approach to distributional analysis in the regulatory review process. The weighting in particular, while optional, would likely provide the specific guidance that executive branch agencies need to start experimenting with more fulsome incorporation of distributional analyses into their cost-benefit analyses.
The proposed reforms also would allow for future administrations to build on this foundation to require distributional analysis for certain types of rules. If the technique takes hold at the regulatory level, one could imagine other statisticians, such as those estimating national personal income at the U.S. Department of Commerce’s Bureau of Economic Analysis, or legislative analysts, such as those scoring bills at the Congressional Budget Office, taking a similar approach. Representative Ro Khanna (D-CA) and Senator Elizabeth Warren (D-MA), for example, have introduced a bill, the Fiscal Analysis by Income and Race (FAIR) Scoring Act, that would require CBO to include a distributional analysis in its legislative cost estimates.
But to achieve that level of eventual uptake, there are a number of things the Office of Information and Regulatory Affairs should consider doing now to clarify how agencies should conduct weighted distributional analysis. The first is providing more precision around how to calculate income, how to define an economic unit (household vs. individual), and which income bands to use, since all of these methodological questions could hinder sound implementation.
The White House should also clarify how executive agencies should distinguish between costs and benefits that affect mortality risk—calculated via the so-called value of a statistical life, or VSL—and all other costs and benefits, such as reduced injuries, higher productivity, and time saved. This will be important for purposes of income weighting because agencies are already instructed to use a uniform average VSL across the population (currently $12 million per person, though it varies slightly by agency), which is a form of income weighting. That is, the lives of low-income Americans are afforded a higher monetary value than they would otherwise and vice versa for high-income Americans. Executive agencies, however, may be confused about how to income weight costs and benefits without “double-weighting” mortality risk reductions.
On distributional analysis more generally, the Office of Information and Regulatory Affairs should consider providing additional guidance on how agencies should determine subgroups of interest. Though different agencies may have good reasons to focus on different socioeconomic or demographic groups, to meet the administration’s ambitious equity goals, some top-down direction and definition will be necessary. Finally, to ensure busy policymakers internalize the importance of distributional effects, agencies should be required to include a round-up of their distributional findings in the executive summary and accounting statement provided at the top of each regulatory impact analysis.
Use cases
There are many possible examples of how these proposed A-4 reform proposals could work in practice. For instance, the upcoming rulemaking on heat illness prevention at the U.S. Department of Labor’s Occupational Safety and Health Administration would be more likely to result in a policy that puts greater weight on the benefits that a national heat standard delivers to U.S. low-income workers, who are disproportionately Black, Latino, and Native American workers.
Or take the Administration for Children and Families within the U.S. Department of Health and Human Services, which is considering reforms to the Temporary Assistance for Needy Families program in order to ensure its funds flow to underserved communities, many of whom today receive little to nothing from the income support program. Recognizing that cash assistance for low-income Americans might deliver higher social welfare than other approved uses of TANF funds—for example, workforce training or marriage counseling—could help the Administration for Children and Families design these modifications most efficiently.
Similarly, the U.S. Department of Agriculture is currentlyrevising regulations that protect livestock producers and chicken growers from anticompetitive conduct and market abuses. Understanding which consumers, producers, and workers stand to benefit from such a revision, through a rigorous distributional analysis, would help USDA set its enforcement policy at the optimal level.
Yet distributional analyses may not always support a pro-regulation agenda. New York University law professor Daniel Hemel, for example, analyzed a rule from 2014 by the U.S. Department of Transportation’s National Highway Traffic Safety Administration requiring all new vehicles to include back-up cameras. He finds that what was considered a public-safety enhancing reform was likely regressive because the cost to lower-income consumers of slightly more expensive cars did not deliver high enough safety benefits to justify the expense, at least according to one possible weighting approach.18
And economists Akshaya Jha and Nicholas Z. Muller at Carnegie Mellon University and Peter Matthews at Middlebury College find that the U.S. Environmental Protection Agency’s particulate matter and ozone rules increased income inequality, in part because the benefits accrue disproportionately to cities, which tend to be higher income than rural areas.
Next steps
The proposal’s next step is a public comment period. Interested parties can weigh in until June 6, at which point the Office of Information and Regulatory Affairs will respond to any comments as well as the feedback it receives from academic peer reviewers and finalize the guidance. OIRA is encouraging commenters to focus in part on the distributional analysis elements of the proposal, outlining four specific questions it is looking for help analyzing:
How can the U.S. Office of Management and Budget refine the list of groups identified for consideration in distributional analysis?
Are there available data sources that OMB should identify as being potentially useful for agencies that would like to perform a distributional analysis, particularly focusing on underserved populations?
Should OMB provide additional guidance on when, and using what methods, it would be most appropriate for agencies to undertake benefit-cost analysis weighted by income (or other measures of economic status)?
How can OMB refine its preliminary default estimate of elasticity of marginal utility? What additional studies should be considered? What other methods should be considered to derive a default estimate?
Even after the revision is finalized, it will still face a number of possible obstacles, among them:
Research gaps and the role of academics
Court challenges and political durability
These obstacles are briefly detailed below.
Research gaps and the role for academics
Executive agencies will have to overcome the same data limitations referenced above in order to implement this revised A-4. Importantly, though, this draft proposal presents an opportunity for academics to identify and fill research gaps that can be directly plugged into subsequent policy analysis.
Given the many methodological choices facing agencies, there will also be questions about what constitutes a rigorous—but not overly burdensome—distributional analysis. Early regulatory impact statements will set the tone, and agency-specific guides, which academic researchers could help craft, will help institutionalize the new practices.
Court challenges and political durability
An early rule promulgated under the new guidelines could be challenged in court for undue reliance on the new Circular A-4, calling into question the document’s constitutionality. Even if ultimately rejected, such a lawsuit could delay important regulations and politicize the revisions.
But there is no clear reason why the Biden administration proposal would generate academic or political opposition because (as outlined above) the updates are well-grounded in academic evidence and do not advance a markedly pro- or de-regulatory agenda. This is important, given that the durability of this update is contingent on the support of future administrations.
Conclusion
The proposed reforms to the Circular A-4’s approach to distributional analysis are urgently needed to modernize the rulemaking process and ensure that rulemakings adequately account for economic inequality, which evidence shows can constrict economic growth. This update demonstrates that recent data-driven research on the economic benefits of addressing inequality has broken through at the highest levels of the federal government, challenging discredited neoliberal orthodoxy about how the U.S. economy actually works. Even if these new guidelines are only implemented in part, it will be a significant step in the right direction.
Industrial policy is the hot new trend in D.C. policymaking circles, a Biden administration promise to radically transform the economy that is pouring federal dollars into green energy, infrastructure, and semiconductor manufacturing. While this transformation will place considerable demands on federal data infrastructure, the administration has taken up this challenge with its work to improve the level of disaggregation offered by national statistics and to account for environmental wealth in national accounts, to name just two new initiatives.
However, there’s a significant stumbling block before the administration’s plans for industrial policy. That stumbling block is how the U.S. tax code allows federal tax information from the IRS to be shared with statistical agencies. The U.S Census Bureau receives a broad grant of data, subject to approval by the Treasury Department. But our two other major economic statistical agencies—the Bureau of Labor Statistics (BLS), and the Bureau of Economic Analysis (BEA)—are not so lucky. BLS is shut out entirely, and BEA receives only corporate tax returns. This greatly hinders the production of federal economic statistics, but a proposal known as data synchronization would give both agencies grants of IRS data that would solve the most critical data problems.
The inability of BLS and BEA to use tax data has degraded U.S. national economic statistics in a number of ways. But perhaps most critically, it results in BLS and the Census Bureau maintaining two conflicting registers of U.S. businesses. These dueling registers disagree not only about how many business establishments there are in the U.S. economy, but also on trends within those sectors.
Take semiconductor manufacturing, the target of last year’s CHIPS and Science Act – one of the core pieces of the Administration’s new industrial strategy. The Census Bureau says there are about 3,700 U.S. businesses in “semiconductor and other electronic component manufacturing.” Data from BLS, however, indicate there are 6,000 U.S. businesses in that category nationwide. Meanwhile, the Census Bureau finds that there are fewer such businesses now compared to 2012, while BLS says there has been an increase of about 5 percent over that same time period.
BEA faces a different, but equally frustrating problem. The tax code grants BEA corporate returns that they use to calculate some of the nation’s most critical statistics, like Gross Domestic Product. Changes in the tax code, however, have increasingly pushed businesses to incorporate as pass-throughs, which means their income shows up on personal income tax returns that BEA does not have access to. Consequently, BEA is now looking at business income through a pinhole. More than half of that income is concealed from them and must be estimated.
These are just two of the many problems that could be fixed by data synchronization. Moreover, BLS and BEA have mandates to investigate the U.S. economy and provide actionable intelligence to policymakers, businesses, and the public. Federal tax data is a crucial resource for learning about the economy, and both agencies can better serve the public if they have access to this critical administrative data resource. At a time when the federal government is making historic investments into key sectors of the economy, it is critical that policymakers have accurate, timely data about the impact of these investments.
Data synchronization has been a goal of the statistical agencies and public data advocates for decades because it will vastly improve the quality of information available to policymakers and the public about the effectiveness of government programs. The Biden administration has recognized the importance of data synchronization by endorsing the proposal in each of their editions of the Treasury “Green Book” of revenue proposals. This is a great first step, but only Congress can make data synchronization real by amending the relevant section of the tax code.
Ultimately, federal agencies tasked with economic analysis cannot accurately assess the success of policies without consistent, high-quality data. The administration, together with the U.S. House Ways and Means Committee and the U.S. Senate Finance Committee, must prioritize action on data synchronization. Without this important federal data infrastructure fix, policymakers’ ability to evaluate the historic industrial policy investments will be fundamentally undermined.
Earlier this month, associate professor of public policy and economics Gabriel Zucman at the University of California, Berkeley—and a Washington Center for Equitable Growth 2018 grantee—won the 2023 John Bates Clark Medal. The prestigious award is given annually by the American Economic Association to an American economist under the age of 40 who is judged to have made the most significant contribution to economic thought and knowledge. In particular, Zucman was recognized for his contributions to the field of public economics, being one of the world’s leading experts on tax evasion, and for his research on measuring and explaining the rise in economic inequality.
Zucman’s exceptional research on tax evasion—including as an Equitable Growth grantee—and on the unequal distribution of income and wealth in the United States have been indispensable in furthering our nation’s understanding of economic inequality and growth and what to do about it. As part of his contributions to public economics, he has helped organize Economics for Inclusive Prosperity, which is a network of academic economists seeking to broaden the scope of economic research, including research related to economic inequality.
Having been an active member of our network since its founding, we wish to celebrate Zucman’s momentous achievement by highlighting some of his scholarship with Equitable Growth throughout the years and how his evidence-based microeconomic research resulted in key public policy decisions over the past several years.
Tax Evasion
Zucman’s research as an Equitable Growth grantee generated the working paper “Tax Evasion at the Top of the Income Distribution: Theory and Evidence,” which investigated two main questions: What kind of tax evasion tactics do high-income Americans use? And how much taxes do high-income Americans evade?
Using a unique combination of micro-data from the IRS, Zucman and his co-authors find that random audits tend to miss certain kinds of concealed assets. Offshore tax evasion, for example, is one prominent tactic used by high-income Americans, with about 1 in 15 people in the top 0.01 percent of the U.S. income distribution appearing on lists of taxpayers disclosing offshore accounts following an ambitious crackdown in starting in 2008. This is heavily contrasted with those in the bottom 99 percent of the income distribution, with less than 1 in 1,000 of those individuals appearing on the same lists.
Then there are so-called pass-through businesses (partnerships and S-corporations under the U.S. tax code), which do not remit their own income taxes, but rather “passes through” this income to their owners for tax purposes. Pass-through business income is highly concentrated at the top of the income distribution. Partnerships in particular can be highly complex because the owners of partnerships can be other pass-through businesses. Zucman and his co-authors find when an auditor encounters pass-through income during an individual random audit, they only proceed to audit the pass-through businesses themselves in less than 5 percent of cases.
Accounting for these kinds of sophisticated tax evasion approximately doubles the tax gap for the top 0.1 percent of the U.S. income distribution, compared to conventional estimates. Additionally, accounting for underreported income increases estimates of the share of all income received by the top 1 percent by about 1.5 percentage points.
The consequences of tax evasion are significant. Zucman and his co-authors conservatively estimate that increased enforcement to close the income tax gap for the top 1 percent could yield $175 billion in currently uncollected income tax revenue per year. Zucman’s groundbreaking research was cited by the U.S. Department of the Treasury in support of President’s Biden recent investment of $80 billion in the IRS to close this compliance gap and by 21 members of the U.S. Senate in support of that investment, which became law in 2022.
Economic Inequality
Zucman has pioneered research measuring and explaining the trend of rising inequality. In a 2016 Equitable Growth working paper, along with co-authors Thomas Piketty, professor of Economics at the Paris School of Economics, and Emmanuel Saez, professor of Economics, University of California, Berkeley, Zucman developed distributional national accounts that disaggregate national income. These accounts allowed the authors to compute growth rates for each quantile of the income distribution consistent with macroeconomic growth, and enabled them to estimate the distribution of both pre-tax and post-tax income in order to provide a comprehensive view of how government redistribution affects inequality.
Details of their findings in the United States also can be read here. Their methodological innovations have contributed significantly to the proliferation of research and policy interest on the effects of economic inequality and how to measure it. His work in this arena is often cited in the seminalefforts by the U.S. Department of Commerce’s Bureau of Economic Analysis to measure economic inequality—research that contributed to the BEA’s decision to create a new prototype data series on the distribution of growth in personal income, providing valuable intelligence on who is benefiting from economic growth in the United States. In December 2022, the agency released data on the distribution of economic growth for 2020 and 2021.
Zucman continues to advance public scholarship in this arena by maintaining the distributional national accounts micro-data on his website. These micro-files make it possible for researchers, journalists, policymakers, and any interested user to compute a wide array of distributional statistics—income, wealth, taxes paid and transfers received by age, gender, marital status, and other measures—and to simulate policy discussions about the distributional consequences of tax and transfer reforms in the United States.
The Washington Center for Equitable Growth congratulates Gabriel Zucman for winning the Clark Medal, and looks forward to his research for years to come documenting why broad-based economic growth results in stronger and more stable growth.
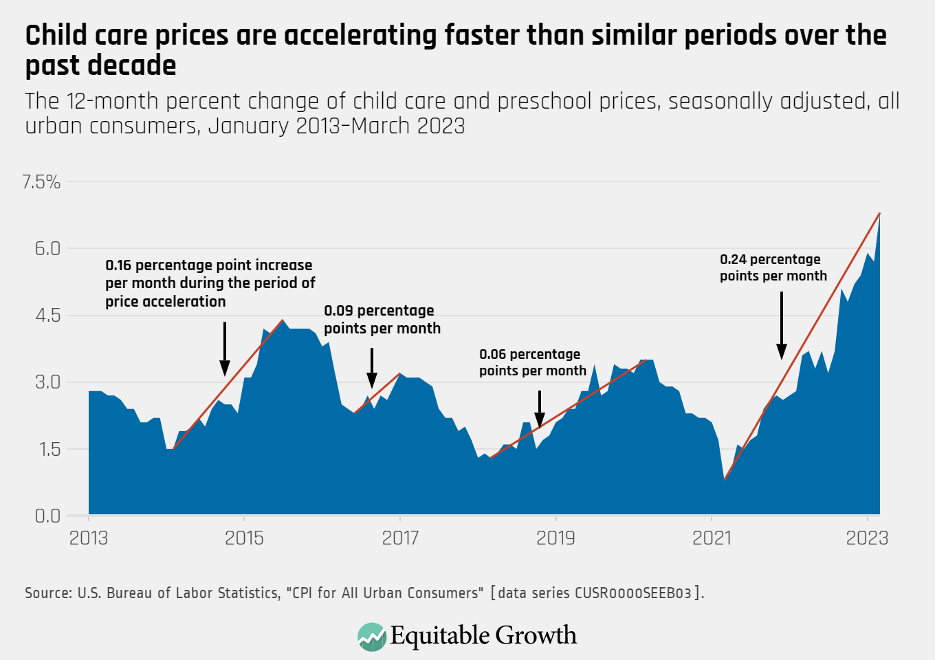
For much of the COVID-19 recession of 2020 and subsequent economic recovery, the child care sector was spared the accelerating inflation that impacted other areas of the U.S. economy. As prices for gas, timber, used automobiles, and other commodities rose, the cost of early care and education remained relatively steady, potentially due to softer demand and separation from the supply-chain struggles that plagued other sectors.
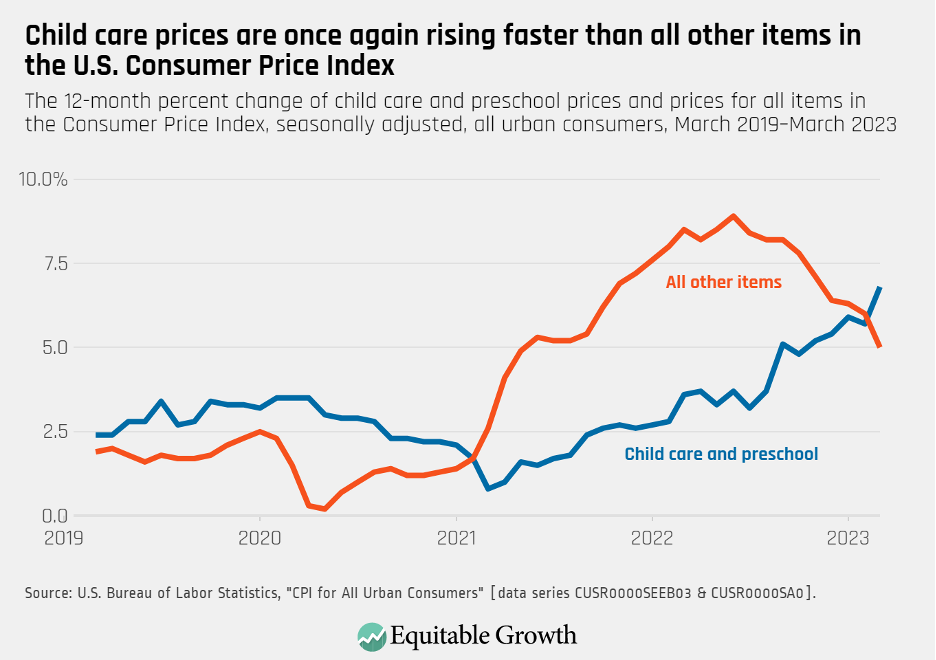
Today, the opposite is happening. As energy prices stabilize and supply chains un-kink, the cost of early care and education registered an annual increase of 6.8 percent in March 2023, the fastest in more than 30 years, while broader inflation cooled slightly to 5 percent year-over-year. (See Figures 1 and 2.)
Figure 1
Figure 2
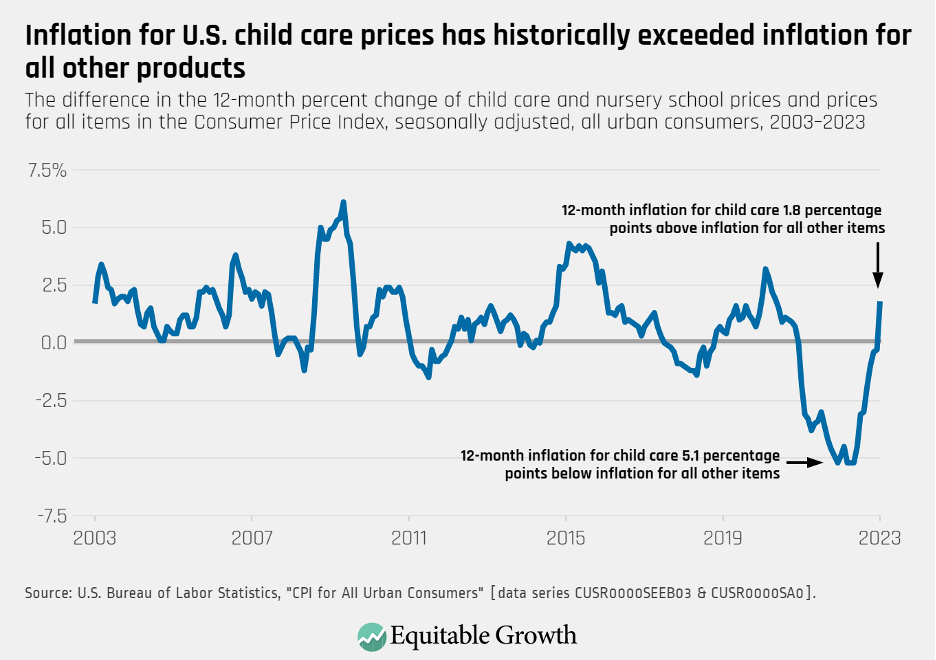
This is, in many ways, a return to the pre-pandemic status quo. Last year, Equitable Growth warned “that child care prices … are rising at a slower rate than the general Consumer Price Index should provide little comfort to policymakers and is not indicative of where child care prices are likely to go.” With the release of last month’s data, child care prices now have risen faster than broader inflation for 174 out of the past 240 months. (See Figure 3.)
Figure 3
Limited supply and child care’s labor-intensive business formula means that parents are always paying high prices even as workers and staff make relatively little. As high as child care prices are, they are in effect subsidized by low wages and low profits across the sector. Recent data suggests this dynamic is changing, with rising wages pushing prices higher just as pandemic-era aid to the child care sector is set to end.
High wages are a positive, long-overdue development in the child care market. But absent robust and sustained public investment supporting these wages, the financial interest of families and workers are pitted against one another, with one group’s access to care dependent on the indigency of the other.
For decades child care workers have been undercompensated for the economic value they generate, earning some of the lowest wages in the U.S. labor market. Amid the COVID-19 pandemic, the low-wage, high-stress nature of the job contributed to persistent staffing shortages across the country.
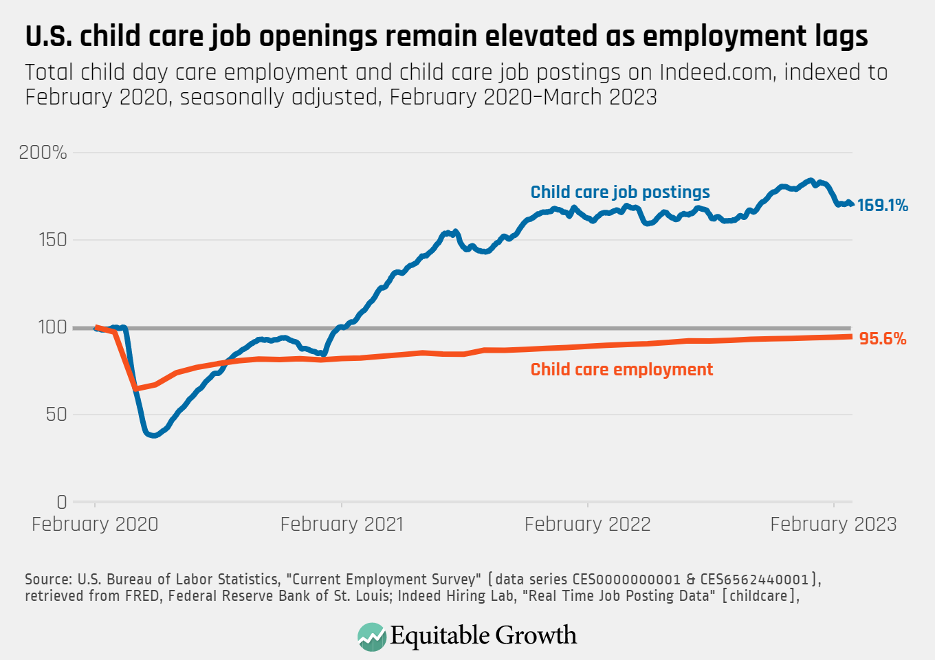
Child care employment remains below pre-pandemic levels despite a full recovery in the broader U.S. labor market. Postings for child care jobs on Indeed.com, for example, are 169 percent of their pre-pandemic rate while actual child care employment is still down 4.4 percentage points (See Figure 4.)
Figure 4
This tightness in the child care labor market should be a recipe for rising wages as providers work to retain and recruit staff. This inevitably translates into higher prices for families. According to an analysis by the Center for American Progress, salaries and benefits account for 65 percent to 76 percent of providers’ costs. Without cash reserves, investments, or profits to cushion rising wage costs, child care providers must pass them on to the families they serve.
Also at play are billions of dollars in pandemic-era emergency relief intended to rescue the child care sector from the pandemic-related crisis. With the Consolidated Appropriates Act, 2021 and, more significantly, the American Rescue Plan, Congress allocated nearly $50 billion in emergency aid to the child care sector, which was on the brink of collapse.
Much of this funding was flexible, and states used it to bolster subsidies, attract new providers to the market, and increase compensation for child care workers, among other purposes. Early research suggests the funding may have kept tens of thousands of providers from shutting their doors, saving nearly 3 million child care slots.
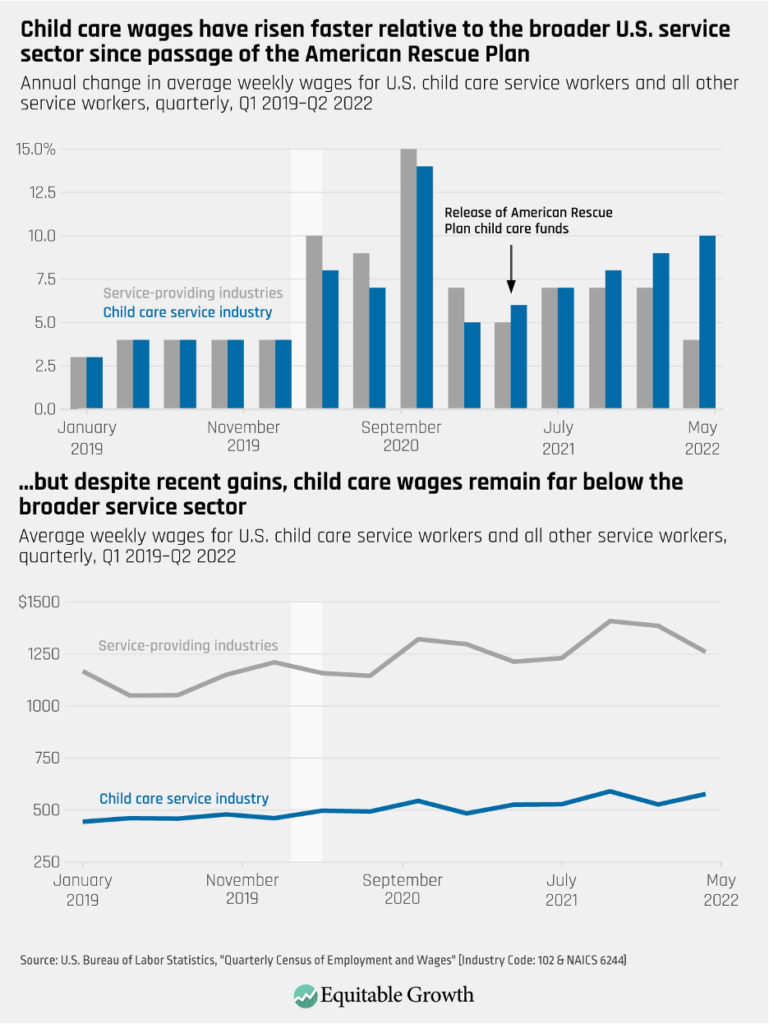
A big question stemming from the American Rescue Plan was whether this temporary infusion of funds could translate to sustained higher salaries for child care staff. According to data in the Quarterly Census of Employment and Wages available through the second quarter of 2022, child care wage growth has been accelerating since the implementation of the American Rescue Plan, even while growth in the broader service sector shows signs of stabilizing or even decelerating. More research is needed to determine how the American Rescue Plan specifically, relative to other labor market trends, has contributed to this increase. (See Figure 5.)
Figure 5
Of course, average child care wages remain far below those in the broader service sector despite this recent growth. This current dynamic may leave the child care market in an uncomfortable posture, particularly as expiring pandemic-era aid leaves families more exposed to these higher costs.
Increased wages for child care workers, even as they translate into higher prices for families, are essential for stabilizing—and, ideally, expanding—the supply of child care. But if rising wages remain below comparable sectors, then child care wages still may not be high enough to attract talent back and sufficiently expand supply, leaving providers and families with higher costs and limited public support for sustaining those costs.
Conclusion
Temporary public investment helped stabilize the child care industry, promoted more equitable wage compensation, and limited families’ child care costs through higher subsidies or direct payments to child care providers. Presently, wages appear to be rising, but perhaps not high enough to rapidly expand supply, and expiring pandemic-era child care aid means that families could lose out on those direct and indirect subsidies that helped keep care affordable.
I wrote in May 2022 that child care was facing three potential futures. In one future, child care wages stay low, supply is constrained, and families are saddled with higher costs in the form of increased prices, higher search-costs, and opportunity costs from forgone work for those unable to find care. In the second future, child care wages rise, stabilizing supply but directly raising child care prices. Only in the third future, one built on public investment, could wages rise, supply expand, and families remain sheltered from these costs.
Today, rising wages across the child care sector are a necessary and positive development. Higher compensation will attract new talent to the sector and stabilize the workforce, improving quality of care. But someone must pay for it, and families may be at their limit. Without ongoing public investment to bridge the gap between families’ budgets and the true cost of providing accessible and high-quality care, current growth in child care wages may prove transitory. Child care may emerge from the COVID-19 pandemic intact, but the opportunity to transform the child care market into a thriving, functioning sector will have passed us by.
On May 5, the U.S. Bureau of Labor Statistics released new data on the U.S. labor market during the month of April. Below are five graphs compiled by Equitable Growth staff highlighting important trends in the data.
The employment rate for prime-age workers increased to 80.8 percent in April from 80.7 percent in March, with total nonfarm employment rising by 253,000.
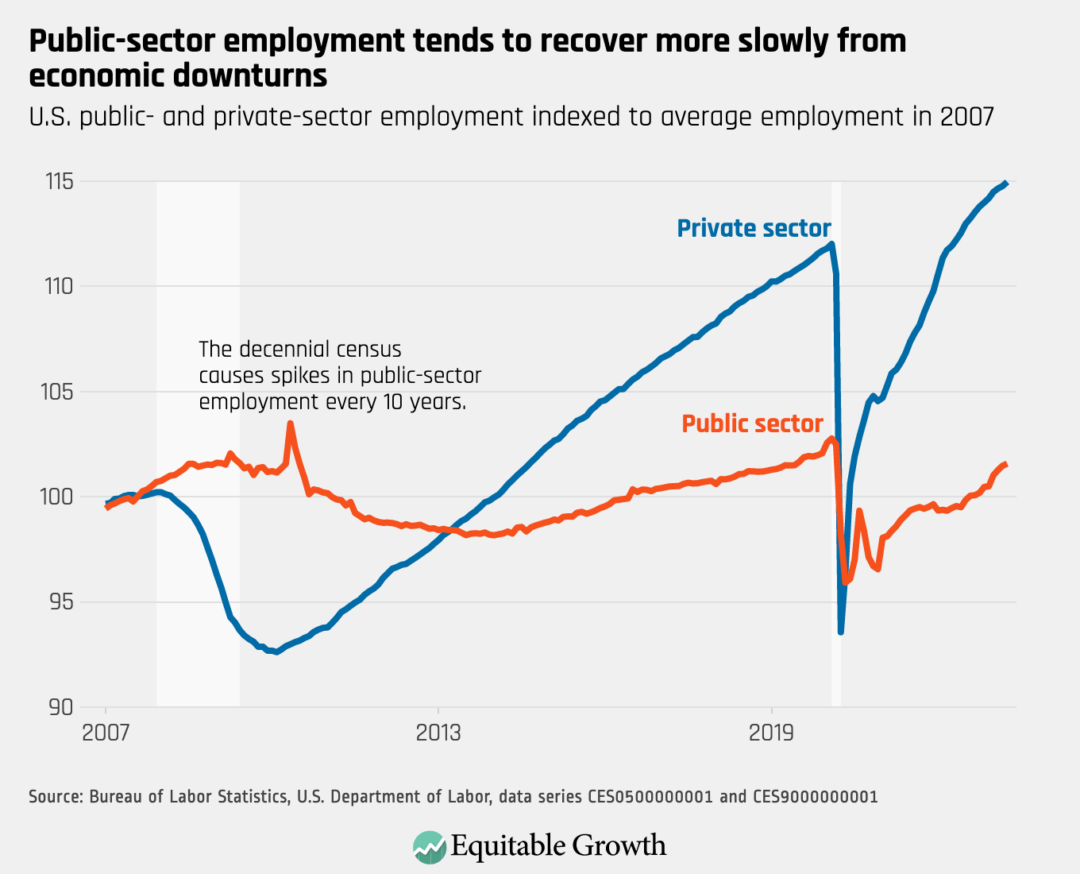
Both public-sector and private-sector employment rose in April, though public-sector employment has recovered more slowly.
The unemployment rate decreased slightly to 3.4 percent in April, with declines for Black workers (4.7 percent) and Latino workers (4.4 percent). The unemployment rate was 3.1 percent for White workers and 2.8 percent for Asian American workers.
Nominal wage growth (not accounting for inflation) did not change dramatically in April, with average hourly earnings growth at 4.4 percent over the past 12 months.
The employment rate among adults age 16 and older decreased in April to 65.7 percent for men, and increased to 55.4 percent for women.