Proposed update to federal cost-benefit analysis guidelines correctly focuses on accounting for inequality in regulations

Overview
The White House last month unveiled a proposed update to an obscure but highly influential government document called the Circular A-4, which governs how the federal government conducts regulatory cost-benefit analysis. The announcement of the proposal and the accompanying executive order, both of which were foreshadowed by an earlier presidential memorandum on “modernizing regulatory review,” was not front-page news, yet if the proposed revisions to the A-4 are adopted they will have major consequences for regulatory policy across the federal government.
More specifically, the proposed reforms to the Circular A-4 would nudge federal agencies to account for inequality across an array of categories—from income and wealth to geography, race, and age—when analyzing regulations. While this kind of distributional analysis was allowed under the previous iteration of the Circular A-4, the Biden administration’s proposal would provide agencies with clearer guidance on how to conduct the analysis and how to embed and weight distributional effects in their decision-making.
This issue brief covers the following topics:
- The history of the Circular A-4 and why agencies aren’t already conducting distributional analysis
- How distributional analysis can help policymakers make sounder and more equitable decisions about economic policy
- A summary of the Biden Administration’s proposed guidance on distributional analysis, which is evidence-backed and reflects the current state of economic research
- Potential improvements, use cases, and next steps for the proposal
The Biden administration’s proposed new approach, if successfully implemented, would be the first time that distributional analysis is systematically incorporated into regulatory reviews, helping policymakers better understand the impact of their decisions on inequality and the economy writ large.
The history of the Circular A-4 and why agencies aren’t already conducting distributional analysis
The Circular A-4 is the official guidance to federal agencies from the White House Office of Information and Regulatory Affairs within the U.S. Office of Management and Budget on how to conduct regulatory impact analysis, which is used to justify most major regulatory decisions.1 The Circular A-4 was last revised two decades ago and is significantly out of date given the wealth of evidence-based research and analysis since then on key economic topics such as inequality, market power, and behavioral biases.
The U.S. Congress, of course, writes the nation’s laws, but the legislative branch delegates immense rulemaking powers—including some of the thorniest policy design and implementation decisions—to expert agencies in the executive branch. These agencies, operating under the auspices of the president, promulgate rules that have the power of law, making these executive actions one of the most important channels through which economic policy gets made, especially during periods of divided government.
A key part of many regulatory impact analyses is a cost-benefit analysis, which must show that the benefits of regulating in the way an executive branch agency proposes outweigh the costs of doing so—or that the costs are justified for other reasons. The objective is to take the regulatory approach that maximizes net benefits.2 This analysis is done by agencies estimating, monetizing, and summing all the costs and benefits impacting the populations affected by the draft proposal. The agencies then compare that against a baseline of costs and benefits that are projected based on the assumption that the proposed policy will not be enacted, and calculate the resulting total net benefits.
The White House Office of Information and Regulatory Affairs then reviews the agency’s work and circulates it for feedback among other government agencies. If OIRA officials find the analysis and policy satisfactory, then they allow the agency charged with implementing the rules to move forward with the rulemaking.3
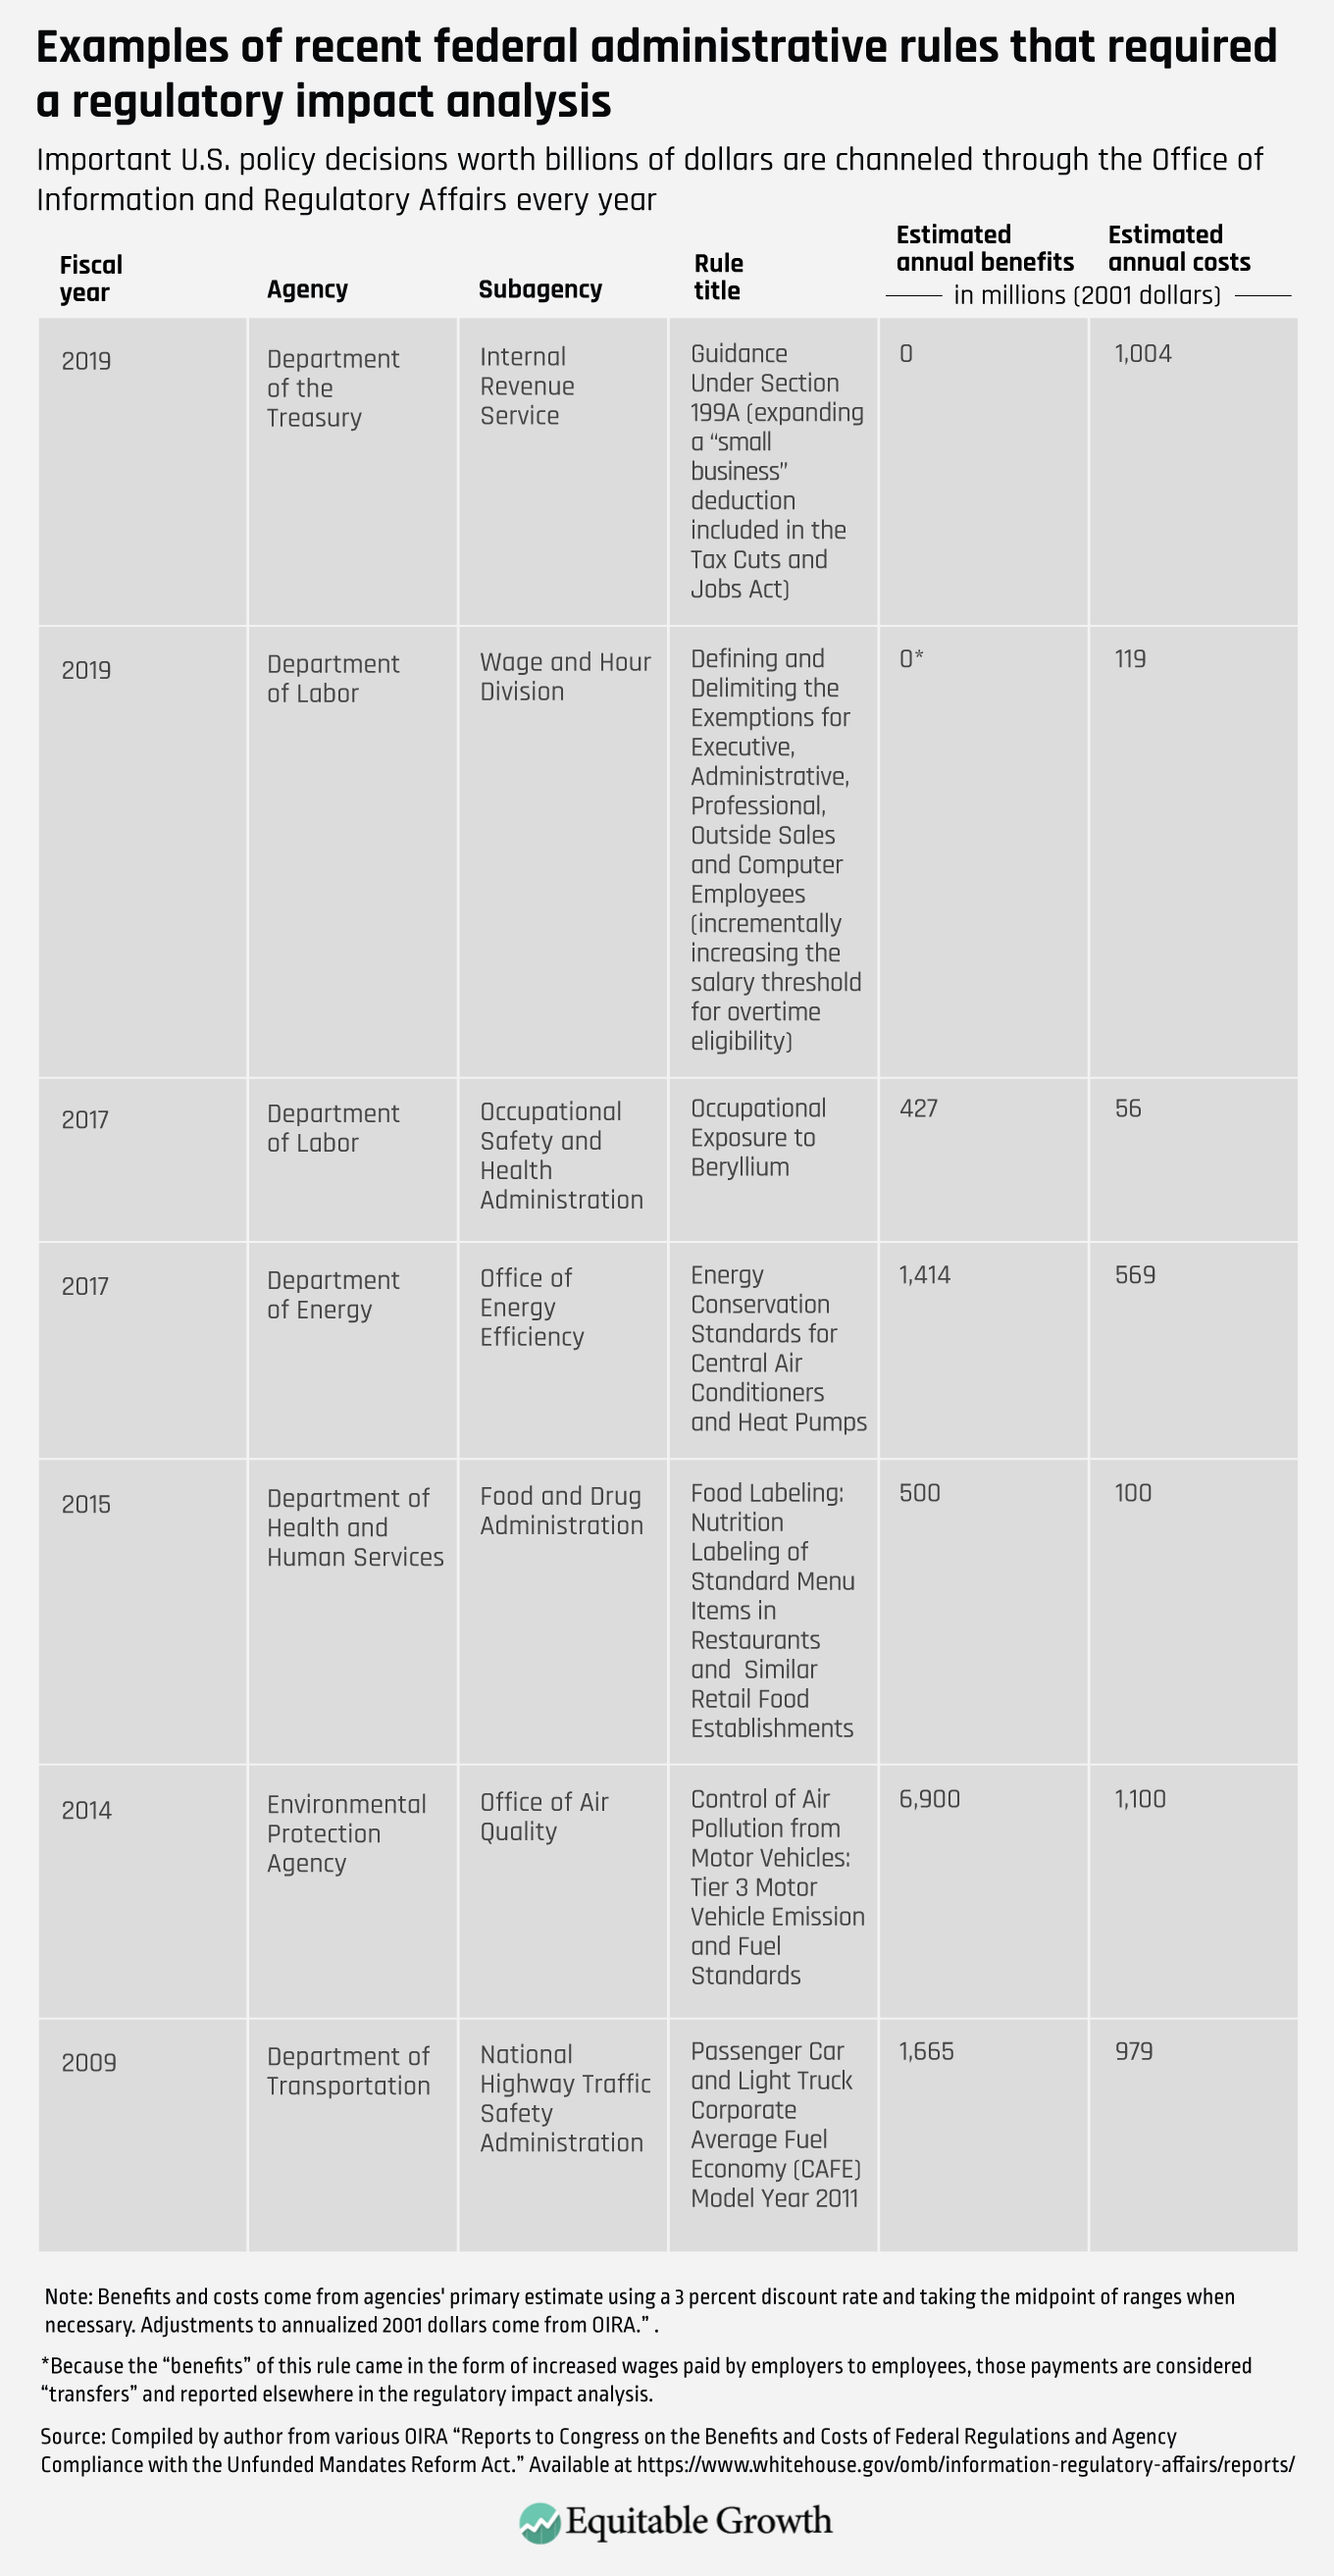
This process sounds highly technical and bureaucratic—and it is. But it is also of vital importance. The choices that agencies make on how to conduct cost-benefit analyses in advance of rulemaking determine exactly how a rule will be designed and implemented, which in turn sets federal policy on everything from mitigating climate change and protecting worker safety, to the pricing of life-saving medicine and designing income support programs such as Unemployment Insurance and the Supplemental Nutrition Assistance Program. (See Table 1 for examples of recent rules that have gone through OIRA review.)
Table 1
The Biden administration’s proposed revision to the A-4—and to a sister document, the Circular A-94, that guides agencies’ cost-benefit analysis of federal spending programs—are far–ranging, affecting important methodological questions around issues such as:
- Discount rates, or how to treat costs and benefits that appear in the future
- Quantification, or how to treat costs and benefits that are especially hard to quantify or monetize
- Uncertainty, or how to treat costs and benefits that are inherently speculative or that affect populations who are not perfectly risk-neutral
- Global impacts, or how to treat costs and benefits that affect foreigners and American citizens living abroad4
This brief, though, focuses solely on distributional analysis, the most concrete way that cost-benefit analyses incorporate equity into regulatory decision-making.
The A-4’s current approach to distributional analysis
Past presidential administrations have paid lip service to distributional analysis being a key input to regulatory policy decision-making. In 1993, then President Bill Clinton issued what is now the key executive order governing the regulatory review process (#12,866).5 This executive order for the first time included “distributive impacts” and “equity” as examples of what constitute “net benefits.”
President Barack Obama reaffirmed that approach in his Executive Order (#13,563) on “improving regulation and regulatory review” in 2011, but he did not revise Circular A-4, which was issued in 2003 by President George W. Bush. The Trump administration, for its part, kept the existing regulatory review process intact, though it was often caught conducting cost-benefit analysis shoddily and in bad faith. President Trump also instituted a “one in, two out” rule that focused on minimizing regulatory costs rather than maximizing net benefits. President Biden rescinded this rule on his first day in office.
The 2003 A-4, which is what the Biden administration is now trying to revise, directs agencies to “provide a separate description of … how both the benefits and costs are distributed among sub-populations of particular concern … so that decision-makers can properly consider them along with the effects on economic efficiency.” But this analytical mandate is rarely followed by federal agencies in any meaningful way, according to research by legal scholar (and now OIRA administrator) Richard L. Revesz, and his co-author Samantha Yi at New York University School of Law. This has been true even during the first two years of the Biden administration,6 and has been corroborated by others.
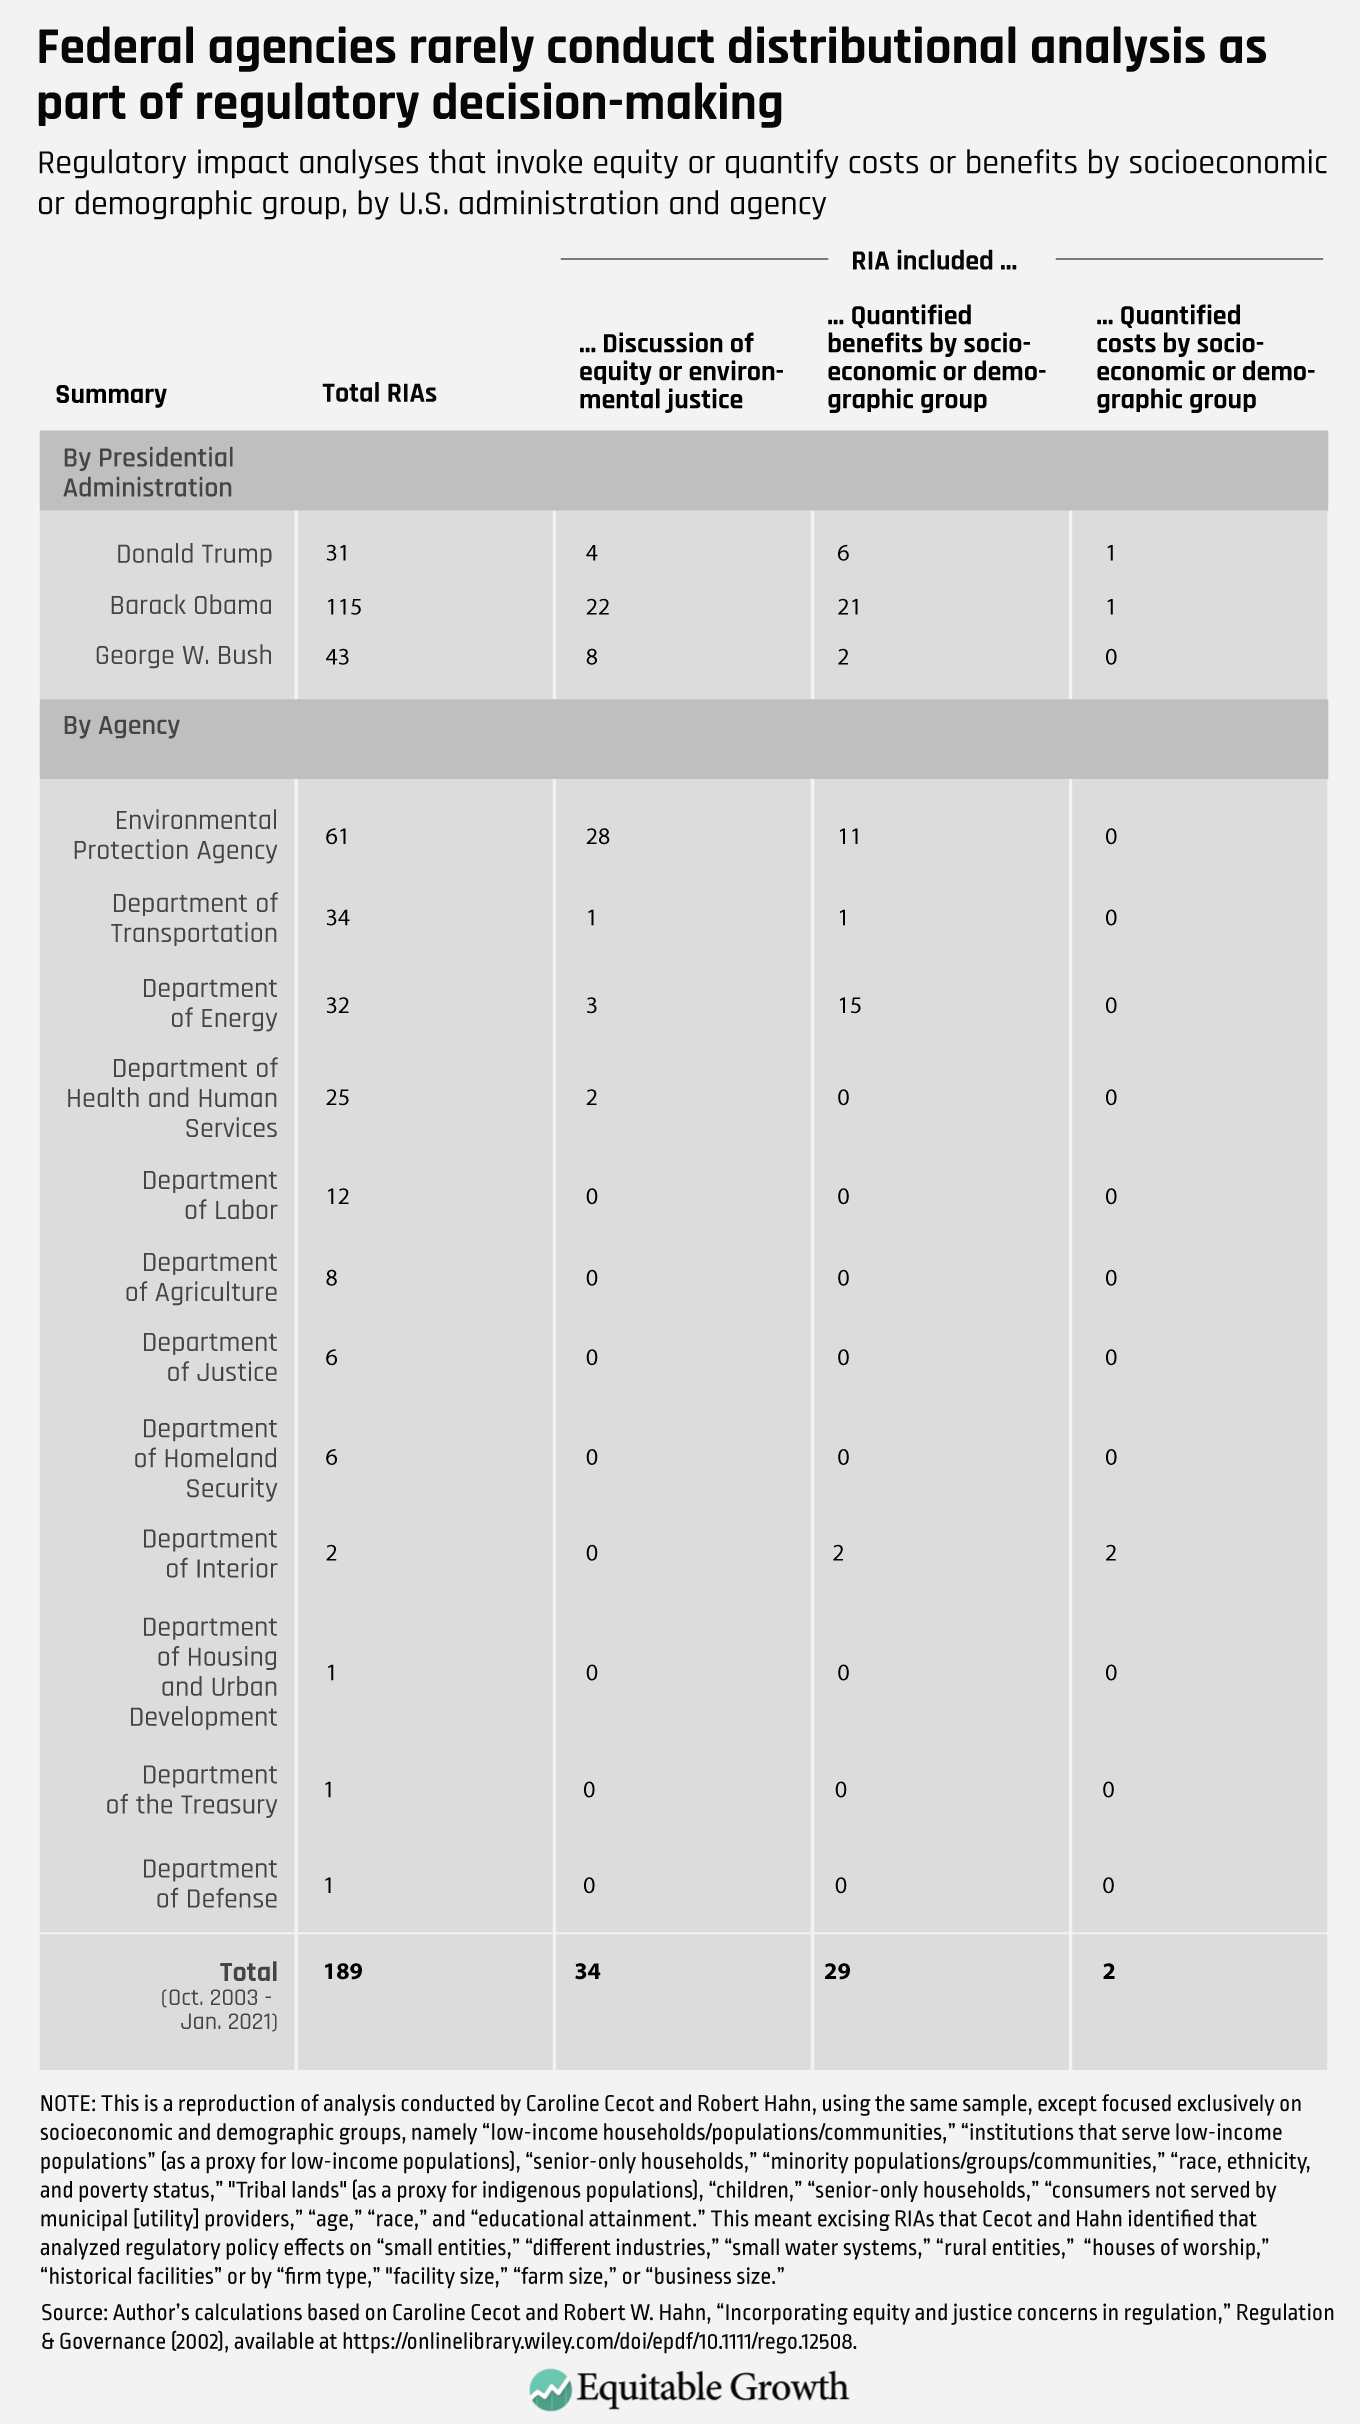
Caroline Cecot at George Mason University’s Antonin Scalia School of Law and Robert W. Hahn at the University of Oxford, for example, analyzed 189 regulatory impact analyses published between October 2003 and January 2021, finding only two that quantified net benefits for a specific socioeconomic or demographic group, and only 18 percent that referenced equity in any way, with most of those references being made by the U.S. Environmental Protection Agency. (See Table 2.)
Table 2
Obstacles to change
There are a number of reasons—some good and some bad—for why agencies today mostly overlook the distributional consequences of their actions. Among them are concerns about:
- Analytical irrelevance
- Judicial review
- Data limitations
- Undue delay
- Political transparency
- Unclear guidance
Let’s examine each briefly below.
Analytical irrelevance
Some who conduct cost-benefit analyses at executive branch agencies justify ignoring distributional concerns by claiming that their job is to maximize total pre-tax dollars produced in the economy, then leave it to the nation’s progressive tax system to more efficiently redistribute as much as society desires.
But that is increasingly an unrealistic assumption, because the U.S. tax system has grown less progressive in recent decades, a result of misguided and outdated views on the benefits of tax cuts and the outsized political influence of the rich. As Zachary Liscow at Yale Law School notes (before he took his current role as Associate Director for Economic Policy at the Office of Management and Budget), the distributional effects of legal rules in our current political economy are “sticky,” meaning Congress is unlikely to revise the tax code or make other policy changes in response to a regressive regulation. Therefore, it makes sense to include distributional analysis in modern regulatory cost-benefit analysis to ensure rulemakings don’t needlessly perpetuate different forms of economic inequality.
Judicial review
Federal regulations are consistently challenged in court, and judges—particularly powerful ones on the U.S. Supreme Court—have used recent precedent-setting cases to push the law to be less deferential to agency rulemaking authority. Nationwide (or “absent-party”) injunctions against agency actions, once a rarity, have become commonplace. Additionally, Congress has provided inconsistent guidance on regulatory impact analysis. This allows the judiciary to fill in gaps, and in some cases, to require agencies to conduct more pre-promulgation analysis than what’s called for in the main statute governing federal rulemaking—the Administrative Procedure Act—which itself doesn’t explicitly require cost-benefit analysis.
In such a hostile judicial environment, agencies are reticent to change practices, especially in ways that could be seen as giving special treatment to certain citizens. This concern, however, should not outweigh good historical and policy reasons for federal agencies to ensure public investments in social infrastructure and accompanying income support programs reach historically underserved communities.7
Data limitations
Doing cost-benefit analysis well is hard enough when analysts are simply estimating average, society-wide effects. Making the analysis more granular by looking at population sub-groups adds an additional element of difficulty, especially in policy areas that lack good data on the incidence of costs and benefits.
Academics have spilled much ink on perennial policy questions such as who bears the cost of the corporate tax. But more novel questions of cost incidence, such as who pays for prescription drug development, or how improvements in the local environment might increase rents, suffer from a lack of well-calibrated models. In some cases, the only analysis comes from the regulated industry itself using proprietary data, an obviously biased source.
Undue delay
Even in the rare cases where solid distributional data are available, conducting a rigorous distributional analysis takes time, which agencies often don’t have. The evidence is mixed on just how “ossified” the regulatory process is, but there is no denying that rulemaking takes longer and there are more potential pitfalls than in the past.
In 2012, for example, the non-partisan Government Accountability Office found that the U.S. Occupational Safety and Health Administration takes, on average, more than seven years to promulgate a new worker safety standard, a result in part of excessive procedural requirements. So requiring agencies to do more analyses before presenting their findings for OIRA review could dissuade them from regulating at all or further slow an already torturous process with many choke points.
Political transparency
It is not entirely true to say that executive agencies and the White House do not consider distributional concerns at all. Indeed, political appointees are notoriously attuned to who will win or lose from a regulatory decision, and there is evidence that they intervene at times behind the scenes to push for a particular constituency. And constituency groups themselves are of course not shy about weighing in with agencies and OIRA if they believe their interests are at stake.
By not including distributional analysis in the regulatory impact analysis—or by merely including a perfunctory qualitative statement—political decision-makers are shielded from the public accountability that would come from a systematized and transparent approach. This may be, at least in part, by design, helping to explain why agencies have been slow to adopt previous nudges from OIRA and why OIRA has not insisted on agencies changing their practices.
Unclear guidance
Finally, the lack of specific guidance from the Office of Information and Regulatory Affairs on how to conduct distributional analysis is a serious problem. According to NYU’s Revesz and Li, the current A-4 “deals with distributional issues in a perfunctory and unhelpful manner,” leaving key questions unanswered, among them:
- Which sub-populations should be highlighted and how should they be defined?
- How should transfer payments from one group to another (say, workers to employers), which are traditionally ignored in a formal cost-benefit analysis, be treated?
- Should the analysis be quantitatively embedded in the cost-benefit analysis itself or qualitatively considered as a supplement to it?
- For rules that deal with mortality risk, how should distributional considerations be considered in light of the already somewhat income-weighted “value of a statistical life” calculation used across government?
- What trade-offs (real or imagined) should agencies be prepared to make? Is the goal to minimize harm to or reduce the burden on disadvantaged communities, or is to reduce inequality across the population?
These are thorny questions that need clear answers from the Office of Information and Regulatory Affairs.
How distributional analysis can help policymakers make sounder and more equitable decisions about economic policy
By not conducting a distributional analysis, agencies are allowing two flaws of traditional cost-benefit analysis to fester, and are thus providing incomplete information to policymakers tasked with making critical regulatory decisions. To counteract this, agencies must, where possible:
- Disaggregate cost-benefit analyses to capture how differences by income, wealth, race, ethnicity, region, and other socioeconomic and demographic factors are affected.
- Reweight cost-benefit analysis so as to not underestimate or overlook possible adverse impacts on low-income and less wealthy Americans.
Let’s briefly consider each of these issues in turn.
The need for disaggregating cost-benefit analysis
As we know from other key economic indicators, an analysis that focuses just on society-wide aggregates or averages will inevitably conceal variation across the population. Simply stated, the costs and benefits of regulations (and other policies) rarely accrue equally up and down the income and wealth ladders, across regions, or among different demographic groups.
Relaxing a financial regulation, for example, might increase the incomes of banks and their executives while pushing middle-class investors into financial products with higher fees. But if the benefits to Wall Street firms and their senior executives outweigh the costs to Main Street, then the regulation would pass a cost-benefit analysis test, and under current rules, little consideration would need to be paid to which groups were reaping more of the benefits or accruing more of the costs.
This isn’t purely theoretical. In 2017, the Trump administration proposed multiple delays to the so-called “fiduciary rule,” which would have required certain financial advisers to serve in the best interest of their clients in more instances, reducing conflicts of interest in the financial advice market. To effectuate the delays, the Trump administration’s U.S. Department of Labor conducted a regulatory impact analysis that argued that the costs of delay to investors were justified by the benefits in reduced compliance burdens. This analysis was suspect on its face, but it would have been particularly scandalous if the Trump administration had disaggregated the costs and benefits by income or wealth since that probably would have revealed the extreme regressivity of the proposal.8
Given that both income and wealth inequality have risen in recent decades and evidence demonstrates inequality constricts growth, there are clear reasons to disaggregate by those socioeconomic markers. But there are similarly compelling reasons to disaggregate data by geography or by region, particularly as place-based economic policies grow in popularity; by race and ethnicity given the enduring legacy of institutional racism in our nation’s history and its continuing impact today; and by generational cohort or age given the overwhelming evidence that public investments in children yield long-term benefits.9
The need for reweighting cost-benefit analysis
The lack of distributional analysis also is problematic because the conventional approach to cost-benefit analysis is already weighted against low-income and low-wealth Americans. The currently prescribed way that agencies calculate costs and benefits employs so-called “willingness-to-pay” and “revealed preference” models that use sophisticated methods to quantify how much value individuals place on avoiding certain costs or acquiring certain benefits.
These two models often quantify how much extra consumers are willing to pay for additional safety features in cars, for example, or how much higher salaries workers demand for slightly riskier jobs. The underlying assumptions of these models privilege those who are able to place higher dollar figures on costs and benefits simply because they have more money overall to spend.
Importantly, this is true even if those higher dollar figures don’t equate to higher utility or well-being for the recipients. The economic term for this is diminishing marginal utility, but you don’t need formal economic training to know, intuitively, that $100 for Bill Gates is less valuable to him than is $100 for a low-income person. Yet current cost-benefit analyses treat both amounts at face value.10
Because of the structural racism baked into our history and economy, Black, Latino, and Native American people are overrepresented among the low-income, and so are especially hurt by this practice, which can be particularly harmful when the policy questions at issue have major distributional consequences.
A concrete example comes from the U.S. Department of Transportation. It currently puts greater weight on the time savings that accrue to richer Americans than poorer ones when determining which transit infrastructure projects to pursue, which will ultimately lead to the building of more airports and fewer bus lines, all else being equal.
This approach, as Yale Law School’s Liscow explains, makes sense purely as a matter of efficiency because airport travelers tend to have higher earnings potential—a measure of how much they value their time—so reducing their transit delays technically creates more value in the economy. But he points out that measuring efficiency in this way assumes the creation of an extra $200 of value in the U.S. economy is always superior to creating $199 of value—even if the $200 accrues to an already-rich person who gains no utility from the money and the $199 accrues to a lower-income person who will use the money to greatly improve their standard of living.11
This is why, as I’ve written elsewhere, that producing a cost-benefit analysis without information on who will win and lose from the rulemaking proposal is doomed to reproduce existing inequities.
A summary of the Biden Administration’s proposed guidance on distributional analysis, which is evidence-backed and reflects the current state of economic research
The Biden administration immediately recognized the promise of more robust distributional analysis. On day one of his term, President Biden issued a memorandum calling for the revision of Circular A-4 and new “procedures that take into account the distributional consequences of regulations, including as part of any quantitative or qualitative analysis of the costs and benefits of regulations, to ensure that regulatory initiatives appropriately benefit and do not inappropriately burden disadvantaged, vulnerable, or marginalized communities.”12
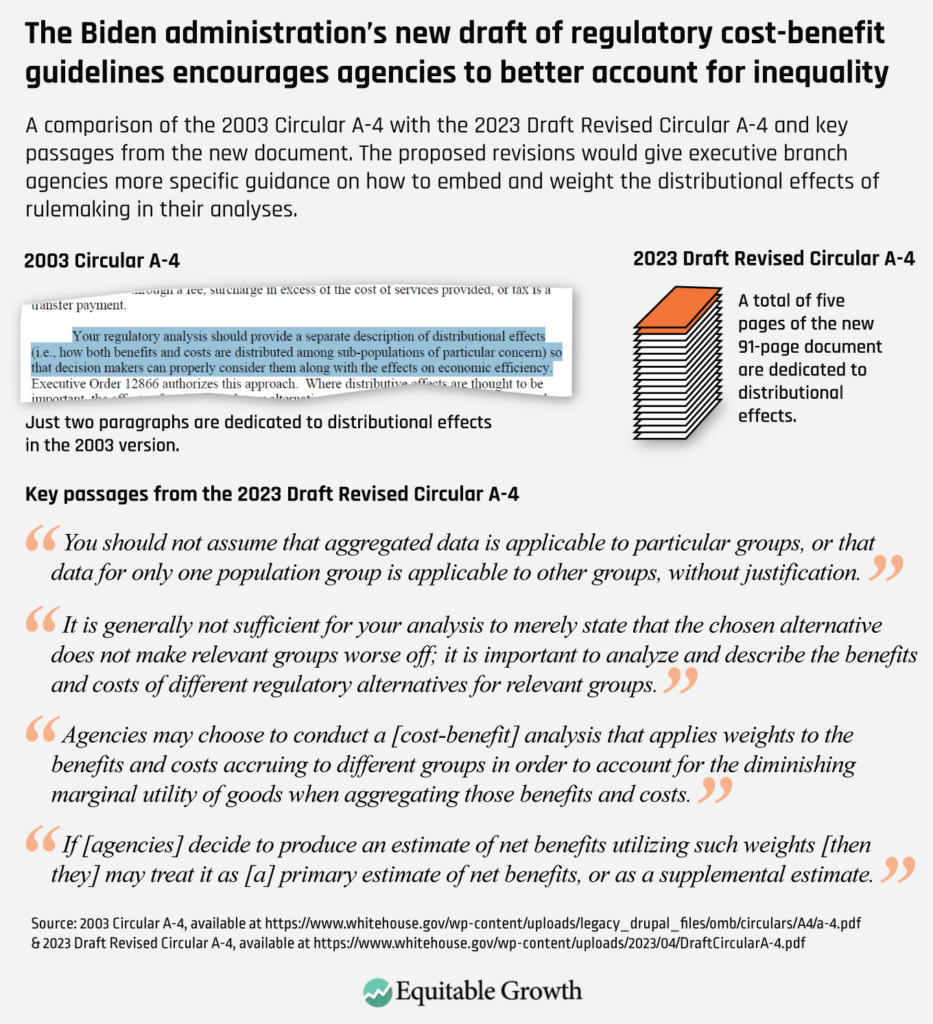
Last month, the White House released its proposal, which attempts to go further than previous administrations when it comes to centering equity and distribution in regulatory impact analyses. Indeed, the 2003 A-4 spent two paragraphs on “distributional effects,” whereas the 2023 draft revision spends roughly five pages on the topic, and the preamble to the revision spends another five pages. (See Figure 1.)
Figure 1
There are five key elements in the new proposal related to distribution, which are mirrored almost identically in the A-94 proposal.13 They are:
- Equity as a rationale for taking regulatory action
- Optional distributional weighting incorporated into analysis
- Relevant sub-groups determined by executive branch agencies
- Optional inclusion of transfers incorporated into analysis
- Other specifics described in guides to be written by executive branch agencies
A brief analysis of each of these key elements in the new draft A-4 proposal follows.
Equity as rationale for taking regulatory action
Every regulatory impact analysis conducted by a federal agency must include a statement from that agency on the need for regulatory action. Historically, based on OIRA guidance, these statements have focused on correcting market failures, a reflection of the neoliberal ideology that reigned in 2003 when the current A-4 was written.
The proposed revision would better capture the progress scholars have made in understanding how the U.S. economy actually works—namely, that economic inequality, climate change, institutional racism, behavioral biases, monopsony, and other forms of market power pose serious short-term and long-term threats to broad U.S. economic prosperity and growth. In the draft revised A-4 proposal, for example, “promoting distributional fairness and advancing equity,” is now broken out as a separate “common need for regulation” that agencies can invoke when justifying their regulation.
Optional distributional weighting incorporated into analysis
The proposed OIRA draft guidance opens the door to a major change in how cost-benefit analyses by executive branch agencies incorporate distributional information by encouraging them to consider weighting the costs and benefits to account for the aforementioned diminishing marginal utility of income. The White House regulatory agency even provides a number, 1.4, that it says is a “reasonable estimate of the income elasticity of marginal utility.”
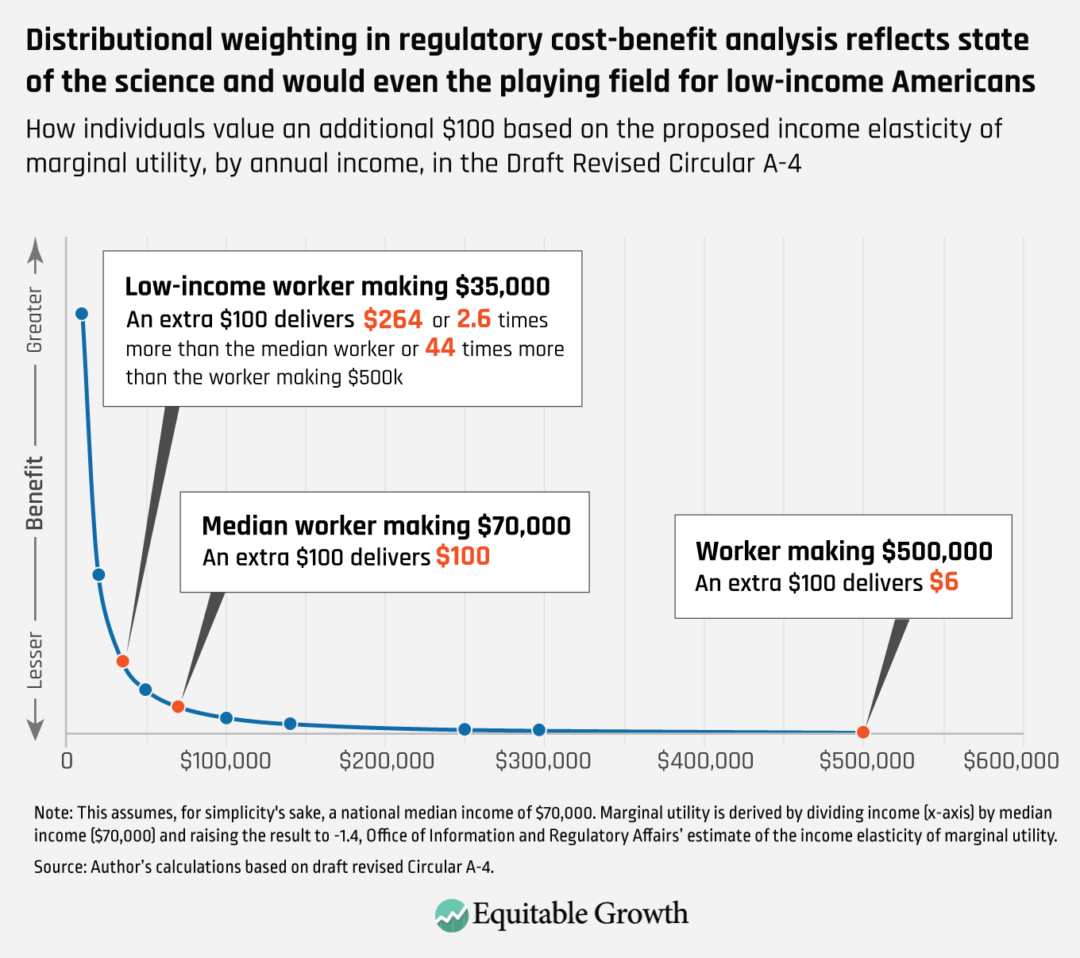
This number connotes that someone making a median income—roughly $70,000 in the United States today—would value an additional dollar 2.6 times greater than someone making double the median income ($140,000) and 4.7 times greater than someone making triple the median income ($210,000). Said another way, $100 to the person making $210,000 produces the same utility, or well-being, as when a median worker making $70,000 receives $21.48.14 (See Figure 2.)
Figure 2
Given the individual subjectivity involved in translating income into utility or welfare, there is no way to know for sure that 1.4 is the “correct” weight, but the Office of Information and Regulatory Affairs based its estimate on academic evidence that reverse engineers from trade-offs that individuals are observed making in the real world, such as between insurance and risk at various premium costs. Deriving the number is complicated, but much of the scientific literature finds a value of between 1.2 and 1.8, putting the OIRA’s estimate well within the range.
The new proposal says that executive branch agencies can use this weight, either within their primary cost-benefit analyses or as supplemental analyses, to discount costs and benefits that accrue to high-income Americans and amplify the costs and benefits that accrue to low-income Americans. A number of scholars describe how these weights—as part of what’s sometimes called a utilitarian or “prioritarian” social welfare function15—could be implemented, and the United Kingdom prescribes such an approach in its own guidance document for cost-benefit analyses.16 But this new proposal would be a major sea change for how cost-benefit analysis is conducted in the United States.
Put simply, it would level the playing field between low- and high-income Americans by essentially transforming everyone’s willingness-to-pay into that of a median-income American for purposes of cost-benefit analysis. So when a low-income American is willing to spend $100 to, say, live closer to public transit, that would count, under a weighted cost-benefit analysis, as a willingness-to-pay of $264, or the amount that a median-income American would pay to get the same benefit.
Given the work involved in doing a thorough distributional analysis, and the fact that some rules will not have many distributional effects, the Office of Information and Regulatory Affairs leaves it to agencies to determine which rules are “most likely to have differentiated effects on particular demographic groups and to analyze important distributional effects in those cases.”
Relevant sub-groups determined by executive branch agencies
The Office of Information and Regulatory Affairs’ proposed draft lists a number of types of economic and demographic categories that could be considered as part of a distributional analysis. They include race and ethnicity, sex, gender, geography, wealth, disability, sexual orientation, religion, national origin, age or birth cohort, family composition, or veteran status. This is consistent with President Biden’s presidential memorandum on modernizing regulatory review, which, as mentioned above, directed the U.S. Office of Management and Budget to update its practices so as to “appropriately benefit and … not inappropriately burden disadvantaged, vulnerable, or marginalized communities,” though those descriptors were not defined.17
The proposed draft guidance provides few details about which subpopulations to build analyses around. Instead, the OIRA proposal defers to agencies to decide which groups are most relevant for their set of regulatory policies.
Optional inclusion of transfers incorporated into analysis
In economic parlance, “transfers” are payments from one party to another, such as government to households, consumers to producers, or employers to workers. Economic theory holds that these payments are made without anything provided in return, often as a result of a government directive or market power. Since economists think of transfers as not affecting total social welfare (not changing the size of the pie), they have historically been reported separately in agencies’ regulatory impact analyses.
Under the new draft OIRA guidance, executive branch agencies are given the option, for the first time, to include transfers directly in their cost-benefit analyses as both a benefit to the transferee and a cost to the transferer. Though transfers, by definition, cancel out when calculating a net benefit, they can be very relevant in a distributional analysis. The so-called “overtime rule” from the U.S. Department of Labor is a good example. As referenced in Table 1 above, increasing the number of workers eligible for overtime is, in economic terms, a forced economic transfer from employers to employees. As such, those higher wages are not counted as benefits—resulting in an incomplete picture of the rule’s impact.
Similarly, in 2019, the Trump administration proposed a restriction to eligibility for the Supplemental Nutrition Assistance Program in which the billions in benefits cuts appeared only as a “transfer” from beneficiaries to the federal government in the regulatory impact analysis. The new OIRA draft guidance specifically mentions distributional analysis as a reason agencies might want to include transfers in future cost-benefit calculations.
Other specifics described in guides to be written by executive branch agencies
Distributional analyses can take many forms depending on the policy area at issue. The new draft OIRA guidelines recommend that executive branch agencies create their own guidelines for incorporating distributional analysis into the cost-benefit analyses they submit to the Office of Information and Regulatory Affairs.
So, for example, the U.S. Department of Transportation might craft a distributional analysis guide centered on how best to quantify transportation insecurity across the population. In contrast, the U.S. Environmental Protection Agency might focus its guide on helping its regulatory analysts accurately capture the geographic distribution of air pollution-related deaths and illnesses, which can then be overlaid on socioeconomic and demographic information—including measures of intergenerational mobility.
Agencies already have guidance documents along these lines, but they would likely need to be updated once the new A-4 is finalized.
Potential improvements, use cases, and next steps for the proposal
If finalized, these proposed reforms would constitute a major shift in approach to distributional analysis in the regulatory review process. The weighting in particular, while optional, would likely provide the specific guidance that executive branch agencies need to start experimenting with more fulsome incorporation of distributional analyses into their cost-benefit analyses.
The proposed reforms also would allow for future administrations to build on this foundation to require distributional analysis for certain types of rules. If the technique takes hold at the regulatory level, one could imagine other statisticians, such as those estimating national personal income at the U.S. Department of Commerce’s Bureau of Economic Analysis, or legislative analysts, such as those scoring bills at the Congressional Budget Office, taking a similar approach. Representative Ro Khanna (D-CA) and Senator Elizabeth Warren (D-MA), for example, have introduced a bill, the Fiscal Analysis by Income and Race (FAIR) Scoring Act, that would require CBO to include a distributional analysis in its legislative cost estimates.
But to achieve that level of eventual uptake, there are a number of things the Office of Information and Regulatory Affairs should consider doing now to clarify how agencies should conduct weighted distributional analysis. The first is providing more precision around how to calculate income, how to define an economic unit (household vs. individual), and which income bands to use, since all of these methodological questions could hinder sound implementation.
The White House should also clarify how executive agencies should distinguish between costs and benefits that affect mortality risk—calculated via the so-called value of a statistical life, or VSL—and all other costs and benefits, such as reduced injuries, higher productivity, and time saved. This will be important for purposes of income weighting because agencies are already instructed to use a uniform average VSL across the population (currently $12 million per person, though it varies slightly by agency), which is a form of income weighting. That is, the lives of low-income Americans are afforded a higher monetary value than they would otherwise and vice versa for high-income Americans. Executive agencies, however, may be confused about how to income weight costs and benefits without “double-weighting” mortality risk reductions.
On distributional analysis more generally, the Office of Information and Regulatory Affairs should consider providing additional guidance on how agencies should determine subgroups of interest. Though different agencies may have good reasons to focus on different socioeconomic or demographic groups, to meet the administration’s ambitious equity goals, some top-down direction and definition will be necessary. Finally, to ensure busy policymakers internalize the importance of distributional effects, agencies should be required to include a round-up of their distributional findings in the executive summary and accounting statement provided at the top of each regulatory impact analysis.
Use cases
There are many possible examples of how these proposed A-4 reform proposals could work in practice. For instance, the upcoming rulemaking on heat illness prevention at the U.S. Department of Labor’s Occupational Safety and Health Administration would be more likely to result in a policy that puts greater weight on the benefits that a national heat standard delivers to U.S. low-income workers, who are disproportionately Black, Latino, and Native American workers.
Or take the Administration for Children and Families within the U.S. Department of Health and Human Services, which is considering reforms to the Temporary Assistance for Needy Families program in order to ensure its funds flow to underserved communities, many of whom today receive little to nothing from the income support program. Recognizing that cash assistance for low-income Americans might deliver higher social welfare than other approved uses of TANF funds—for example, workforce training or marriage counseling—could help the Administration for Children and Families design these modifications most efficiently.
Similarly, the U.S. Department of Agriculture is currently revising regulations that protect livestock producers and chicken growers from anticompetitive conduct and market abuses. Understanding which consumers, producers, and workers stand to benefit from such a revision, through a rigorous distributional analysis, would help USDA set its enforcement policy at the optimal level.
Yet distributional analyses may not always support a pro-regulation agenda. New York University law professor Daniel Hemel, for example, analyzed a rule from 2014 by the U.S. Department of Transportation’s National Highway Traffic Safety Administration requiring all new vehicles to include back-up cameras. He finds that what was considered a public-safety enhancing reform was likely regressive because the cost to lower-income consumers of slightly more expensive cars did not deliver high enough safety benefits to justify the expense, at least according to one possible weighting approach.18
And economists Akshaya Jha and Nicholas Z. Muller at Carnegie Mellon University and Peter Matthews at Middlebury College find that the U.S. Environmental Protection Agency’s particulate matter and ozone rules increased income inequality, in part because the benefits accrue disproportionately to cities, which tend to be higher income than rural areas.
Next steps
The proposal’s next step is a public comment period. Interested parties can weigh in until June 6, at which point the Office of Information and Regulatory Affairs will respond to any comments as well as the feedback it receives from academic peer reviewers and finalize the guidance. OIRA is encouraging commenters to focus in part on the distributional analysis elements of the proposal, outlining four specific questions it is looking for help analyzing:
- How can the U.S. Office of Management and Budget refine the list of groups identified for consideration in distributional analysis?
- Are there available data sources that OMB should identify as being potentially useful for agencies that would like to perform a distributional analysis, particularly focusing on underserved populations?
- Should OMB provide additional guidance on when, and using what methods, it would be most appropriate for agencies to undertake benefit-cost analysis weighted by income (or other measures of economic status)?
- How can OMB refine its preliminary default estimate of elasticity of marginal utility? What additional studies should be considered? What other methods should be considered to derive a default estimate?
Even after the revision is finalized, it will still face a number of possible obstacles, among them:
- Research gaps and the role of academics
- Court challenges and political durability
These obstacles are briefly detailed below.
Research gaps and the role for academics
Executive agencies will have to overcome the same data limitations referenced above in order to implement this revised A-4. Importantly, though, this draft proposal presents an opportunity for academics to identify and fill research gaps that can be directly plugged into subsequent policy analysis.
Given the many methodological choices facing agencies, there will also be questions about what constitutes a rigorous—but not overly burdensome—distributional analysis. Early regulatory impact statements will set the tone, and agency-specific guides, which academic researchers could help craft, will help institutionalize the new practices.
Court challenges and political durability
An early rule promulgated under the new guidelines could be challenged in court for undue reliance on the new Circular A-4, calling into question the document’s constitutionality. Even if ultimately rejected, such a lawsuit could delay important regulations and politicize the revisions.
But there is no clear reason why the Biden administration proposal would generate academic or political opposition because (as outlined above) the updates are well-grounded in academic evidence and do not advance a markedly pro- or de-regulatory agenda. This is important, given that the durability of this update is contingent on the support of future administrations.
Conclusion
The proposed reforms to the Circular A-4’s approach to distributional analysis are urgently needed to modernize the rulemaking process and ensure that rulemakings adequately account for economic inequality, which evidence shows can constrict economic growth. This update demonstrates that recent data-driven research on the economic benefits of addressing inequality has broken through at the highest levels of the federal government, challenging discredited neoliberal orthodoxy about how the U.S. economy actually works. Even if these new guidelines are only implemented in part, it will be a significant step in the right direction.
End Notes
1. Note that the guidance in Circular A-4 does not apply to foreign policy decisions, nor does it apply to independent agencies such as the Federal Trade Commission or Federal Reserve. There is also a jurisdictional debate about whether it should apply to certain tax regulations from the U.S. Treasury Department, since traditional cost-benefit analysis is not well-suited to policies that are centrally focused on raising revenue.
2. Some agencies’ authorizing statutes dictate a regulatory standard distinct from the “maximize net benefits” standard found in the A-4 (the Occupational Safety and Health Administration follows an “economic feasibility” standard). In those cases, agencies still complete a regulatory impact analysis to comply with the spirit of E.O. 12,866, but the statute is the controlling authority and so the cost-benefit analysis may have a limited impact on the ultimate regulatory policy decision.
3. On the same day it proposed revisions to A-4, the White House Office of Information and Regulatory Affairs also proposed ways to make this review process more streamlined and inclusive, including by increasing the threshold for when a regulation must include a full regulatory impact analysis (from $100 million to $200 million in costs or benefits) and by making OIRA’s activities more transparent and subject to scrutiny from historically underserved communities through, for example, more widely available “E.O. 12866 meetings.” Notwithstanding these proposed reforms, some observers, particularly on the progressive side, believe OIRA, regulatory impact analyses, and cost-benefit analyses have too much influence, bias the government against speedy and necessary regulation, and should be eliminated or severely curtailed.
4. Given the obvious connection between these issues and climate change policy, the A-4 is often described in the context of environmental regulation, but its implications are broader.
5. President Clinton’s E.O. superseded a previous one issued by president Ronald Reagan in 1981 (#12,291), which was the first presidential directive to require regulatory impact analyses.
6. One related issue that the Biden administration has prioritized in its first two years is environmental justice, ensuring that at least 40 percent of government benefits go to disadvantaged communities through its Justice40 program. The White House Council on Environmental Quality has produced a screening tool to help agencies ensure investments flow to these communities. This work builds on Clinton’s E.O. 12,898, which directs each federal agency to “make environmental justice part of its mission by identifying and addressing… disproportionately high and adverse human health or environmental effects of its programs, policies, and activities on minority populations and low-income populations.”
7. But agencies will have to tread carefully when it comes to targeting benefits at communities of color given current constitutional jurisprudence on race-based preferences, which holds that any race-conscious policy must be narrowly tailored to redress an individualized harm.
8. There is one kind of economic actor that gets special consideration in almost every regulatory rulemaking process: small businesses. Under the Regulatory Flexibility Act, agencies must consult with the U.S. Small Business Administration’s Office of Advocacy to minimize the adverse economic impact of the rule on “small entities,” which include small businesses, small organizations, and small government jurisdictions. There have been proposals to create other similar offices, for example an Office of Advocacy at the U.S. Department of Labor to protect workers’ interests in rulemakings, but those have not been enacted.
9. Under a still-operative executive order from 1997 (#13,045), children are given special consideration in regulations that affect environmental health risks or safety risks, with agencies required to conduct a separate evaluation of those regulations’ impact on children.
10. In one particularly contentious area, the federal government already has intervened to ensure the willingness-to-pay methodology does not produce a blatant (and politically salient) inequity: the value of a statistical life, or VSL, which is often plugged into the cost-benefit analyses of regulations that affect mortality risk. By requiring agencies to use the same VSL for all Americans (currently $12 million per person, though it varies slightly by agency), the lives of low-income Americans are afforded a higher monetary value than they would otherwise and vice versa for high-income Americans. However, it’s not always clear whom this practice benefits.
11. This approach is short-sighted in other ways as well. Low-income and Black communities already spend an inordinate amount of time waiting for services, which raises basic fairness and human dignity considerations. Transportation insecurity also undermines the ability for low-income workers to improve their lot by commuting to higher wage jobs. This finding is related to the growing evidence that inequality constrains growth, a macroeconomic outcome that is part of a “general equilibrium” economic analysis but is usually considered outside the purview of a traditional “partial equilibrium” cost-benefit analysis. Some of these topics are addressed in the revised draft Circular A-4 but are outside the scope of this issue brief.
12. Also on day one of his administration, President Biden issued E.O. 13,985, which called for a “comprehensive approach to advancing equity for all, including people of color and others who have been historically underserved, marginalized, and adversely affected by persistent poverty and inequality.” Part of that E.O. established an Equitable Data Working Group to better “measure and advance equity,” including by disaggregating more government datasets, a goal complementary to the ones now being pursued by the Biden administration around distributional analysis in regulatory review.
13. The Circular A-94 covers roughly $40-50 billion per year in federal spending through discretionary grant programs, including highway investments from the Department of Transportation and hazard mitigation projects by the Federal Emergency Management Agency. Distributional analysis is of particular value in these contexts because without it, high-income areas will often appear to be the most efficient place to spend public money (infrastructure improvement in a low-income area, because of lower property value and residents’ lower willingness to pay, will appear to have a lower return than the same project in a higher-income area).
14. These calculations follow OIRA’s guidance to divide the individual/group/household’s income by median income and then raise to the -1.4 power. The resulting number is the utility that that individual/group/household receives from an additional dollar of income, so agencies would make a similar calculation across the affected population to properly utility-weight the monetized costs and benefits.
15. While utilitarianism attempts to maximize total utils, wellbeing, or welfare in society (i.e., subjective value), prioritarianism’s first-order objective is to increase utilities among low-income or otherwise vulnerable groups. Our current cost-benefit methodology is doing neither, but rather attempting to maximize total objective value, in dollars, regardless of distribution.
16. Using a constant income elasticity of marginal utility of 1.3.
17. President Biden’s racial equity Executive Order 13,985 (see footnote 12 for further background) lists the following groups as examples of the “underserved and marginalized”: “Black, Latino, and Indigenous and Native American persons, Asian Americans and Pacific Islanders and other persons of color; members of religious minorities; lesbian, gay, bisexual, transgender, and queer (LGBTQ+) persons; persons with disabilities; [and] persons who live in rural areas.”
18. Hemel’s finding is sensitive to the methodology used, particularly the interaction between cost-benefit analysis weighting and the calculated value of a statistical life.