Equitable Growth’s Jobs Day Graphs: April 2023 Report Edition
On May 5, the U.S. Bureau of Labor Statistics released new data on the U.S. labor market during the month of April. Below are five graphs compiled by Equitable Growth staff highlighting important trends in the data.
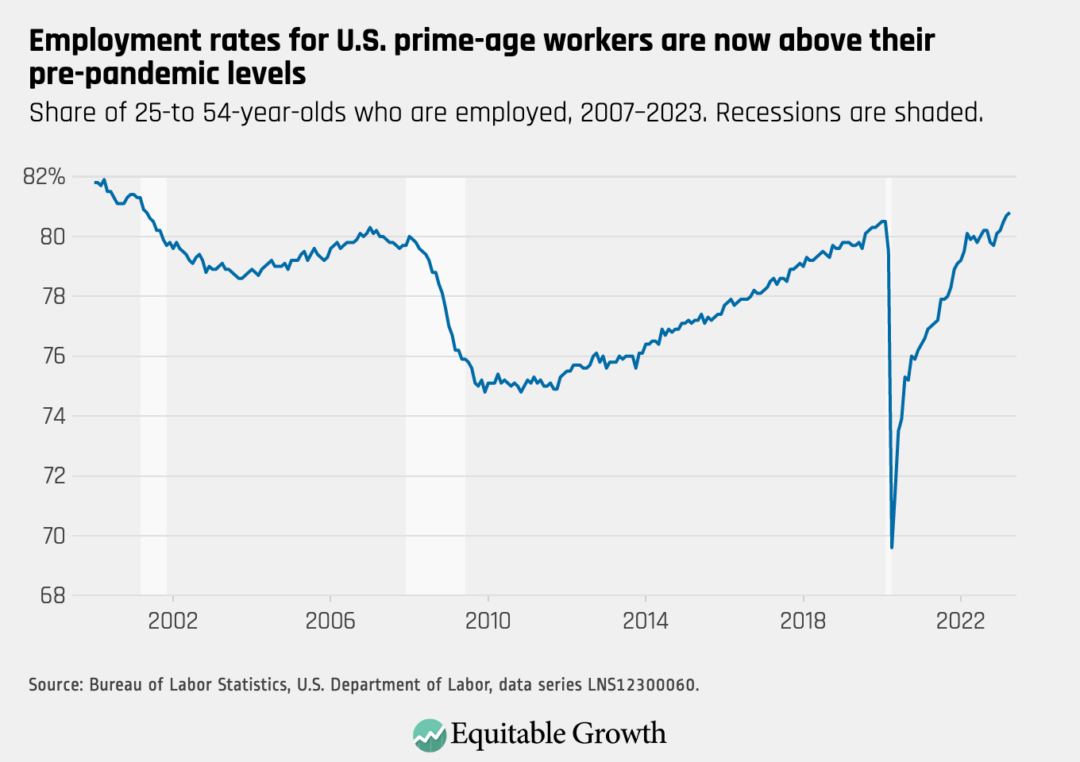
The employment rate for prime-age workers increased to 80.8 percent in April from 80.7 percent in March, with total nonfarm employment rising by 253,000.
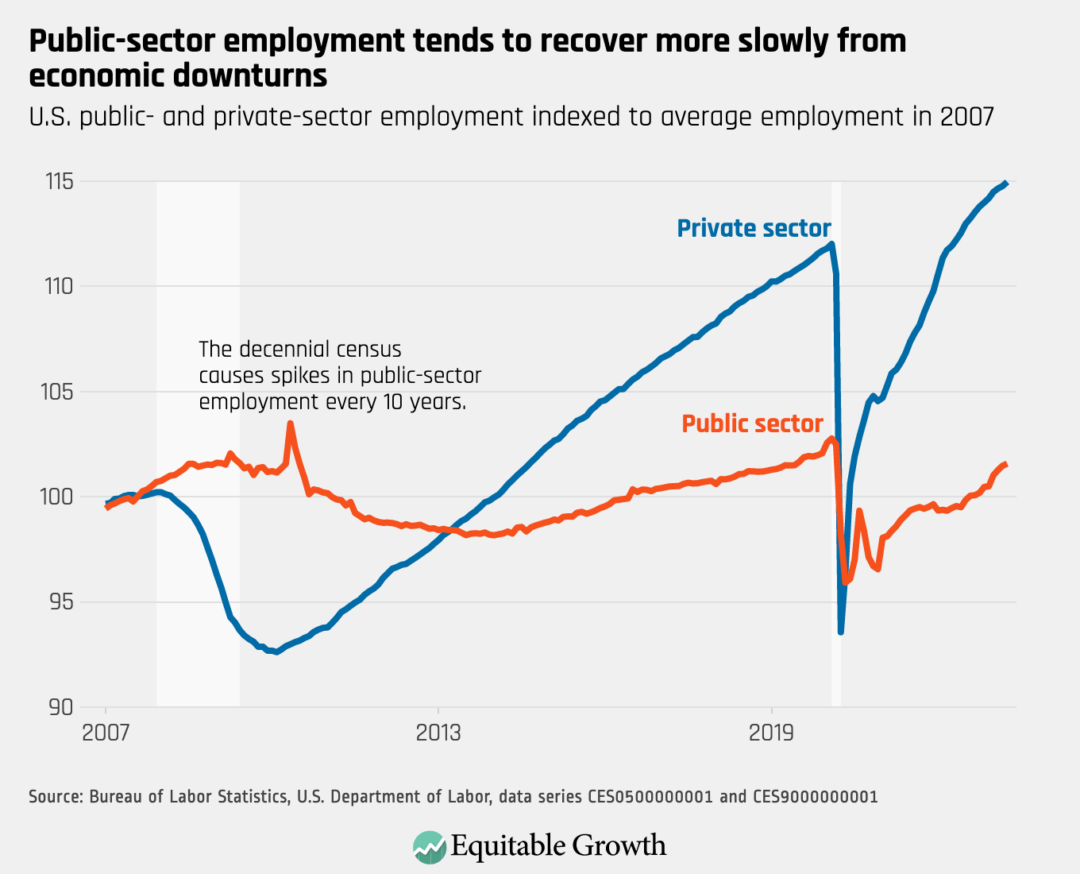
Both public-sector and private-sector employment rose in April, though public-sector employment has recovered more slowly.
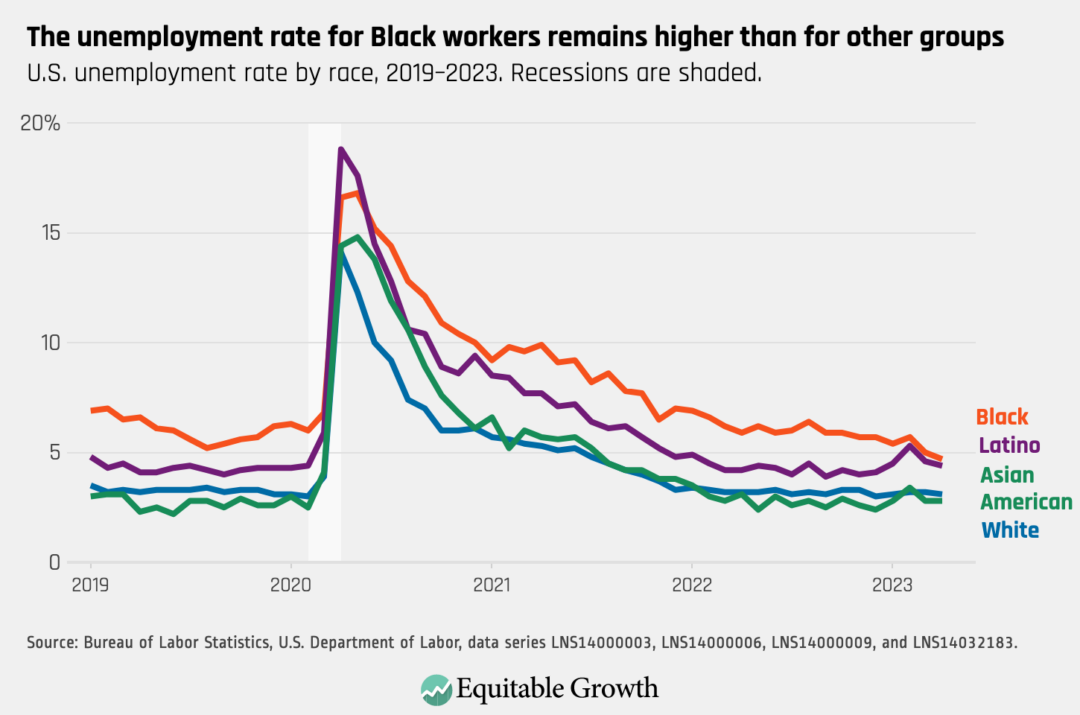
The unemployment rate decreased slightly to 3.4 percent in April, with declines for Black workers (4.7 percent) and Latino workers (4.4 percent). The unemployment rate was 3.1 percent for White workers and 2.8 percent for Asian American workers.
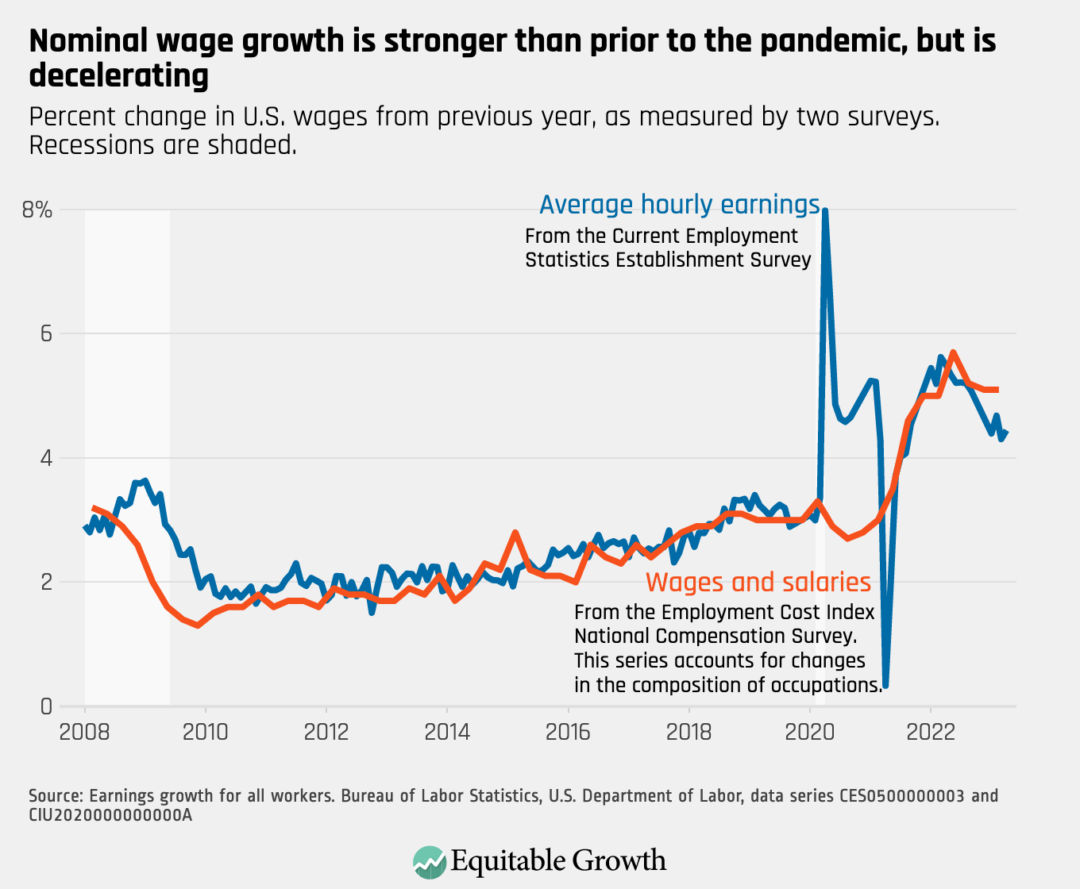
Nominal wage growth (not accounting for inflation) did not change dramatically in April, with average hourly earnings growth at 4.4 percent over the past 12 months.
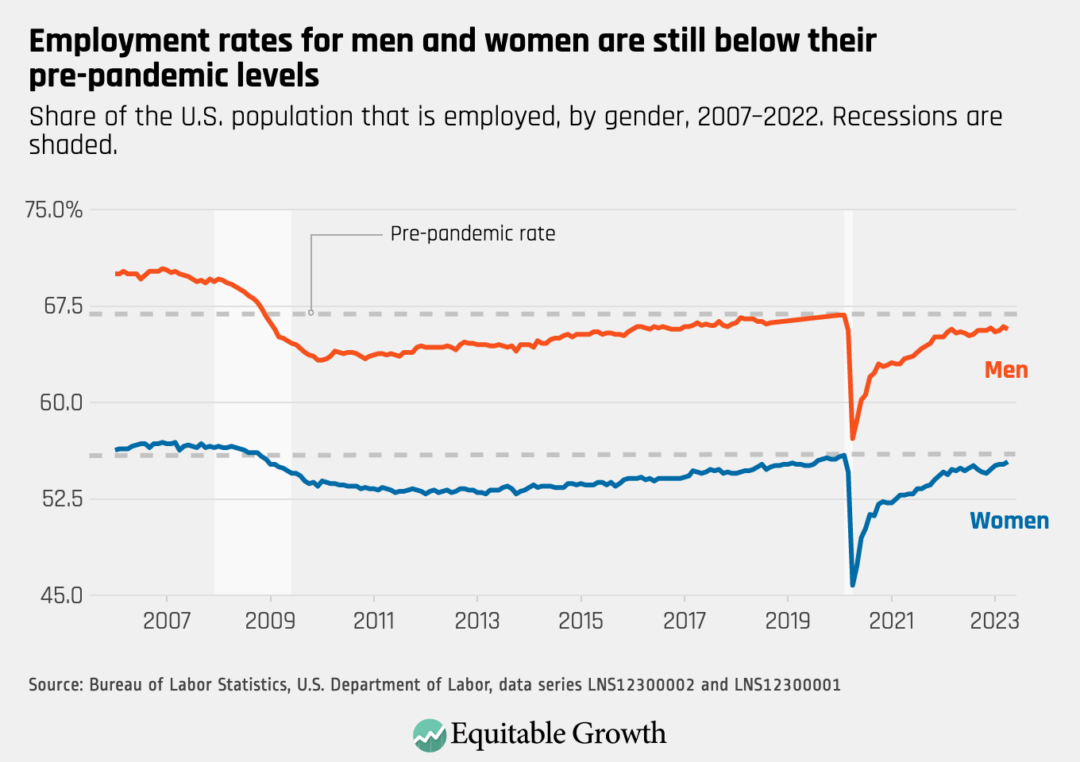
The employment rate among adults age 16 and older decreased in April to 65.7 percent for men, and increased to 55.4 percent for women.