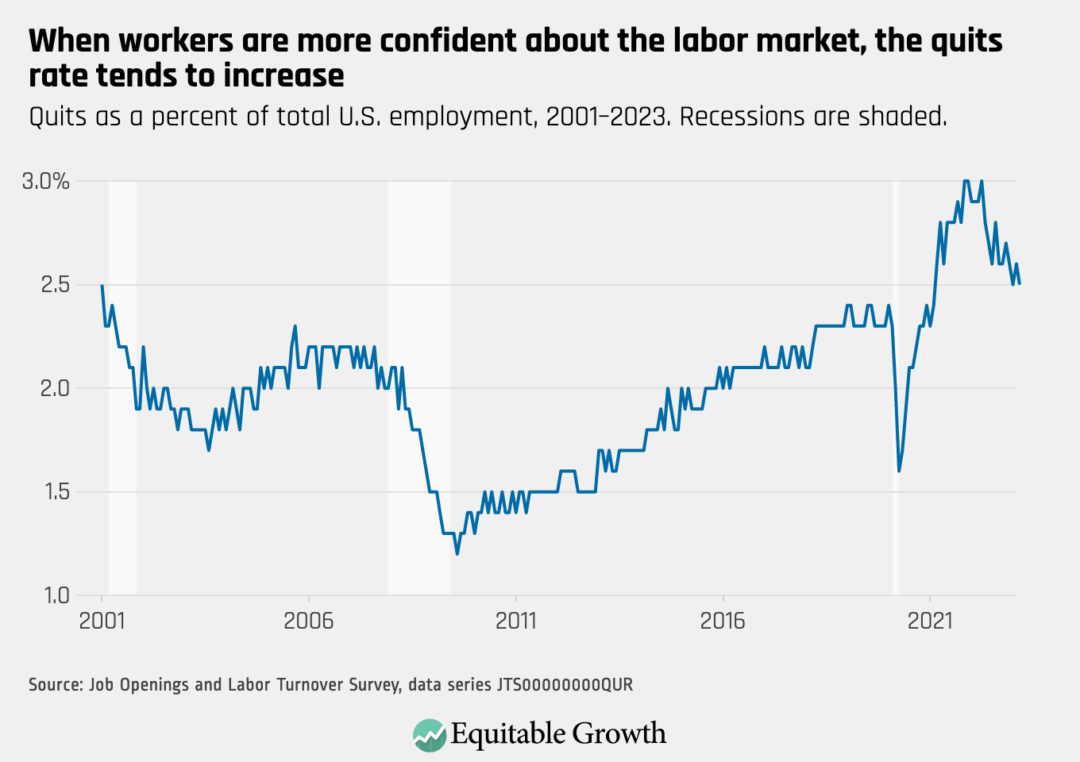
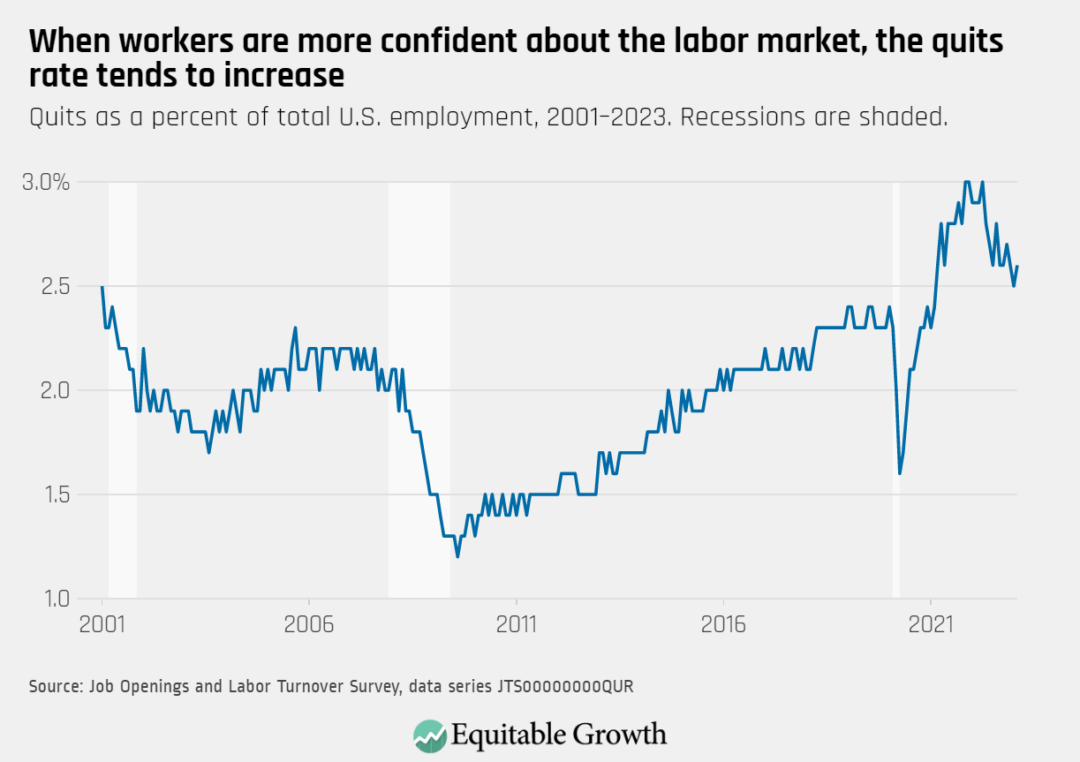
Every month the U.S. Bureau of Labor Statistics releases data on hiring, firing, and other labor market flows from the Job Openings and Labor Turnover Survey, better known as JOLTS. Today, the BLS released the latest data for March 2023. This report doesn’t get as much attention as the monthly Employment Situation Report, but it contains useful information about the state of the U.S. labor market. Below are a few key graphs using data from the report.
The quits rate declined slightly to 2.5 percent as 3.9 million workers quit their jobs in March 2023.
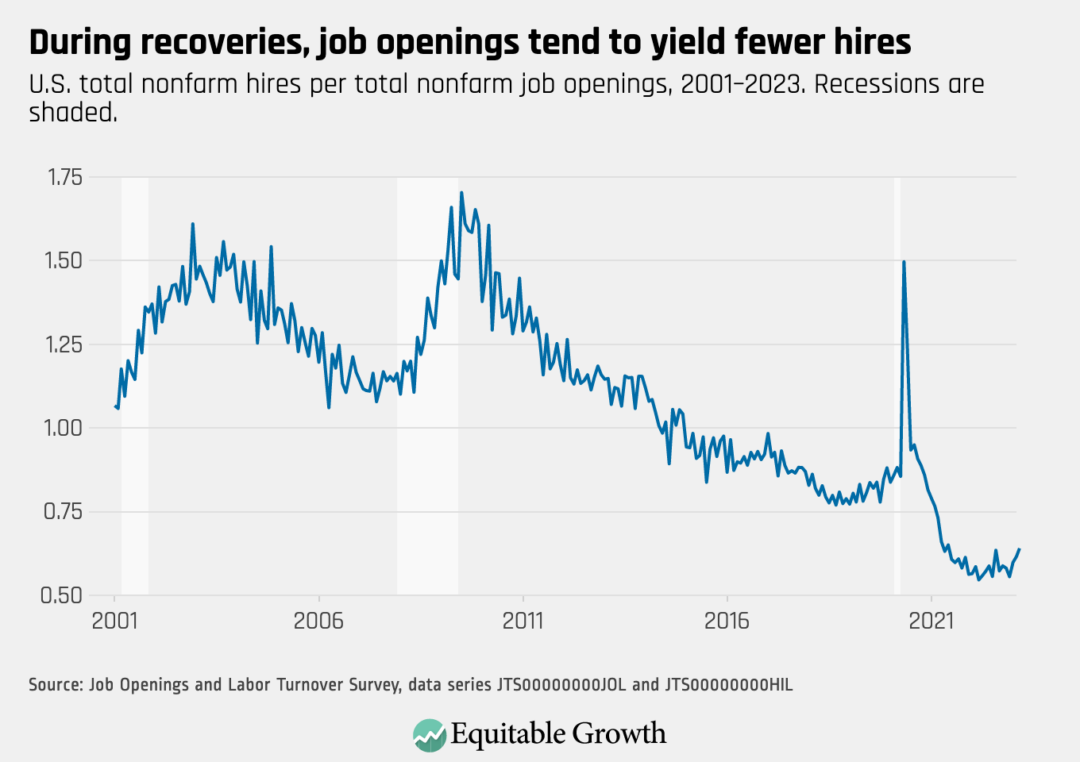
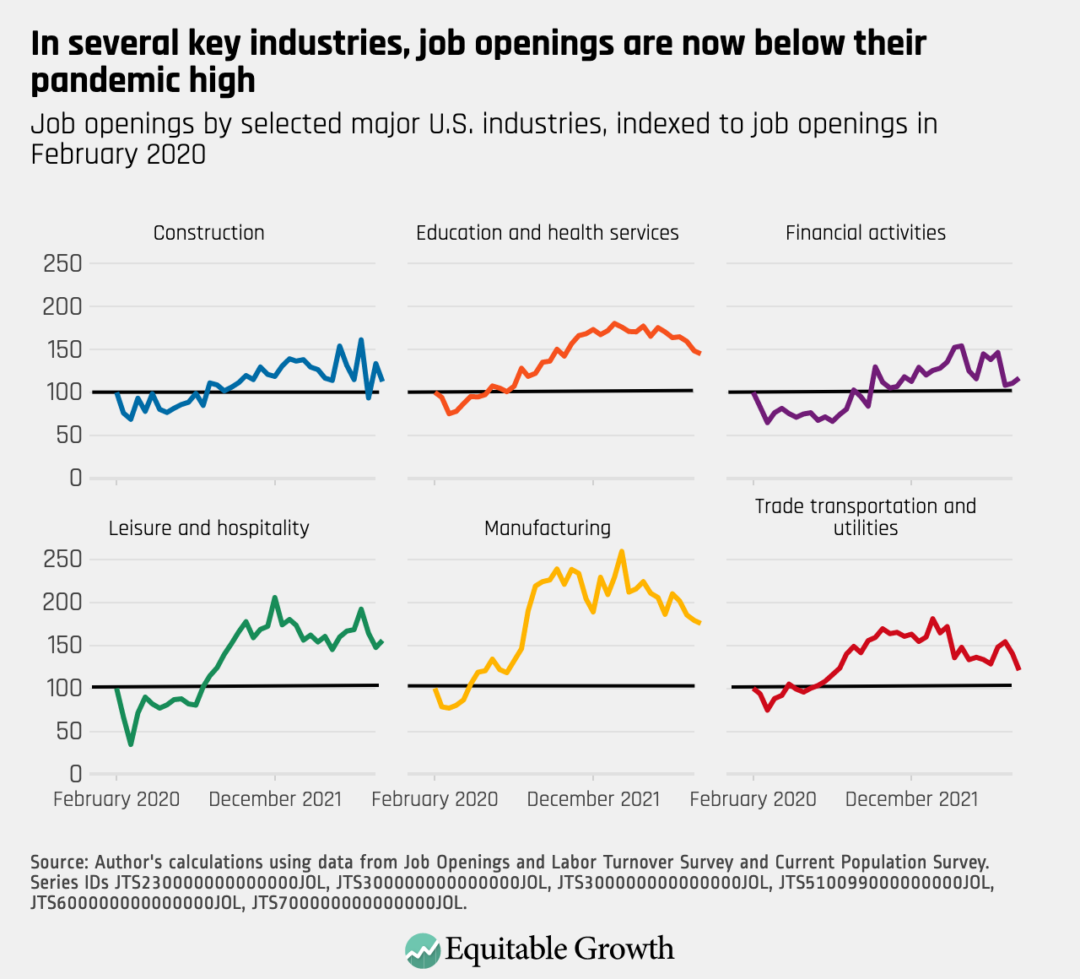
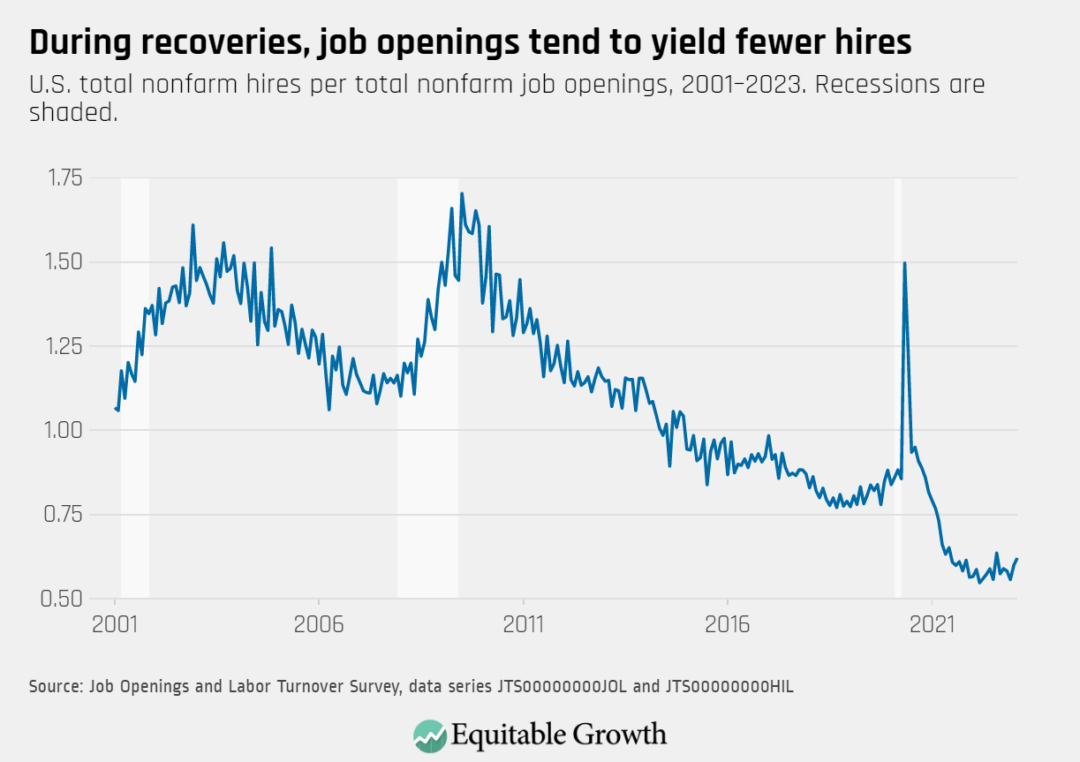
The vacancy yield increased in March as job openings fell to 9.6 million and hires declined slightly to 6.1 million.
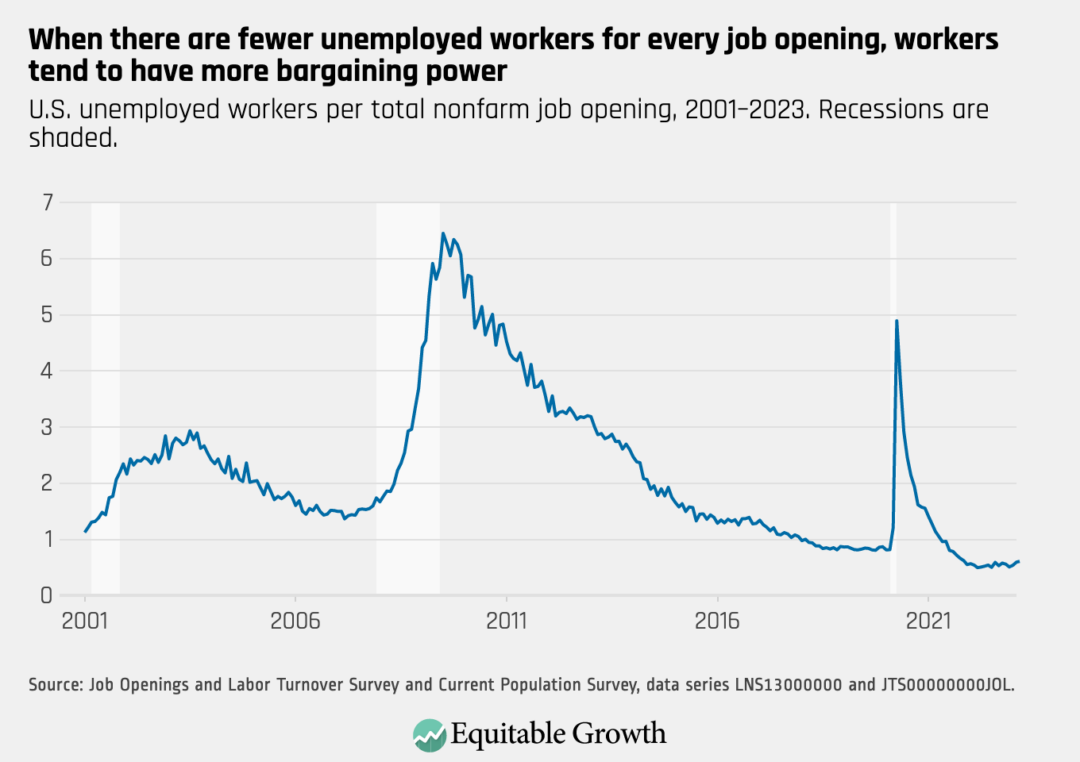
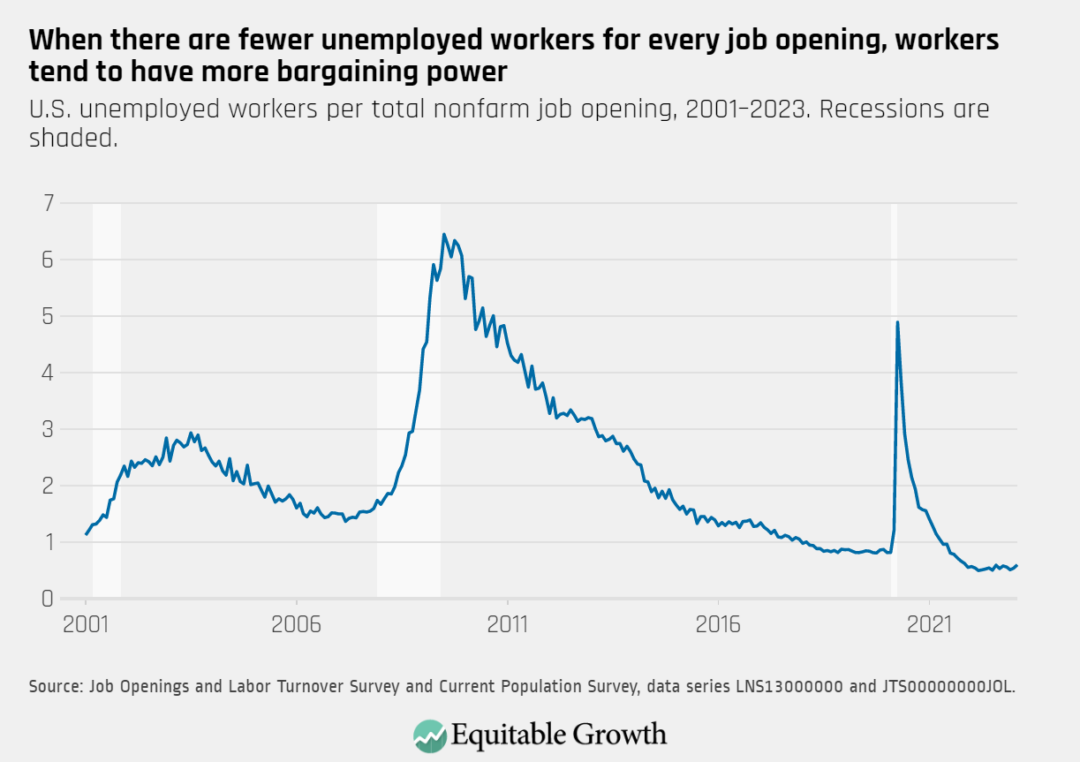
The ratio of unemployed workers to job openings did not change dramatically in March, as both unemployment and job openings ticked down.
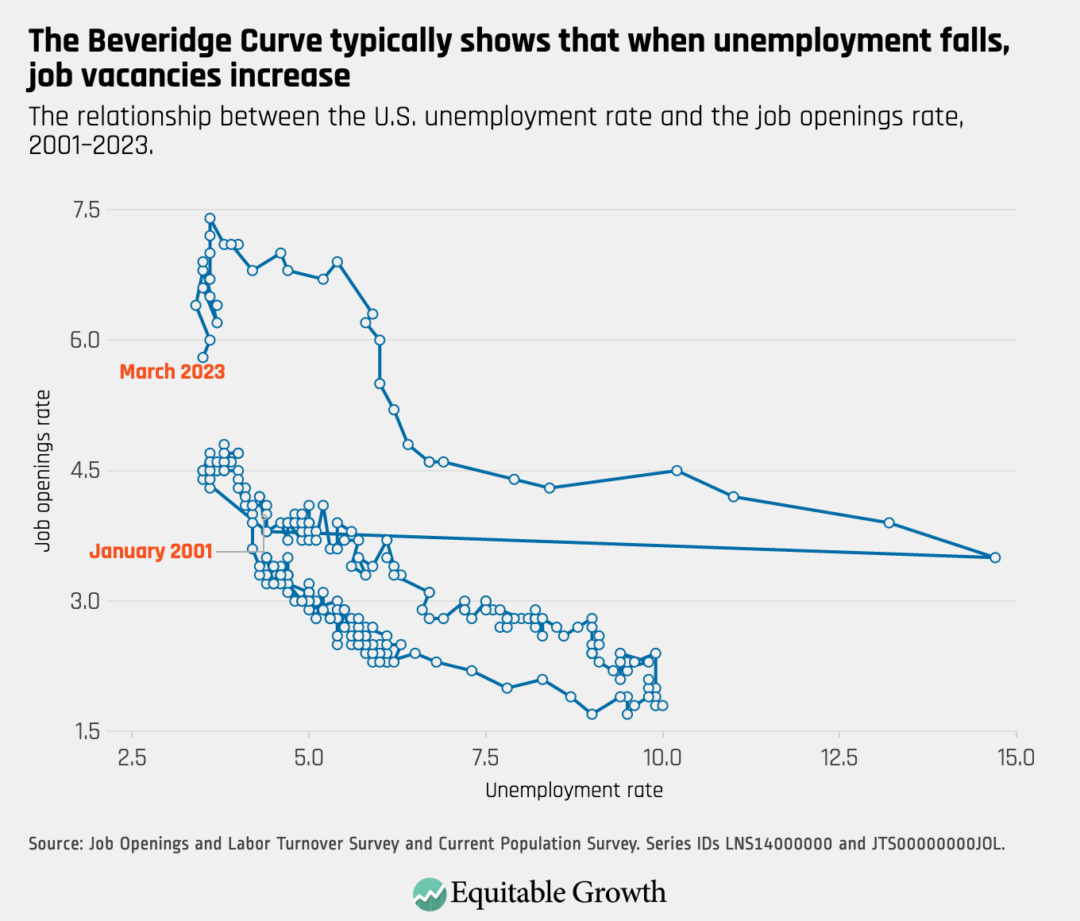
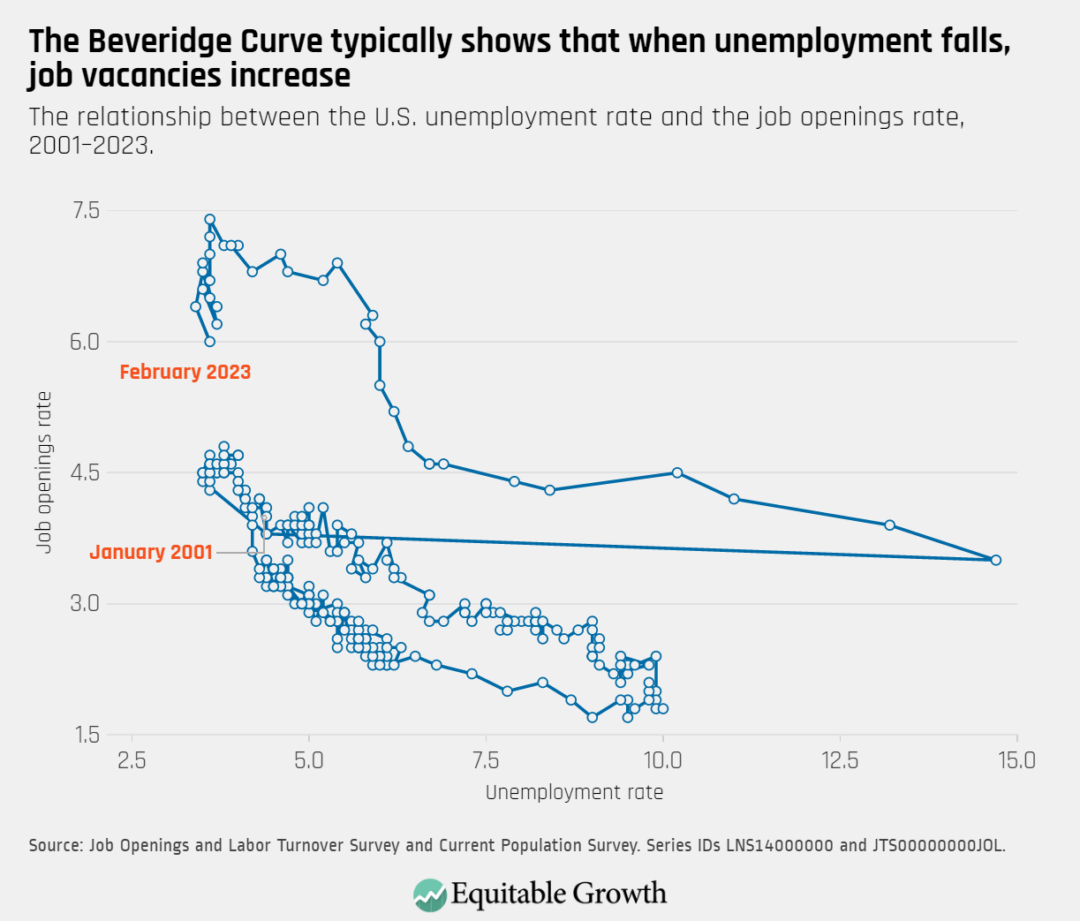
The Beveridge Curve moved downward and to the left in March, as the unemployment rate and rate of job openings both declined.
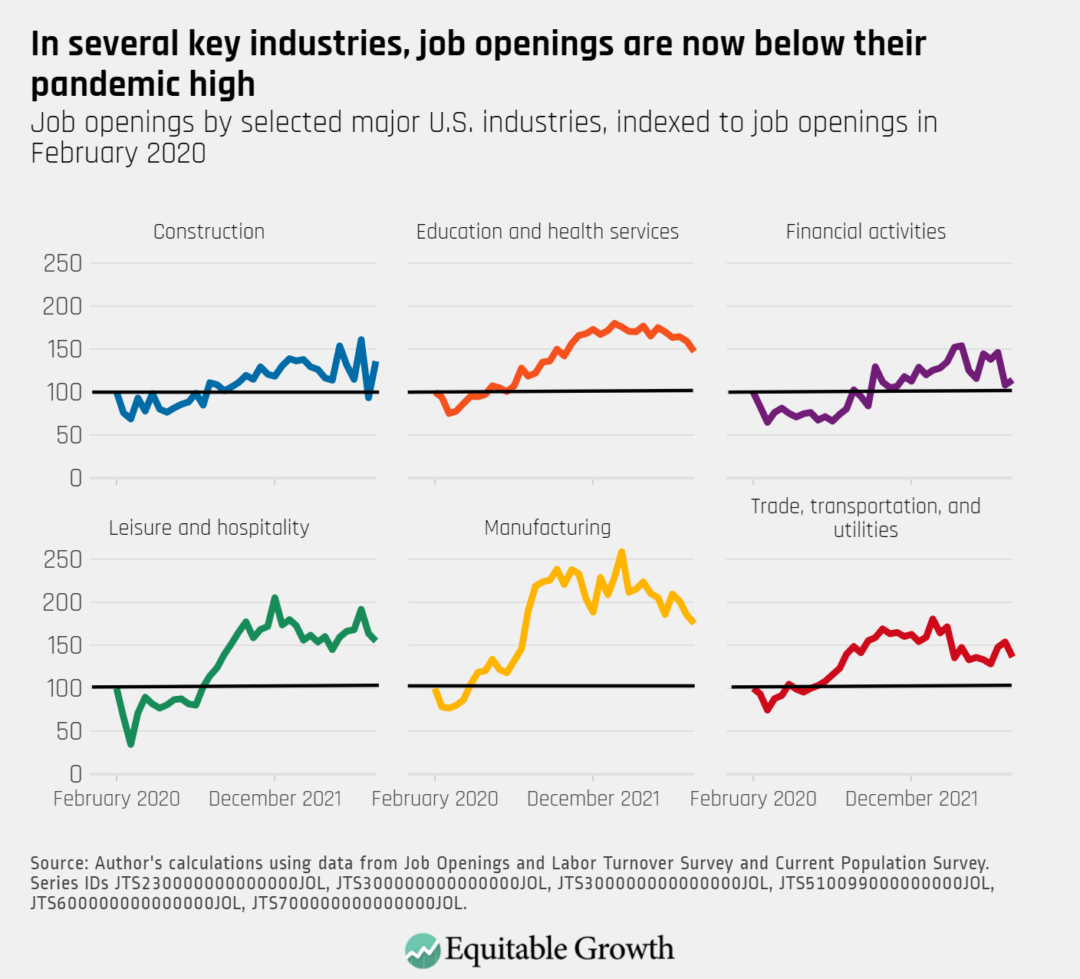
The number of job openings decreased by 384,000 in March, including continued declines in sectors such as education and health services, manufacturing, and trade, transportation, and utilities.
This column is the fourth inaseries by guest authors examining systemic racial, ethnic, and gender inequities in the U.S. economy and in access to government social infrastructure and income support programs—inequities that hinder the full growth potential of our economy and the well-being of our society.
Whether it’s a traffic ticket for rolling through a stop sign, or forgetting to signal before a turn, most people reading this will have had at least one experience with government-imposed fines and fees. For a wealthy person, paying a $100 traffic fine plus hundreds of dollars more in added fees may be a slight inconvenience, but if you are one of the 64 percent of U.S. consumers living paycheck-to-paycheck, that same ticketing fine and those hundreds in added fees could mean you are no longer able to afford rent or feed your family.
In the scenario above, that initial traffic fine and fees would appear on the same ticket, which misleads many to believe the two are interchangeable monetary sanctions. But there is a big difference between a fine and a fee—and that distinction has huge implications for how we understand their impacts.
A fine is a financial punishment for a civil or criminal offense. Some examples of common fines include those for traffic violations, littering, and cracked windshields. But fees—or alternatively “costs” or “assessments” or “surcharges”—are simply hidden taxes; their sole purpose is to raise revenue for governments. And governments charge fees at multiple points of interaction with the criminal justice system. They can be attached to everything from minor traffic tickets, to ‘free’ public defenders, and even to emergency medical care in jail.
Fees can quickly snowball into hundreds of dollars, even thousands of dollars, in court debt for people who come into contact with the criminal justice system. Those who can’t afford to pay these exorbitant fees risk a suspended driver’s license, arrest, and jail. Low-income communities and people of color are disproportionately impacted by court debt, but anyone who misses just one fee payment can be trapped in a cycle of debt and punishment.
How jurisdictions across the nation became increasingly reliant on fines and fees
Beginning in the 1980s, state and local governments increased the amount of fines and fees imposed on people convicted of traffic and municipal code violations, misdemeanors, and felonies in an effort to generate revenue. During that same period, the federal government also cut the total amount of financial assistance to local governments from 22 percent to approximately 6 percent of city budgets.
While federal funding decreased in the 1980s, the criminal legal system also began to grow exponentially. Following changes in sentencing laws and policies, state and local governments spent more money arresting, prosecuting, and incarcerating more than ever before. State spending on corrections increased from $6.7 billion in 1985 to $56.6 billion in 2019.
State and local jurisdictions deepened their reliance on fees particularly during times of fiscal stress, such as in 2008 and 2009 during and immediately after the Great Recession. They introduced new fees and increased the amount charged for fees in an ill-fated attempt to fill budget gaps. A 2019 analysis of fine and fee revenue rates found that in 600 jurisdictions across the nation, fines and forfeitures accounted for more than 10 percent of the general fund, and “in at least 284 of those governments [was] more than 20 percent.”
Government reliance on fines and fees exacerbates racial disparities and makes communities less safe
After a police officer killed Michael Brown in 2014, the U.S. Department of Justice began an investigation of the Ferguson Police Department. Their investigation found that the FPD was engaged in aggressive, racially discriminatory policing practices incentivized by the city’s dependence on the criminal legal system to raise revenue. Specifically, the report found that despite only making up 67 percent of the population, Black people accounted for 85 percent of FPD’s traffic stops, 90 percent of its citations, and 93 percent of its arrests from 2012 to 2014. By 2015, the city planned to collect more than 23 percent of its revenue through fines and fees.
Unfortunately, racially discriminatory policing practices driven by governments’ reliance on fines and fees isn’t just a Ferguson problem. A study in Nevada found that while Black people made up approximately 13 percent of the population of Las Vegas, nearly 45 percent of all arrest warrants issued for failure to pay a traffic ticket were issued against Black people.
Police acting as armed debt collectors does not make communities safer. Instead, this practice exposes people of color to more interactions with law enforcement. When this happens, routine traffic stops can become deadly, as in the cases of Samuel DuBose and Philando Castile.
Samuel DuBose, an unarmed Black man, was shot and killed by Cincinnati police during a traffic stop for an allegedly broken tail light. He had previously been stopped multiple times for driving on a suspended license, for which he accumulated many unpaid fines and fees.
Philando Castile was pulled over by police in Minneapolis-St. Paul, Minnesota at least 46 times, almost all for minor non-safety-related violations, and issued more than 80 citations. Even after half were dismissed, he still owed more than $6,000 in fines and fees, leading to multiple driver’s license suspensions. The 47th time he was pulled over, a police officer shot and killed him.
Another recent study of the impact of New Mexico’s fines and fees found that the pressure to pay fine and fee debt can drive people toward high-risk behavior, undermining community safety. Nearly half of respondents in the study reported resorting to “payday” loans—that is, short-term, high-interest loans, usually due on their next payday—or other exploitative loan options to pay fines and fees. Additionally, 41 percent of respondents indicated they had, at some point, committed a crime to get money to pay court-ordered fines and fees.
The imposition of fines and fees on working families, coupled by the egregious practices used to collect these court debts, systematically strips wealth and well-being from impacted communities. The result of this wealth extraction is that working families are often forced to forgo healthcare, food, and other basic needs in an ill-fated attempt to pay down the debt. With inflation continuing to rise and the federal minimum wage not moving to meet rising costs, low-income families need to use all of their financial resources to survive.
States and localities have the power to end fees and decriminalize poverty
In New York, my home state, the most egregious fee is the mandatory surcharge attached to every conviction, including minor infractions and traffic tickets. Courts do not waive or reduce these kinds of surcharges — or even consider your ability to pay them. Depending on the type of conviction, a single mandatory surcharge can amount to hundreds of dollars.
In New York, a $455 court fine or fee is equivalent to two weeks’ worth of groceries for a mother and her two children. Where is this mom supposed to come up with that money without sacrificing basic needs? For New Yorkers that are struggling to make ends meet and pay down court debt, this impossible choice is one they must face nearly every day.
Right now in New York, I have the privilege of serving as one of the leaders of No Price on Justice, a coalition of impacted community leaders, advocates, public defenders, and policymakers working to pass the End Predatory Court Fees Act. This bill would eliminate the mandatory surcharge and probation fees, and end incarceration and commissary garnishment for an inability to pay fines and fees. It would also end the mandatory minimum fines that currently do not allow for judges to consider a person’s economic circumstances when assessing a fine.
In the fight to end fees in the justice system, New York does not stand alone.We stand together with a growing national movement working to end the criminalization of poverty. In January 2023, the Fines and Fees Justice Center together with Americans for Prosperity and the American Civil Liberties Union, launched End Justice Fees, the first national campaign dedicated to ending fees in the justice system and discharging their associated debt.
In recent years, dozens of states and localities in states both red and blue have enacted reforms to eliminate one or more fees. Oklahoma, Louisiana, Texas, and several other states have recently eliminated some or all fees charged to youth in the juvenile system. A growing number of states and localities also are taking steps to eliminate electronic monitoring fees, probation and parole fees, counsel fees, and the many other fees imposed on people at all levels of the justice system. With successive laws in 2020, 2021, and 2022, California has enacted some of the most far-reaching reforms to date—eliminating 40 fees, including probation, parole, and local booking fees, and discharging over $16.5 billion in court debt.
Nationwide calls to end these unjust fees are also backed by widespread support among U.S. voters from all demographic groups. A recent nationwide poll released by the Fines and Fees Justice Center finds that 62 percent of voters favor fee elimination.
It’s time for our leaders to recognize the dangers inherent in relying on fines and fees to fund governments, and work towards ending fees and restoring families’ ability to thrive.
Are you interested in being part of the movement to end justice fees in your state? Want to learn more about our work in New York? Please contact us at info@fineandfeesjusticenter.org
This past January, the Biden administration unveiled its “National Strategy to Develop Statistics for Environmental-Economic Decisions,” an effort to bring the health and sustainability of natural resources in the United States into the broader system of national accounting. This is not without precedent. Some nations already produce these kinds of accounts, generally using guidelines produced by the United Nations. Ultimately, the goal is to supplement well-known national accounts metrics, such as Gross Domestic Product, with data that reflects the economic costs of depleting natural resources.
When trees are cut down to create some final product—think paper or furniture—this activity is recorded in GDP as an addition to national income. A product was created and sold, adding value to the economy. But a natural resource was depleted, and services provided by that natural resource were similarly depleted, including improved air quality, recreation for campers, and runoff reduction. Gross Domestic Product does not account for these losses.
Ultimately, the pursuit of higher GDP growth without regard for the costs of environmental harm could make current levels of GDP unsustainable as the resources that once powered growth dry up. This is hardly a hypothetical scenario: the collapse of fish stocks in U.S. waters sometimes wipes out entire industries.
Environmental-economic accounts aim to provide policymakers with the information they need to manage both the growth of the economy and the future sustainability of the economy. Policy choices about the use of natural resources involve complicated tradeoffs, and the accounts will help policymakers understand those tradeoffs better. For instance, it might help decide whether designating a forest as a protected area will provide health and recreational benefits that outweigh the benefits of opening that same land to resource extraction.
In this issue brief, I give a non-technical introduction to environmental-economic accounting and review some of the Biden administration’s recommendations for implementation.
What are environmental accounts? What do they look like?
Thanks in large part to the UN’s System of Environmental Economic Accounting framework, some nations are already publishing sophisticated environmental economic accounts. The best way to understand what the Biden administration is trying to achieve is to look at some of the existing examples.
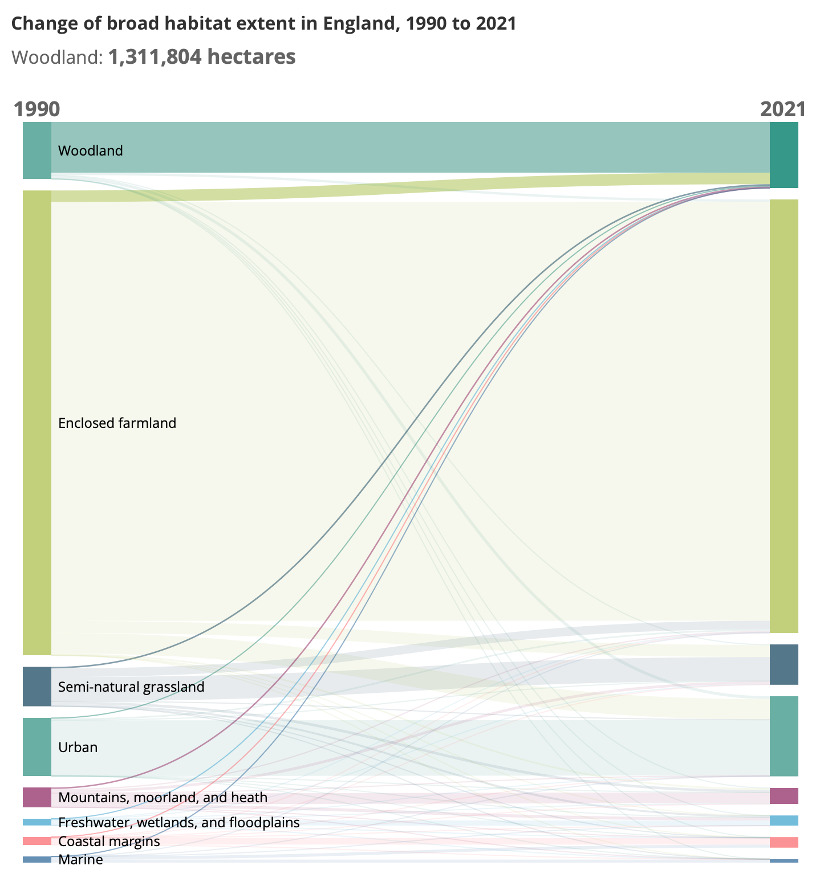
Perhaps the simplest kinds of accounts to understand are those that track the physical stocks and flows—economic jargon for change in a stock—of natural resources in a country. The United Kingdom’s Office for National Statistics, for example, tracks the total land area of various kinds of habitats, such as mountains, woodlands, farmland, and so on. These natural resource accounts enable measurements such as how the area of each of these ecosystems changed in England between 1990 and 2021. (See Figure 1.)
Figure 1
Natural resource accounts in the UK track how land use changes over time
Changes in the broad habitat of England, 1990–2021*
Source: Office for National Statistics: England natural capital accounts 2023, available at https://www.ons.gov.uk/economy/environmentalaccounts/bulletins/englandnaturalcapitalaccounts/2023
* The height of each bar represents the total land area of the ecosystem, and the paths between ecosystems between the two years show how land use shifted. The data is for England, which is part of the United Kingdom alongside Scotland, Wales, and Northern Ireland.
Woodlands in England, for example, increased from 1,133,411 hectares in 1990 to 1,311,804 hectares in 2021. The largest part of that expansion, about 230,000 hectares, came from the conversion of enclosed farmland to woodlands.
The United Kingdom additionally publishes several accounts that record the amount of extraction of various natural resources in a year. Its natural capital accounts from 2022, for example, reports that across the UK in 2020 about 1.2 million tons of fish were captured, 21 million people engaged in enough recreation in nature to realize significant health benefits, and about 65,000 gigawatt hours of electricity were produced by wind power, up from 946 gigawatt hours in 2000.
The intent of accounts that track the existing stock of natural assets and the annual flows is simple enough. They provide concrete metrics for assessing what resources a nation holds, and whether those stocks are increasing or declining. But what most people want out of environmental-economic accounts isn’t simply accounting for the number of people who spent some time exercising in nature. Rather, they want to know the value of services such as recreation to the economy. For that, national accountants must find ways to put a monetary value on the various services that ecosystems provide.
Valuing ecosystem services
Properly accounting for all the economic benefits of an ecosystem—each of which economists refer to as an “ecosystem service”—is a daunting task. A forest provides timber, and by observing the aggregate sales of products made from that timber, it is simple to value this ecosystem service. In fact, this kind of service is already included in GDP, since the value of trees cut down for timber is reflected in the final sales cost of products made from that timber. In these cases, environmental accounts serve primarily to make these natural contributions more visible and bring them onto the balance sheet.
But in addition to the provision of timber, there are dozens of other services the forest provides that matter. Trees remove and sequester carbon from the air, prevent runoff that damages water quality, provide recreation for campers and tourists, and more. The task of environmental accounting is to find ways to value these services so they can be considered in policy alongside other economic activities.
Economists have a number of clever ways to do just that. The Biden administration’s national strategy report gives one example. Suppose a naturally formed sand dune protects houses and other buildings in a waterfront community from flooding. This dune currently is not valued by the national accounts. But the dune’s existence will be acknowledged by insurers, who will charge lower premiums in areas that are less likely to flood. Additionally, home prices in the area may be higher than in a neighboring area that is not similarly protected. Comparison of these values allows economists to estimate the value of the service supplied by the sand dune.
Some of these techniques for valuing ecosystem services remain a point of contention between environmental economists and national accountants. The appropriate way to adjudicate these disputes is to start putting the accounts into practice. Given resources, national accountants should be able to find suitable methods for navigating these disputes. National accountants object to some common features from valuation in the environmental economics literature, such as the inclusion of consumer surplus, which is incongruent with traditional national accounting. But as some researchers have pointed out, techniques from environmental accounting provide a useful starting point for estimating accounting values.
It can be dizzying to think about all the ways humans are dependent on these ecosystems. The removal of pollution from the air by plants has far-ranging impacts on human health, such as reducing the severity of asthma, which costs the U.S. economy billions of dollars every year. In some instances, values of an ecosystem service may change significantly as researchers learn more about their benefits. The U.K.’s accounts, for example, value urban cooling.
The Biden administration’s handbook for establishing these accounts recommends that agencies use “the best available economic science for monetizing the value of natural assets.” The call for “best available” recognizes that valuing some ecosystem services is currently difficult, and in some cases may be impossible. It is unlikely that a system of environmental-economic accounts will be able to exhaustively document the benefits of every ecosystem.
But this is not a reason to discard environmental-economic accounts. Researchers at the Centre for Social and Economic Research on the Global Environment at the University of East Anglia perceptively note that, “in their historical evolution, national accounts have always included a degree of pragmatism. So what is included or excluded from the national accounts is to some extent a matter of choice.”
As a related example, paid child care adds to GDP, but a parent providing similar care at home does not contribute to GDP at all. Standard accounts such as GDP already make pragmatic choices based on our ability to assign values to economic activity. The environmental-economic accounts will be no different.
That dominance hasn’t been entirely positive, but it’s a useful illustration of what makes a metric politically powerful. Gross Domestic Product is frequently referenced because it is:
Released frequently, on a quarterly basis
Released quickly, just one month after the end of the quarter it measures
Comparable across virtually every country on Earth
Although frequently misunderstood in myriad ways, the concept is relatively simple and easy for non-specialists to understand (“making the pie bigger”).
Metrics that aim to usefully complement GDP and correct for its limitations should target some of these same features so they are adopted and used by the public. The Biden administration’s plan does an excellent job of identifying and addressing this need. The national strategy recommends a headline statistic to report to the public: change in natural asset wealth.
In other words, once dollar values are determined for the value of carbon sequestration by trees, crop pollination by bees, underground minerals, and every other quantifiable benefit of the natural world, federal economists would simply sum the change in these dollar values for the year, putting all these very different services in the form of one easy-to-understand number. Positive numbers would indicate successful stewardship of the natural world and a sustainable path of economic development.
The Biden administration further recommends annual reporting, with publication in April to coincide with Earth Day for increased media reach. Finally, the administration recommends adhering to standards in the UN’s SEEA Central Framework and Environmental Accounting frameworks to insure international alignment. These are great recommendations. National statistics aren’t solely for specialists. They should aim to inform the public about important challenges facing the nation, and it is encouraging that the administration is taking this charge seriously.
Conclusion and further reading
Although economists are still researching environmental-economic accounts, now is the right time to transition from research to practice, as many nations already have. The science of environmental-economic accounts is mature, and bringing the expertise of our national statistical agencies to bear on this new frontier will greatly hasten the development of techniques for accurately valuing natural wealth.
Some critics, including environmentalist critics, argue that putting a dollar value on nature inevitably undervalues it, and that we are better off not trying at all. The act of attempting to put an economic value on the natural world may strike some as “economism,” a somewhat pejorative term referring to the habit of economists to try to interpret everything through the lens of production and acquisition.
Creating these accounts will be an enormous undertaking, requiring significant federal expenditures to develop new federal data infrastructure. The administration’s detailed plan, backed up by a strong budget request of $8 million for the U.S. Department of Commerce’s Bureau of Economic Analysis to begin implementation, demonstrates a desire to make the United States a leader in national economic statistics. Congress should support this year’s budget requests and the implementation of these accounts.
In our comment letter, we demonstrate why non-compete clauses limit U.S. labor market competition. Absent some offsetting benefit to labor market competition, non-compete clauses are plainly anticompetitive. We note that if non-compete clauses had offsetting benefits to U.S. workers and labor market competition, then one would expect to see that reflected in workers’ wages. But the weight of the empirical evidence demonstrates that, in most cases, non-compete clauses are associated with lower wages and worse conditions for workers.
What’s more, non-compete clauses are often implemented in deceptive or coercive ways. Even when not initially deceptive or coercive, once a non-compete clause is in place, employers can degrade working conditions or depress wages without the threat of competition from other employers or concern that workers will quit.
Non-compete clauses also can limit competition in U.S. product markets by locking up labor supply and making it costly or impossible for new firms to enter and compete. These exclusionary effects from non-compete clauses harm both workers and downstream customers.
Indeed, non-compete clauses have few legitimate justifications to competition versus benefits to employers. Even if there are some circumstances where non-compete clauses are not anticompetitive, there are significant benefits to a clear, bright-line rule. Such rules provide unambiguous guidance to employers and employees alike, and they avoid uncertainty about what conduct is and is not allowed.
Chicago Public School students protest to remove Chicago Police officers from schools, June 2020.
This column is the third in a series by guest authors examining systemic racial, ethnic, and gender inequities in the U.S. economy and in access to government social infrastructure and income support programs—inequities that hinder the full growth potential of our economy and the well-being of our society.
Assigning local police forces to U.S. public schools harms students economically, academically, and socially—especially Black students and other students of color. A large and growing body of data-driven research demonstrates that the misperceived benefits of what is essentially school security theater masks the far-reaching, long-term harmful consequences of empowering police in educational settings.
This body of research more specifically demonstrates that students who are arrested at school face a series of collateral consequences that harm their futures, their families, and their communities, including:
The loss of instructional time and course credits
Unnecessary and unwarranted court fees and legal costs
Family separations
Emotional and physical trauma
Challenges to some students’ immigration status
The loss of housing assistance
The loss of employment and unemployment opportunities.7
Our column details the research on these thoroughly preventable outcomes and the misplaced idea that law enforcement has a role to play in our nation’s public schools. In fact, there are actionable evidence-based practices conducted by trained professionals who can help students with the support and care they need to navigate both adolescence and an unprecedented global health crisis.
The impact of police in public schools on Black students
School policing also disproportionately targets Black students.11 Research continues to demonstrate that Black students are arrested at higher rates when police are present in schools.12 Research in the area of office referrals, suspensions, and expulsions in public schools shows that Black students are not receiving disproportionate school disciplinary consequences due to higher rates of misbehavior. On the contrary, Black students do not misbehave more than their White peers.13
Outcomes are even worse for Black girls in public schools. Research by the U.S. Department of Education shows that Black girls are four times more likely than their White peers to be arrested, three times more likely to be referred to police, and two times more likely to be physically restrained.14
Moreover, policing students at school is ineffective and costly. Research by the National Institutes of Health’s National Library of Medicine demonstrates that school police neither make schools safer nor avert school shootings.15 Instead, police in schools negatively affects these schools’ climate and student safety.16Heavily policed school atmospheres can alienate and increase anxiety in students, create a sense of mistrust between peers, and result in adversarial relationships between students and school officials.17
Nonetheless, local and state governments, as well as the federal government, continue to spend millions of dollars on the school policing infrastructure. This includes school police officer salaries and benefits, weapons, surveillance technology, and expensive monetary settlements following instances of excessive force and abuse perpetrated on students by police in schools. Between 1999 and 2019, state and federal governments invested close to $2 billion on school police.18
Since the 2018 mass shooting at Stoneman Douglas High School in Parkland, Florida and the passing of the federal STOP School Violence Act, many states have begun their own school police grant programs to the tune of hundreds of millions more dollars for school police.19 This allocation of funding toward police comes in contrast to years of budget cuts to education spending in school districts across the country.
Placing police officers in schools also creates a significant threat to the physical and emotional safety of Black students and students with disabilities. A new study by one of the authors of this column and his co-authors finds that of the 285 instances of school police officers physically and sexually assaulting students between the years 2011 and 2021, more than 80 percent of the victims of police assaults at school were Black students. Additionally, more than 25 percent of police assaults were on students with disabilities or students with reported mental health concerns.20
Black girls in particular were vastly overrepresented at nearly a third (30.7 percent) of all reported police assaults against students. Similar to the lack of police accountability that sparked protests following the murders of Mike Brown, Breonna Taylor, and many others, this study also finds that the offending officers suffered no consequences in well over half of the incidents. (See Figure 1.)
Figure 1
New police surveillance technologies in schools only make matters worse
Placing police in school and the growing trend of student surveillance merely creates the illusion of safety and security. There is no actual peer-reviewed evidence on the efficacy of surveillance measures being implemented in schools, including student device and social media monitoring, facial recognition, and weapons abatement technology. Instead, studies show that these technologies are flawed, and in manycases, simply do not work.21
What’s more, government surveillance chills free speech in public schools.22 Similar to the disproportionate impact of police in schools, these new surveillance technologies place students of color, students with disabilities, and LGBTQ+ students at greater risk of harm, including exclusionary discipline and increased contact with law enforcement.23
Policies that are effective at promoting safety and care in public schools
Students need support and care as they attempt to navigate both adolescence and an unprecedented global health crisis. School police are incapable and ill equipped to meet students’ social, emotional, and mental health needs in this moment.
Instead, students’ needs should be met by implementing proven, evidence-based practices performed by individuals trained to support young people. These trained individuals include restorative justice practitioners, counselors, mental health practitioners, and other qualified support personnel who are regularly trained in trauma-informed, youth-centered practices.
In short, the treatment of student trauma requires holistic student support services that address the root causes of the issues students are facing, not policing or criminalization.
Ultimately, to achieve school safety and foster nurturing learning environments, school leaders and policymakers must implement strategies that create cultures of care that seek to prevent and repair harms, while also teaching students and staff how to be accountable for their actions.
—Tyler Whittenberg is deputy director of the Opportunity to Learn Program at the Advancement Project. Jessica Alcantara is senior staff attorney for the Opportunity to Learn Program at the Advancement Project. For more information about the national campaign to remove police from schools, visit www.policefreeschools.org.
The U.S. Department of Commerce last month announced new requirements for semiconductor manufacturers seeking funding under the CHIPS and Science Act of 2022—a key component of the Biden Administration’s industrial strategy approach to economic policy. One of these requirements is that larger chip manufacturers must have a plan for supporting their workforces’ child care needs to access this new funding.
Employers—through the taxes they pay and benefits they provide—have an important but delicate role to play in the U.S. child care crisis. Employer-supported child care helps defray essential costs paid by employees, ensuring firms that otherwise freely benefit from the child care system have some necessary skin in the game. A policy agenda that promotes employer-sponsored child care without other public investments, however, could have unintended consequences for the broader U.S. labor and the overall child care market.
This column discusses how employers benefit from the child care system, opportunities and risks posed by employer-sponsored child care, and options within the CHIPS Act, including employers’ direct engagement with existing child care providers that can strengthen local child care markets across the United States.
Employers reap the benefits of their employees’ unsustainable child care costs
The U.S. child care system is primarily funded by tuition fees paid by families, with the median price ranging from $5,357 to $17,171 a year, depending on location, children’s ages, and the type of child care provider. Parents pay these high costs because they get something in return, such as peace of mind that their child is safe, and the time to pursue other activities, including education, job training, and work. In facilitating these activities, child care creates economic benefits far beyond just the families that use and pay for it.
Employers and U.S. workers without children reap the benefits of a mostly privatized child care system without bearing significant financial costs. More specifically, employers benefit from a more diverse, educated, and sizeable labor force. Firms then have a larger pool of potential workers to choose from, allowing them to hire more easily and find the best possible matches for their open positions, which supports productivity across the U.S. economy. This spillover of benefits—what economists call a positive externality—is one of the reasons the U.S. Department of the Treasury asserts child care is a failed market.
The current child care system, however, limits these benefits. Workers who cannot bear the high costs of child care alone are locked out of the U.S. labor market, unable to match into good jobs. Bringing other beneficiaries of the child care system—employers and nonparents—into the funding of these services would bolster the U.S. labor market and support the overall stability of the child care market, all while moderating costs on families. Publicly funded universal child care—just like public kindergarten through 12th grade education, which is supported by taxpayers regardless of parenthood status—would provide a social and economic good worthy of public support.
Robust public investment, potentially in the form of direct support to child care providers and progressive subsidy payments to families through existing tax revenue, would meaningfully achieve this goal. With the implementation of the CHIPS Act, the Biden Administration is probing an intermediary fix: employer-sponsored care.
As this column will detail below, there are tangible benefits to this approach, but a broader policy strategy that relies on employers first may have unintended consequences for labor and child care markets in the longer-term.
Child care requirements for CHIPS and Science Act funding recipients
But first, let’s unbundle the CHIPS and Science Act. The new law provides $280 billion in domestic research and manufacturing of semiconductors, and is a cornerstone of the Biden Administration’s industrial strategy approach to economic policy. Separating industrial policy from traditional corporate welfare—taxpayer support of already profitable industries—are the contingencies and requirements placed on funding opportunities. The U.S. government takes a more direct hand in shaping industries toward socially and economically optimal outcomes.
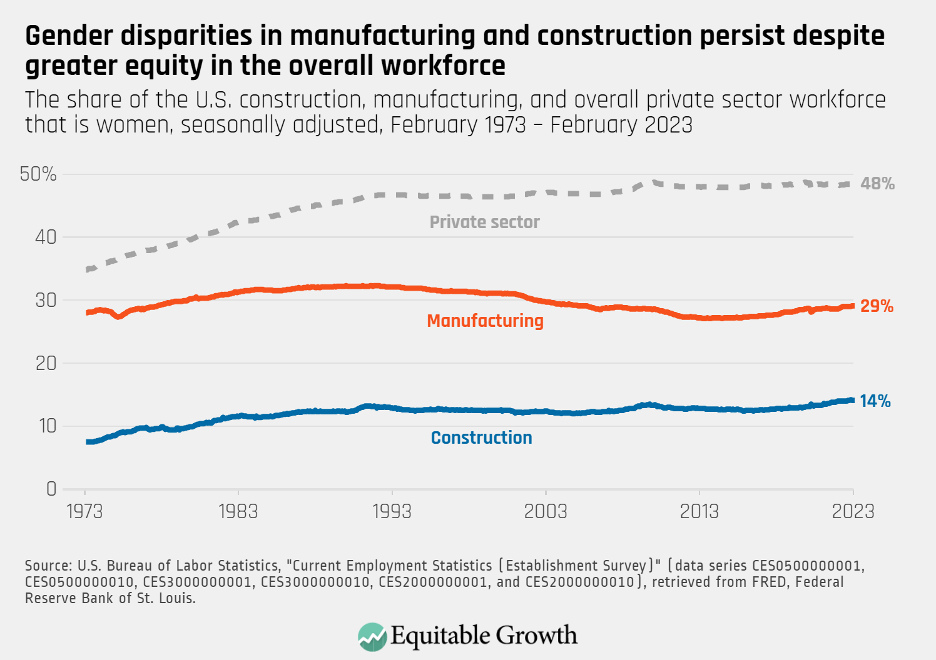
Motivating this requirement is the reality that the United States will need to grow the construction and manufacturing workforce to accomplish the production goals in the CHIPS Act and other industrial policy initiatives. Large gender disparities in these two sectors suggest that this growth may be dependent on successfully recruiting more women both into the labor force and these jobs. (See Figure 1.)
Figure 1
Research has long identified the link between accessible and affordable child care and maternal labor force participation. By building up child care infrastructure around the semiconductor industry, the Biden Administration hopes to create a pathway between new women workers and this critical sector.
In March 2023, the U.S. Department of Commerce released its workforce development planning guide for CHIPS Act applicants, providing new details on these child care requirements. Rather than prescriptive measures, applicants are presented with several funding options depending on the needs of their workforce and their communities’ local child care market. The four primary models presented by the workforce guide include:
On-site care that is fully operated by the employers
On-site care that is fully operated by external contractors
Cash assistance (vouchers) for workers to purchase off-site care
Direct sponsorship of preexisting, off-site child care providers
The CHIPS Act’s child care requirements stem from an established practice of tying employer-benefits and other elements of job quality to federal funding. In 2016, for example, the Obama Administration required federal contractors to provide paid sick leave to their employees. More recently, President Biden issued an executive order mandating salary transparency among federal contractors.
But by requiring these manufacturers to engage with third-party child care providers or potentially supplant child care services available elsewhere in the market, the CHIPS Act involves entry into the child care market that regulators and manufacturing must carefully navigate.
Employer-sponsored care may help some workers access child care, but the practice at a larger scale poses broader risks
While some large firms proactively provide child care benefits to attract and retain talent, data shows that most employers regard care needs as a private matter of personal responsibility. In 2021, for example, only 11 percent of the civilian workforce had employer-provided child care benefits, including just 8 percent of those in “goods producing industries” such as semiconductor manufacturing.
By requiring employers to plan for potential child care issues, the CHIPS Act is forcing some firms to contend with a challenge they may have otherwise ignored. This should yield tangible benefits for employees in this sector, but policymakers must be thoughtful as more employers find themselves in the child care business. They need consider whether:
Employer-sponsored child care can address coverage gaps for those with the greatest need
Tying benefits to employment can impede movement through the labor market
Employer-sponsored child care may exacerbate gender discrimination
Employer-sponsored benefits can lead further down the path of privatization
Let’s consider each of these situations briefly in turn.
Employer-sponsored child care can address coverage gaps for those with the greatest need
Employer-sponsored child care remains a rare benefit in the United States, but research indicates that it can be highly valuable for certain demographics. One study by Taryn Morrissey of American University and Mildred E. Warner of Cornell University finds that child care vouchers provided by a university employer were effective in reaching workers with the highest needs, including part-time workers and those with more complex child care requirements. A related study finds that workers who used these vouchers were more committed to their employers and reported less work/family stress.
And more recent research from Audrey Altura of Harvard University finds that women highly value on-site child care options and are more likely to apply for more intensive management jobs when on-site care is available for the extended-hours they need.
For U.S. workers who struggle to access and pay for child care—because they live in low-supply areas, do not qualify for financial support, or work nonstandard hours—employer-sponsored care provided on site or off site could meaningfully address their care needs. All four delivery models recommended in the CHIPS Act’s guidance (detailed above) would make care more accessible for these families. In different labor and child care markets, however, some delivery models carry more risk than others.
Tying benefits to employment can impede movement through the U.S. labor market
A parent’s child care needs may be similar whether they are working at a semiconductor plant, an auto factory, a fast-food restaurant, or a retail store. But if only one of these employers offers government-supported child care benefits, then it can create less competitive and less productive overall labor market conditions.
Coupling employment with essential benefits can keep workers in jobs they otherwise might leave for fear of losing access to those benefits if they move to a new employer, become self-employed, or exit the labor force. This phenomenon, known as “job lock,” is widely understood in the context of employer-provided health insurance and leads to significantly reduced job mobility.
This added friction in the U.S. labor market reduces competition. It prevents productivity-improving job changes because employees may not move to a job that’s a better match for their skills. And it can stifle entrepreneurship as potential small business owners weigh the cost of self-financing their benefits without publicly supported social infrastructure.
Providing on-site care and vouchers carry the greatest risk for stifling job market mobility, as they tie benefits directly to employment conditions. Engaging and sponsoring community child care providers, however, carries the least risk of benefit-induced job lock as it may promote a healthier overall child care market even for nonemployees.
Employer-sponsored child care may exacerbate gender discrimination
Policies such as paid child care and paid family and medical leave can encourage women’s labor force participation and improve equity in the workplace, but policy design matters. When fringe benefits are born primarily by employers and systematically used by some workers more than others, it can drive hiring, pay, and promotion discrimination for employers seeking to cut costs. Research shows that older and less healthy workers, for example, can experience discrimination in the workplace when employers face higher costs associated with these employees’ health insurance.
Already, women face greater workplace discrimination, carrying the predominant weight of caregiving and domestic responsibility in most families. Child care benefits that raise employers’ costs the more they are used may discourage the hiring and advancement of qualified women and caretakers, compounding this preexisting caregiver penalty. Researchers in Chile, for example, have documented a gendered wage penalty following a policy mandating employer-provided child care benefits.
Among the care models available for CHIPS Act recipients, a voucher or subsidy system offers the greatest risk of unintended discrimination, as the costs of providing care are directly attached to an employee’s care needs. On-site care likely mitigates this risk somewhat by driving down the potential marginal cost of new employees with care needs. The engagement and sponsorship of community child care providers carries the least risk because the costs to employers could be arranged upfront and separate from the composition of the workforce.
Employer-sponsored benefits can lead further down the path of privatization
Employer-sponsored care may fill a critical immediate need, but a policy program that systematically preferences this particular type of benefit may impede more equitable, more productive, and ultimately more affordable child care reform down the road.
The U.S. health insurance model is a primary example of how employer-provided benefits can become problematically entrenched in U.S. policy. What started as a discretionary benefit to attract employees in the 1940s amid World War II became legally codified over the decades as a taxpayer-supported, mandated benefit paid for by many employers.
While the size of the CHIPS Act’s child care provisions is small in relation to the broader U.S. child care market, and thus unlikely to radically shift the trajectory of child care reform in the United States, policymakers should be cautious by avoiding an employer-first approach to child care benefits that replicates the misguided approach of U.S. healthcare.
Policies that nudge employers to provide child care can offer some immediate benefits to employees in need, but they cannot meaningfully replace the comprehensive public investment necessary to provide equitable, affordable, and high-quality child care for all U.S. families and create a more sustainably productive U.S. economy.
Tax payments and investments in child care markets offer the greatest potential for firms to responsibly defray employees’ costs
Expanding accessible and affordable child care options, particularly those that can accommodate for nonstandard schedules, should have a positive effect on women’s labor force participation and, in the context of the CHIPS and Science Act, help the United States meet its manufacturing goals. All of the care models recommended in the CHIPS Act’s guidance—on-site care run by employers, on-site care run by contractors, a voucher system, and child care provider sponsorship—should all be expected to support employees’ short-term care needs.
Beyond just semiconductor manufacturers, employers have a role to play in addressing the U.S. child care crisis. The most direct and equitable strategy would be robust, public investment in the child care market financed through the federal tax systems. Income and corporate taxes paid into the U.S. Department of the Treasury would be redirected to the child care system through progressive subsidy payments to families and direct support to providers. This model provides the greatest support to the child care system while spreading the costs most widely.
At the state level, some policymakers are exploring a new payroll tax on employers to fund large-scale reform. New York State, for example, recently considered a progressive payroll tax, ranging from 0.5 percent to 1 percent of payroll expenses depending on firm size, to cover expanded subsidy payments to families.
A payroll tax model would provide dedicated funding for the child care market and ensure employers are paying a share of the costs. This model may, however, be more vulnerable to the ebbs and flows of the business cycle, and employers are likely to pass some of the tax onto their employees.
The child care requirements in the CHIPS and Science Act introduce a new method of compelling employers to contribute to their workers’ child care needs. While regulators are offering flexibility as to how semiconductor producers comply with the law’s child care requirements, some methods are better suited to limit unintended consequences for local labor and child care markets while investing in the health of local child care systems.
Regulators should encourage manufacturers to engage not just with their workforce, but with their community’s child care systems directly, too. Sponsoring local child care providers can help raise capacity across the local market without crowding out other families or tying child care access directly to conditions of employment.
One strategy promoted by the U.S. Department of Commerce particularly stands out: demand guarantees. With this approach, companies will guarantee a certain level of financial support to providers, reducing the risk that actual care needs differ from what was projected. This will help providers offer new services in child care deserts or during nonstandard hours when they otherwise may not be able to, due to hidden or lower-than-profitable demand.
There is, of course, no one-size-fits-all solution to providing child care amid a nationwide child care crisis. Semiconductor firms will likely need to engage in some combination of vouchers, on-site care, and sponsoring child care providers to ensure adequate care to their workforce. U.S. regulators reviewing these child care plans should be cognizant of the opportunities and potential risks of employer-provided care and work with applicants on an approach that supports, rather than supplants, local child care markets.
Conclusion
In the coming months, U.S. Department of Commerce program officers will begin the complex task of distributing tens of billions of dollars to semiconductor manufacturers through the CHIPS and Science Act. As part of this process, regulators will have to weigh how well semiconductor manufacturers are prepared to provide the needed child care support to their potential workforce.
The child care provisions of the CHIPS Act are a novel melding of industrial policy and the care economy—a necessary intervention to ensure the United States has the construction and manufacturing workforce it needs to accomplish its infrastructure and production goals.
Despite the large investment the government is making in semiconductor productions, the ramifications of the CHIPS Act’s specific child care provisions are likely to be limited in the overall child care market. Yet a larger policy strategy that nudges employer-involvement in the child care system without comprehensive public investment may have unintended consequences for the broader labor and child care markets. With the CHIPS Act, regulators have an opportunity to set an example for how employers should account for their workers’ child care needs. To the extent possible, prioritizing child care plans that support preexisting providers or expand new options in the community will set the tone for how employers and the government can work together to support the child care sector—at least until robust, public investment in care makes such efforts no longer necessary.
Inflation in the United States today is considerably cooler than at its peak in the first half of 2022, but it will remain at the center of the economic policy debate as long as readings continue to come in above the Federal Reserve’s 2 percent target. When inflation in 2022 accelerated during the first half of the year, the inflation debate was very different than the one currently facing policymakers, firms, U.S. workers, and their families. If 2022 was about unexpected inflation, 2023 is about how far and how fast inflation decelerates, whether the Fed trusts market data indicating inflationary expectations remain well-anchored, and if the Fed will overreact as inflation and the U.S. economy moderate to more normal levels.
In 2022 both supply and demand factors contributed to swiftly rising inflation, and careful real-time analysis focused on the extent to which each factor was pushing prices higher, as well as on signs of stress in supply chains that led to individual price movements. Much of the more detailed analyses of 2022 involved identifying and attributing specific sources of inflationary pressure to individual supply and demand factors. Other analyses tracked systemically important bottlenecks, including the costs of container shipping and analyzing markets that were under stress, such as job and wage pressures due to the resurgence of the service sector.
To be sure, these concerns are still with us in 2023. Inflation remains above the Fed’s 2 percent target, and systemically important, overstretched sectors of the U.S. economy remain contributors to rising prices. Yet the wave of rising inflation has crested, and the major questions this year are around how far and how fast the tide goes out.
More specifically, a crucial question for 2023 is whether policymakers think inflation’s decline will be driven by expectations, by slackening economy-wide capacity constraints, or simply whether higher consumer prices will continue to slowly abate. In what follows, this column examines seven major inflationary forces and concomitant debates that pivoted significantly between 2022 and 2023.
U.S. fiscal policy
U.S. fiscal policy was very expansionary in 2020 and 2021 and, with a series of lags, was still providing stimulative effects through much of 2022. Many households saved some fraction of the expanded income supports enacted amid the COVID-19 pandemic as part of the stimulus packages in 2020 and 2021, which supported stronger consumption spending in 2022. In contrast, for the balance of 2023, fiscal policy is unambiguously reining in inflation, and presents a nontrivial headwind for economic growth.
Indeed, as the first quarter of 2023 came to a close, the vast majority of those consumer savings are now spent, and the current fiscal impulse for more tax-and-spending policies is strongly negative.
Had the U.S. government not engaged in unprecedented economic support over the previous two years, the current fiscal retrenchment would be a major drag on growth. Thus far a high-pressure economy and strong labor market have sustained economic growth as inflation has fallen, but the U.S. economy will experience slower growth as Fed policy brings inflation further back under control. But after a year of stubborn inflation, the current state of decelerating inflation is less cause for alarm.
This doesn’t mean that consumers won’t continue to power the U.S. economy. Instead, it means a well-functioning U.S. labor market is driving real wages higher and generating incentives for businesses to invest while creating strong, sustainable, and more broadly based economic growth. There will be further fiscal pressure not just in the form of a constrained federal budget, but also from state and local governments as well, particularly those which depend on property tax revenues, which are weakening. If budget deficits and fiscal policy were an inflationary concern in 2022, in 2023 tighter fiscal conditions are reigning in inflation. Counter-cyclical fiscal policy is the correct prescription, but there is some risk that further tightening could undercut a healthy economy with moderating inflation.
The U.S. labor market
The U.S. labor market is much maligned amid the continuing economic recovery—especially as a culprit for inflation. The United States has not experienced an economic recovery paired with a rapid jobs recovery in 40 years, yet real incomes are not rising fast enough to drive inflation. Many of the same commentators who identified hysteresis—long-periods of high-unemployment begetting shrinking labor forces—have feared that this rapid recovery would create unsustainable dynamics in the labor market.
Yet in 2023 these arguments are largely over. Unemployment is low and stable, job growth is strong and moderating, and wage pressures are reducing income inequality, but are not exhibiting the long-term imbalances that can sustain inflation.
There are still pressures in the labor market, of course, but these are much more long term and amenable to good policy. Older workers are less likely to be in the labor market than before the COVID-19 pandemic, for example, but this may represent a return to normal after this demographic drove much of the job growth pre-pandemic. Policy changes that discourage age discrimination can help bring more of these workers back into the labor market if this is a key source of inflation.
U.S. monetary policy
At the beginning of 2022, the only questions facing U.S. monetary policymakers were when to tighten monetary policy, and by how much. With multiple mini-cycles of inflation now easing in the rear view mirror, the Fed’s aggressive—and arguably predictable—catchup strategy of getting behind, and then ahead of, inflation has dramatically changed the forces monetary policies are exerting on inflation. After a decade of undershooting its inflation target, the Fed followed a playbook of waiting for inflationary pressure to emerge beyond expectations in 2022.
In 2023, the Fed is largely past the challenges of fighting inflation out of a liquidity trap, and yet continues to attack inflation from above with traditional monetary policy. There remains some risk since this strategy could call for rate cuts to preserve a stable economy later in 2023, but by waiting to act in early 2022 the Fed has given itself room to make course-correcting rate cuts if needed. While an inverted yield curve is often pointed to as a sign of impending economic weakness, in 2023 it also is a sign of monetary policy returning to a more balanced stance after catchup rate hikes.
Federal Reserve communications
The Fed spent early 2022 being dismissive of inflationary pressures. In 2023, the opposite is the case. Even amid credit tightening after a bout of instability in parts of the banking sector this past February, the Fed remains extremely hawkish in its communications. To some extent this may represent posturing—certainly markets are pricing in that the Fed cannot remain as hawkish as it sounds right now. But to the extent that the 2022 economic narrative was driven by economic commentary opposed to the Fed’s moderate tone on inflation, the 2023 economic narrative is likely to be driven by economic commentary pointing to both the Fed being too soft on inflation on the one hand, and the Fed being too aggressive on inflation on the other.
This is not ideal for the Fed in the short term. Excess inflation will give some commentators claims to credibility, while a growth shortfall will give credibility to others. But in the long term this represents the Fed doing its job on forward guidance. At some point Fed communications will become less hawkish, but part of the Fed’s strategy calling for delayed, aggressive pivots in monetary strategy requires the same pivots in communications. That means Fed guidance is likely to push against inflation in 2023, even beyond the point where it suggests the Fed will create excessive economic headwinds.
Supply-chain bottlenecks
Supply-chain bottlenecks were a clear source of inflationary pressure in 2022, and while they remain an issue in 2023, the bottlenecks the U.S. economy is currently experiencing are less indicative of inflationary pressures than policy opportunities. Take the auto industry. In much of the expansion and recovery from the COVID-19 recession, the auto sector was a major brake on economic growth and a contributor to inflation. While in general consumer spending on cars and trucks is a large source of demand in the U.S. economy, as well as a significant source of tax revenue for local governments, the auto industry amplified economic challenges for most of the expansion due to a series of supply-chain issues.
Most notable in 2022 were supply-chain issues involving chips and ports, but in 2023 and beyond the bottlenecks facing the auto industry involve batteries, lithium and electric charging stations. The pivot recognizes economic success in mitigating temporary supply chain pressures, but there also is a need to address the long-term growth challenges facing automakers over the next decade of energy transition. This is not the end of inflationary pressures, but if lower interest rates were expanding demand last year, then a combination of federal policy and relatively modest interest rates are now expanding supply in 2023 and beyond in the auto sector.
Supply-chain bottlenecks are not over. The uneven and rapid U.S. economic recovery is still creating lots of mismatches in the economy—especially in globalized sectors where the U.S. recovery has outpaced much of the world. Imports are still subject to backlogs, and an aging U.S. population and years of uncompetitive wages have left some service-sector providers flat-footed in the face of healthy demand. But on balance, supply pressures are likely to bring down inflation in 2023—and to the extent they do not, these supply pressures are contributing to investments in various sectors across the economy over the next decade that will help strengthen growth.
Housing market and commercial real estate
While the pressures of remote work on housing and office markets will continue in 2023 and beyond, its inflationary dynamics are not likely to remain the same for the foreseeable future. That is, in the first few years of the pandemic remote work caused considerable pressure on housing markets by driving up rents, but the next few years are likely to show offsetting pressures in the commercial real estate and residential housing markets. Initial fears that rising interest rates would curtail housing development are overblown, at least so far. To be sure, as the recent crisis in the banking sector demonstrates, the pressures imposed by significantly higher interest rates are not yet fully understood, but the U.S. housing market is proving resilient.
So far these higher rates seem to be most acutely felt in the commercial office sector where prices softened as vacancy rates continue to tick higher. As rents and property values find lower market levels consistent with increased remote work and relatively higher interest rates, there will be knock-on effects for property developers, state and local governments, and many portions of the financial sector, particularly those with heavy exposure to commercial real estate.
Yet the balance of these effects is far from clear yet. There is a lot of commercial real estate debt, and a lot of uncertainties of the implications of that debt. Leases continued to roll off throughout 2022, but not at sufficient levels to create major pressure on the sector. Yet the combination of higher rates and shrinking corporate office footprints has put new pressure on the sector, and is uncovering additional dependencies in the financial system.
Simply put, the value of commercial real estate is the collateral for many other parts of the financial and the real economy. How this effects the real U.S. economy remains to be seen.
State and local government spending
State and Local governments were a surprising drag on the labor market in 2022. The sector was slow to recover in spite of a large infusion of federal aid to prevent the kinds of underinvestment in the public sector that held back growth in the previous U.S. economic recovery, which also contributed to worsening inequality. Overall, state and local governments were contributing to growth in 2022, albeit at much more modest levels than the rest of the economy.
In 2023, a more balanced U.S. labor market and the end of federal aid reversed both dynamics. State and local governments are no longer the drag on hiring they were for most of 2021 and 2022, but revenue uncertainty leaves state and local budgets reining in growth and inflation in the short run. There will be additional fiscal pressure not just in the form of federal budget spending restraints, but also from state and local governments, particularly those which depend on property tax revenues from commercial offices. Higher vacancy rates and reduced assessed values are prompting many localities to budget conservatively to prevent being overextended if revenues from downtowns don’t come back.
Conclusion
The U.S. economic picture in 2023 is very different than in 2022, especially with respect to inflation, yet the most consistent feature is a strong juxtaposition of aggressively anti-inflationary short-term, demand-side policies and smart long-term anti-inflationary, supply-side policies. Increased investment from the public and private sector is crucial to lower prices in the long term and creates the building blocks for stronger, more sustainable economic growth. Many of the same policies that make sense to rein in inflation in the short term are in tension with these long-term objectives.
Those objectives do not negate the need to bring inflation under control. Rather, it points to the need to take financial markets’ consistent belief that the U.S. economy is experiencing a short-term run up in prices seriously, while also laying the groundwork for the long-term investments that will reduce inflationary pressures and promote growth to allow the Fed to conduct sound monetary policy in the future without being constrained by low interest rates or liquidity traps.
On April 7, the U.S. Bureau of Labor Statistics released new data on the U.S. labor market during the month of March. Below are five graphs compiled by Equitable Growth staff highlighting important trends in the data.
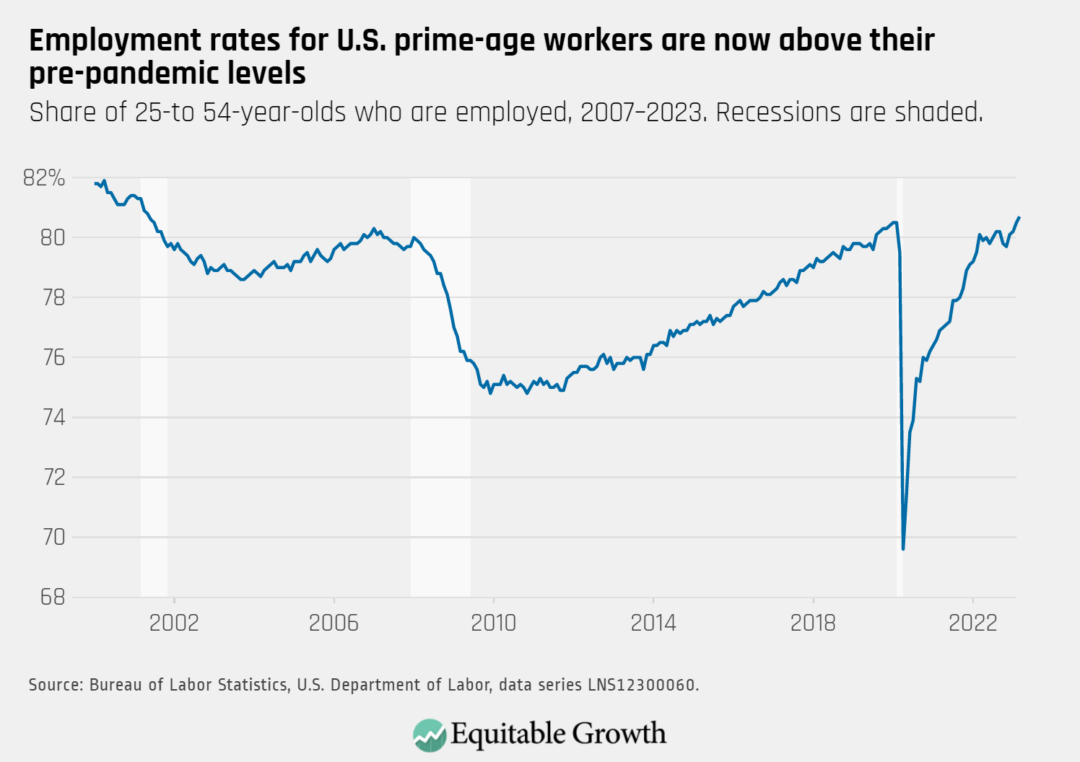
The employment rate for prime-age workers increased from 80.5 percent in February to 80.7 percent in March as total nonfarm employment rose by 236,000.
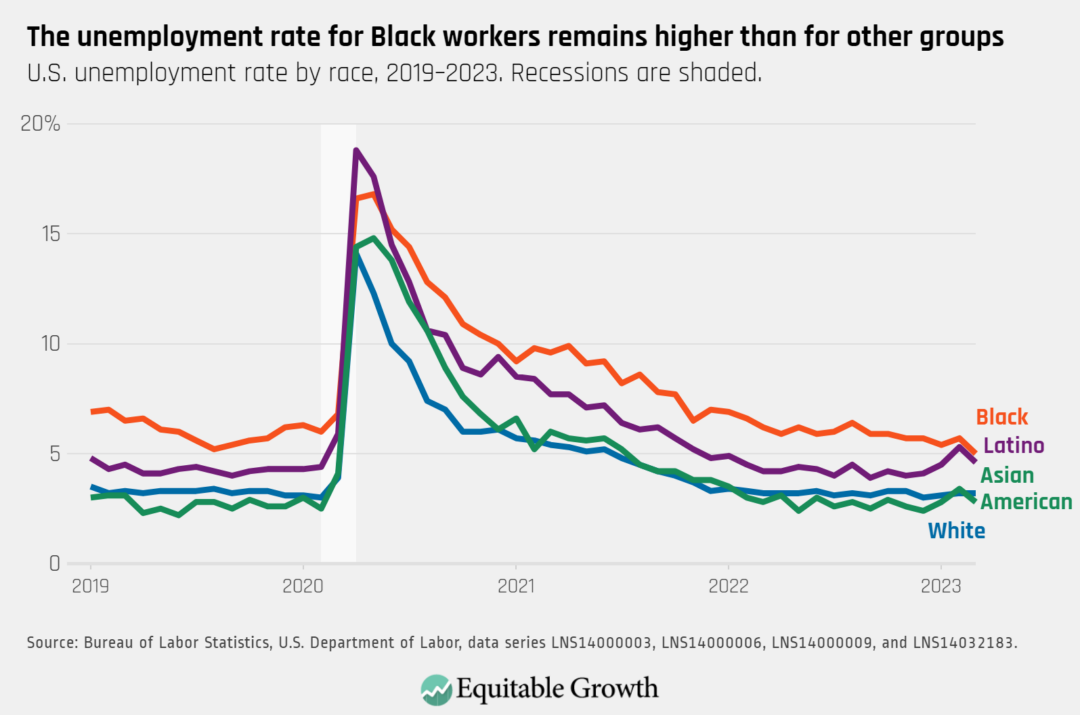
The unemployment rate declined slightly to 3.5 percent in March, and remains high for Black workers (5.0 percent) and Hispanic workers (4.6 percent) compared to White workers (3.2 percent) and Asian American workers (2.8 percent).
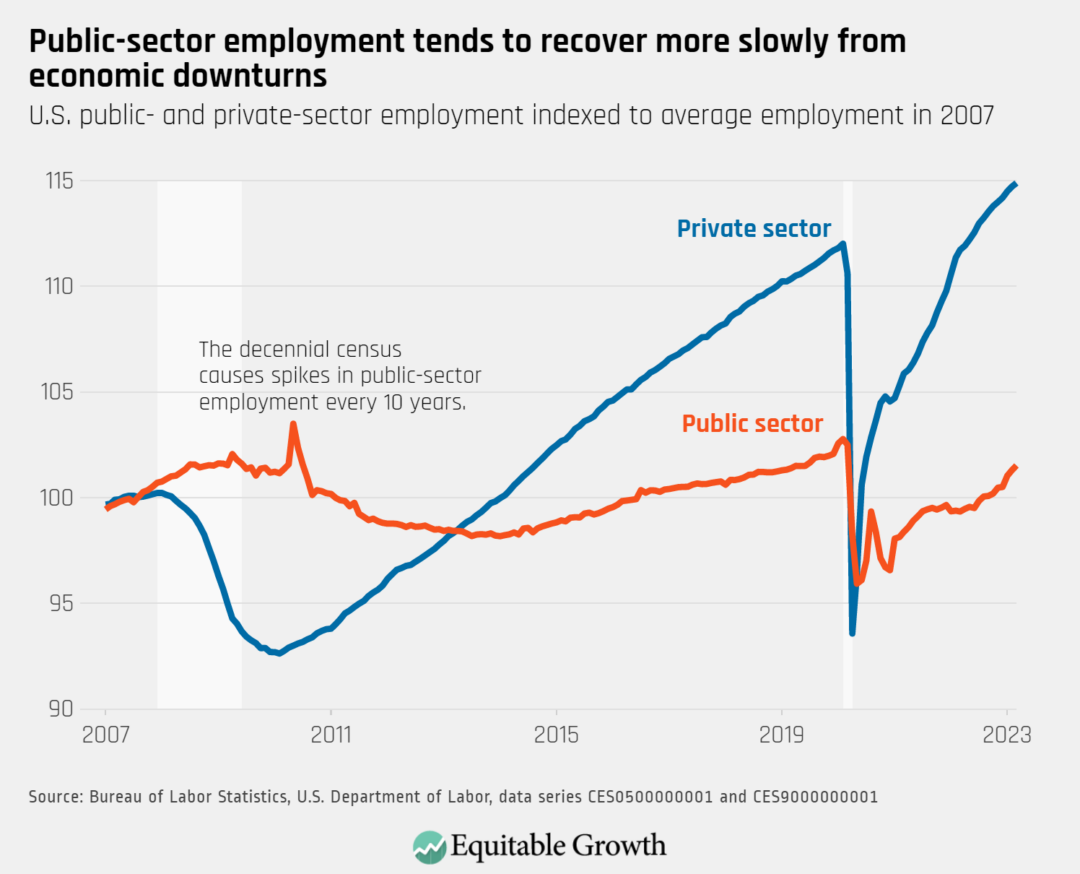
Both public-sector and private-sector employment rose in March, though public-sector employment has recovered more slowly and remains below pre-pandemic levels.
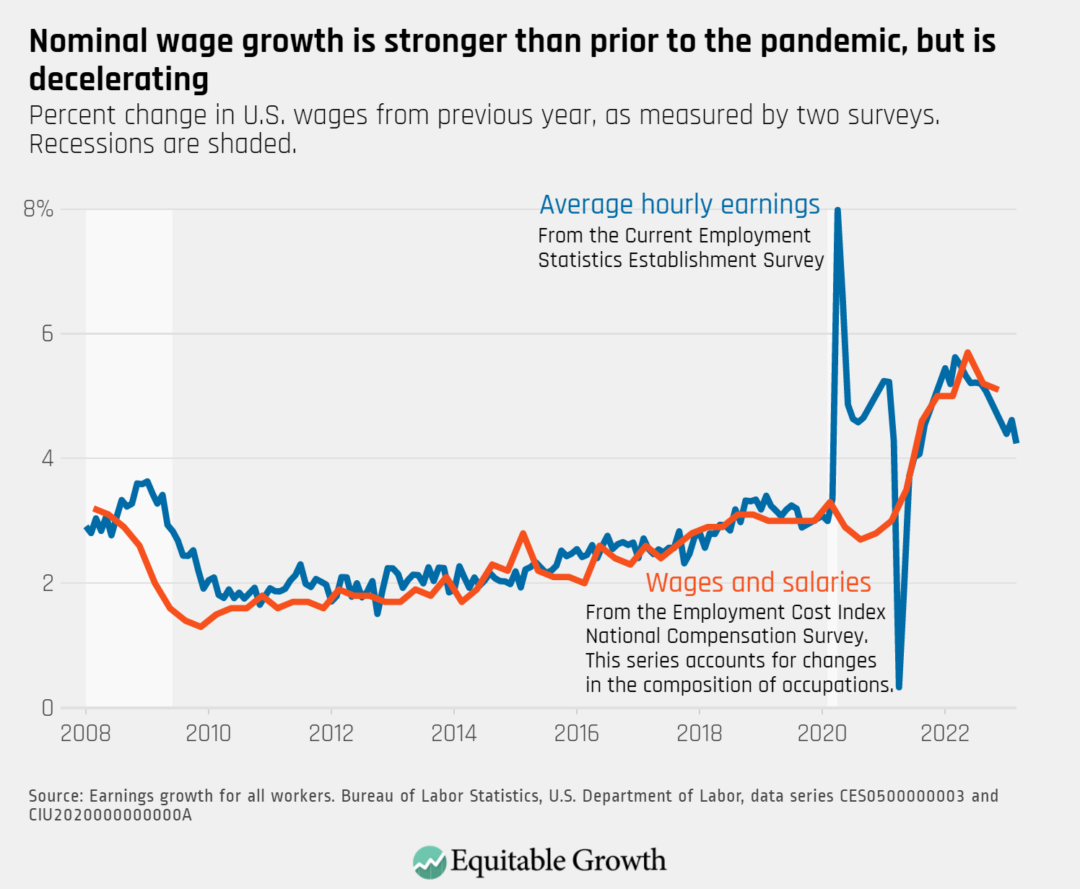
Nominal wage growth (not accounting for inflation) declined in March, with average hourly earnings growth at 4.2 percent over the past 12 months, down from 4.6 percent in February.
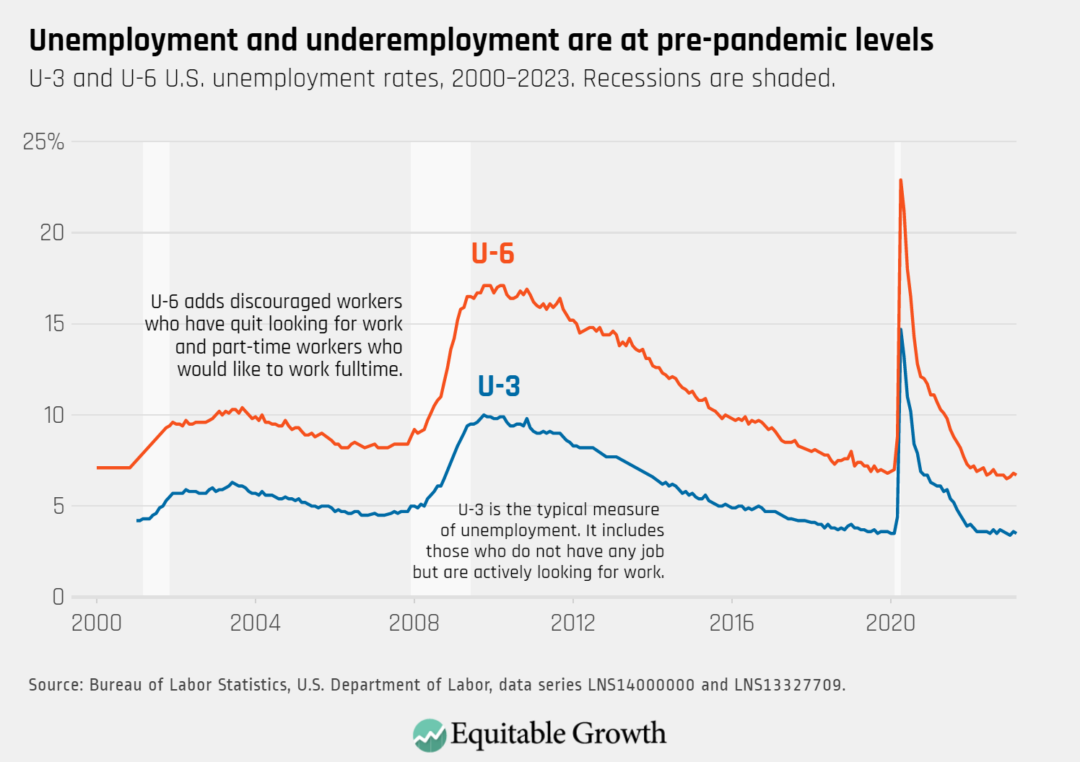
Top-line unemployment (known as U-3) and a broader measure of labor underutilization (known as U-6) declined slightly in March, as both overall unemployment and underemployment are around pre-pandemic levels.
In spite of recent bank turmoil in the United States and abroad, reining in inflation remains very much at the top of the macroeconomic agenda for policymakers in advanced economies in the first half of 2023. In the United States, the Federal Reserve is especially focused on its price-stability mandate, certainly ahead of its maximum-employment mandate, and potentially in the face of financial instability.
The Fed’s attention to price stability raises typically arcane questions about how changes in prices are measured, as well as more direct questions related to policy. Measuring inflation imposes several challenges under ordinary circumstances. But the unusual nature of the COVID-19 recession in 2020 and subsequently strong economic recovery reveals even more challenges as researchers and policymakers at the Fed work to identify causes of inflation to date, forecast future inflation, and learn how the two are linked. Critically, controlling future inflation requires understanding how people form expectations about future prices, a process that is much messier than assumptions built into many macroeconomic models.
With inflation declining from peaks in mid 2022, these tradeoffs in measuring inflation are an important policy focus in 2023 and beyond, especially as the Fed moves toward more moderate interest rate hikes, and as economic policy more broadly adapts to temporary and structural shifts set in motion since 2020. Newer research into how inflationary expectations are formed, as well as changes in how workers operate in the U.S. labor market, suggest that gains from a focus beyond traditional inflation gauges, such as the Consumer Price Index and the Personal Consumption Expenditure metric, both of which are workhorse inflation gauges for policymakers and the public.
In particular, the rise in remote work over the past three years is blurring lines between expenditures by consumers and firms, and presents a singular challenge to the efficacy of many existing inflation measures. In this column, I will present key benefits and drawbacks of both traditional measures of inflation and other measures that capture better the changing face of inflation in the U.S. economy since the onset of the COVID-19 pandemic in 2020. Understanding what certain measures do and do not suggest, and which measures line up with which policy goals, is critical for policymakers and researchers as they face the challenges of dealing with today’s economy.
Measuring inflation is hard, and the pandemic made it harder
The concept of inflation is intuitively simple, but measuring inflation in practice is challenging on both a practical and theoretical level. Unlike many microeconomic measures, where revealed preferences allow for straightforward observations, inflation conceptually requires more than just a snapshot of observable behavior. If the price of bread increases so much that nobody buys bread at that price, for example, then how should this be reflected in official statistics? Other challenges are less philosophical but no less trivial, which is one reason there are many different inflation measures.
The ways that consumers change their purchasing patterns as prices change, or what is referred to as substitution, is a crucial question for inflation measurement with multiple valid answers. The two most used inflation gauges, the CPI and PCE measures, are constructed using much of the same data, but notoriously differ due to scope, weighting, and formula effects—in part reflecting differing approaches to modeling substitution patterns.
Before adopting a specific measure of inflation, it’s crucial to first consider what the information will be used for. For instance, core measures of inflation exist to remove volatility from food and energy prices that can create noise in inflation readings. But there is a tradeoff—smoother readings can help U.S. policymakers focus on the durable trends policy can affect, but can conceal the strains that workers feel from rising food and energy prices. One case in point: while policymakers might focus on core inflation to guide future economic policy, Social Security benefits are indexed to all prices, because retirees can’t ignore food and energy prices.
The Fed’s stated goal of maintaining well-anchored inflationary expectations points to the importance of using a measure that affects these expectations, especially when different inflation measures diverge. When expectations are well-anchored, people and financial markets are confident that future inflation will be close to target in the long run, regardless of developments in the short run. Core consumer price indexes have been historically important for allowing policymakers to look through supply-side disruptions that policy can amplify rather than stabilize.
The introduction of inflation-protected U.S. government bonds in 1997 (the value of the bonds is indexed to CPI) generates market-based measures of CPI inflation expectations. While these can measure expectations over CPI inflation, it is much harder to show that those expectations are driven by CPI data or any specific price indexes. Indeed, empirical work finds consumers’ inflation expectations are quite sensitive to things such as gas prices, in tension with the hyper-rational expectations-setting behavior used in many macroeconomic models.
Consumer price and wage inflation measures face a number of challenges amid the current economic recovery
Consumer price-based inflation indexes, in contrast to producer price-based indexes, are still the standard, for a variety of reasons beyond simple consistency. First, consumption makes up more than half of U.S. Gross Domestic Product, and consumption is the least volatile component of GDP, so the two consumer price-based inflation measures, CPI and PCE, are more stable over time.
Typically, the Fed focuses on personal consumption expenditure inflation, which covers about 2/3rds of the U.S. economy and is less volatile than alternative measures. And past research suggests that wage pressures are driven by consumers’ price expectations, while in simple models with perfect competition consumer expectations are necessary to drive a wage-price spiral. Yet recent research on monopsony consistently demonstrates there is imperfect competition in the U.S. labor market.
Among certain policymakers at the Fed and researchers more broadly there is concern over wage inflation, rather than price inflation. In part because other inflation gauges have been more noisy amid the continuing economic recovery, a way to focus on whether wages are driving prices higher offers another measure of price stability—especially in service industries. Yet there are issues with these measures as well. High frequency measurements are problematic because they average wages across industries so ‘average earnings’ often reflect which industries are hiring and firing more than wage changes.
The quarterly Employment Cost Index compiled by the U.S. Bureau of Labor Statistics controls for hiring composition quite well. ECI wage growth has been robust in the current recovery, but has stabilized. And after decades of corporate profits growing to a much larger share of the U.S. economy—well above historic averages—there is significant room for wages to grow faster than prices in the medium term if the result is workers’ incomes return to historically normal shares of output.
Spending shifts or inflationary pressure
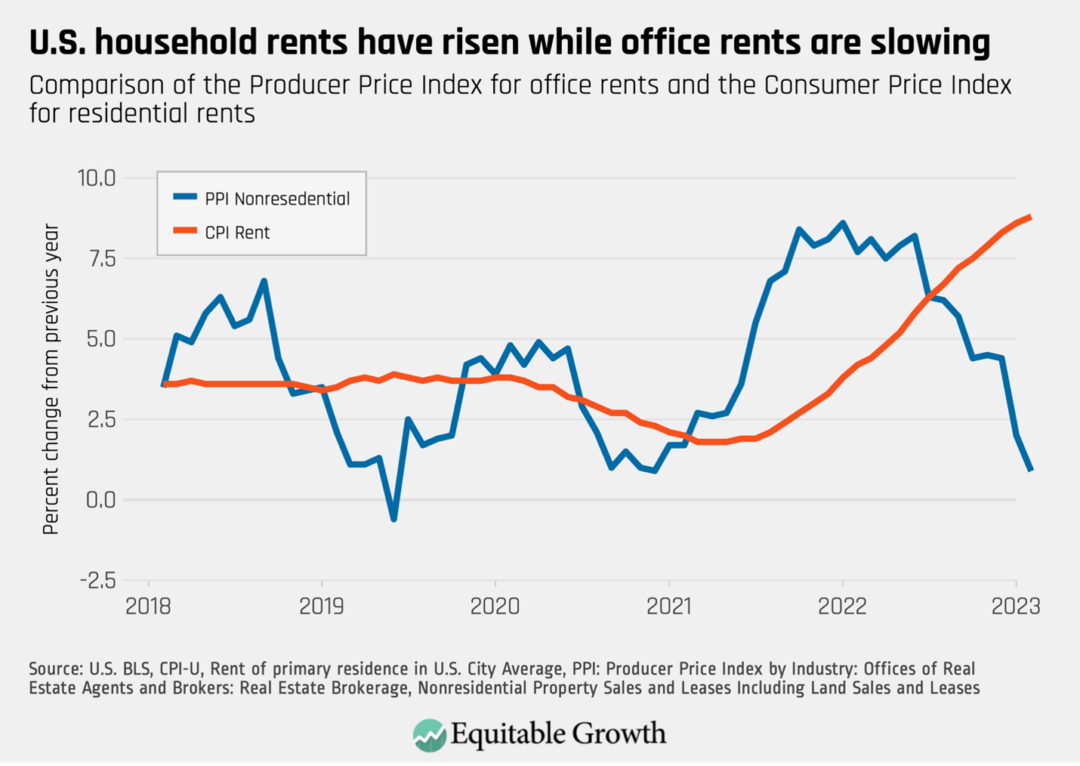
In today’s economy, measuring consumer inflation is confounded by how the pandemic reoriented the economy; many producer and consumer expenditures now blend. As researchers focus on the role that housing cost measurement plays in inflation, remote work complicates the use of consumer housing and rental inflation measures. Consumer rents have risen in part due to demand for home offices, but consumer prices show the effects of this increased demand while excluding offsetting declines that are weighing heavily on the commercial real estate sector. This unbalanced picture of price pressures can skew inflation measurements and perceptions of capacity constraints in an economy, presenting new challenges to well-established, standardized inflation taxonomy. (See Figure 1.)
Figure 1
Beyond consumer measures, there are broader measures of price pressures that are less sensitive to classification and can better capture shifts like this. The GDP deflator and GDP price index are more inclusive of all sectors of domestic consumption, and alleviate some concerns with substitution across categories, though neither is perfect. Because these measures come out quarterly, they don’t provide policymakers with real-time information about the U.S. economy.
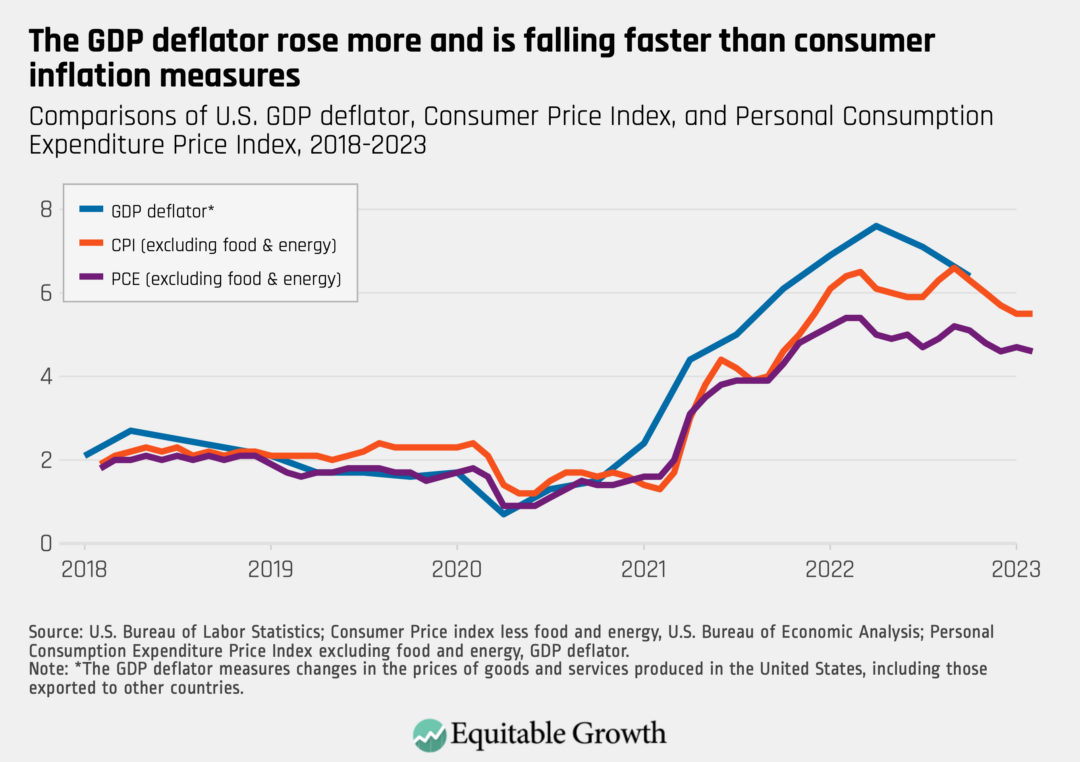
Similarly, they also are less likely to affect the inflationary expectations of consumers and firms because they are less widely covered by media outlets and the Federal Reserve. Because the GDP deflator includes firm prices that are more volatile, it shows higher inflation earlier in the pandemic, but it also has decelerated faster and farther than consumer measures. This economy-wide measure of inflation is more volatile, but also shows that demand outstripping supply may be less of a driver of current inflation than consumer prices suggest. (See Figure 2.)
Figure 2
To be sure, there are a number of reasons to focus on consumer prices—social security benefits, tax brackets, and TIPS bonds are all adjusted for inflation using various consumer price indexes. Consumer inflation expectations are extremely important for inflation expectations, especially in wage-setting activity between workers and firms. But this is not an ironclad relationship, with recent research suggesting that consumer price inflation may not be the most predictive measure of consumer inflation expectations. Gas prices have low predictive power over future inflation, for example, but play a very large role in consumer inflation expectations.
Measuring expected inflation
A key challenge in measuring inflation is that regardless of how policymakers track inflation, firms’ and households’ expectations of future inflation are arguably more significant for the economy. In fact, the level of inflation is far less consequential in economic models than the current debate might suggest, but expected inflation can be extremely important for real economic variables. Inflation expectations, factor into interest rates, pricing decisions, and a host of variables that affect the real economy.
Because these inflation expectations are a first-order concern, there can be reasons to focus on a particular price index if the measured inflation reported by that index is influential by itself. If households’ expectations are the main determinant of expected inflation, for example, then measures of consumer prices could offer a significant benefit if these prices, which consumers see in stores often, are unusually influential over households’ beliefs.
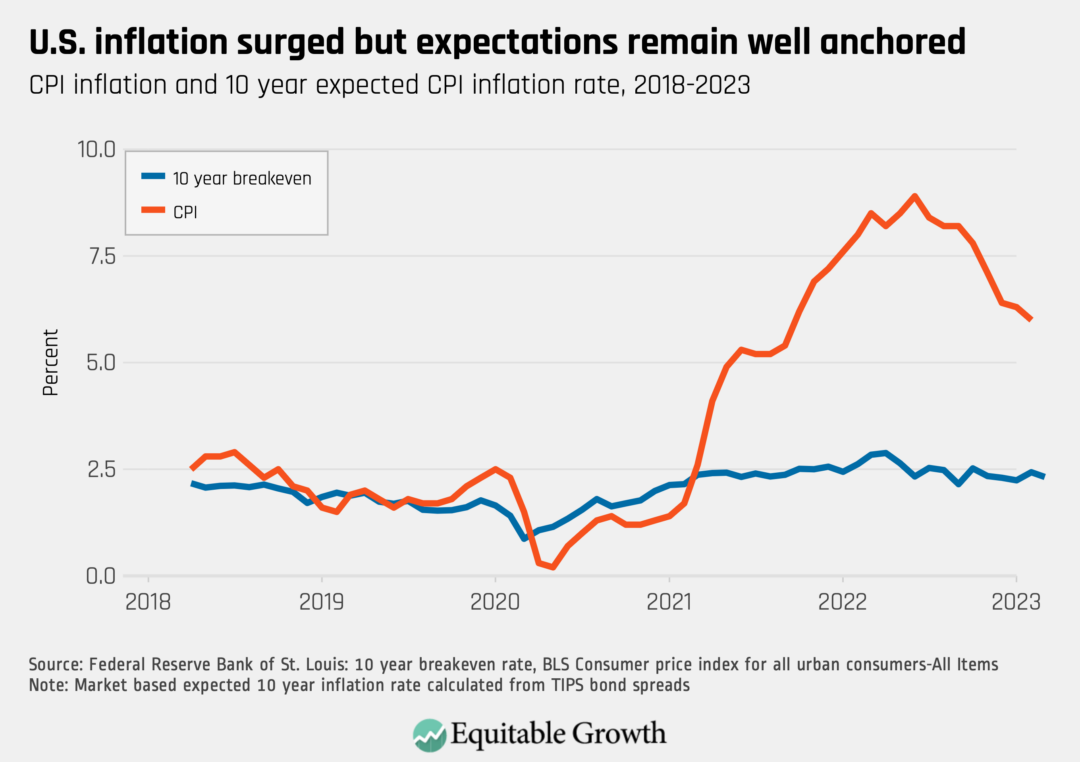
Economywide inflation expectations are not hypothetical and can be measured by comparing interest rates on standard government bonds with inflation-indexed bonds. Yet expected inflation has remained well-anchored through the post pandemic inflation surge, suggesting that the credible commitment by the Federal Reserve to return to its 2 percent target is more influential than medium-term movements in any particular price index. (See Figure 3.)
Figure 3
Conclusion
More research is clearly needed to understand the best measures of inflation to inform macro models, especially as the U.S. economy continues to respond to structural changes. There is a need for both an accurate understanding of capacity constraints in the economy, and a consistent measure of changes in inflationary expectations—and these may not be well captured by any one measure, let alone the measures traditionally used. For U.S. policymakers, the challenge is twofold. They need to calm inflationary expectations on the one hand, even if expectations are not based on a full understanding of what may persistently drive future inflation, while also preserving the health of the economy itself on the other. Balancing these needs will also require reexamining old assumptions.
Measuring inflation is hard. Official statistics are very good at measuring inflation, but how to use those measures is more tricky because it is conceptually difficult and context dependent. The COVID pandemic makes the application of go-to inflation measures even more challenging as it created unprecedented shifts in spending across sectors, leading to shifts appearing as increases or decreases in major components of primary inflation measures.
An additional challenge: Whether these measurements are conceptually correct may not be the end of the story because expectations themselves matter so much for policymaking. Inflation expectations remain well-anchored even after 2 years of inflation levels well above the Fed’s target range of 2 percent, and amid sensational financial and economic reporting on every inflationary pressure in the U.S. economy.
Consumers’ outsized focus on gas prices, for example, suggests that the Biden administration’s use of the U.S. Strategic Petroleum Reserve to manage gas prices and the subsequent decline in oil prices may be playing a role in broadly held expectations that inflation will moderate over the next few years. Other administrative actions or fiscal policy moves such as this also could help lower inflation expectations.
Inflation accelerated out of the pandemic, cooled significantly, then accelerated again as COVID variants emerged. The Fed was hamstrung by a decade of slow growth, but followed the research on monetary policy in a liquidity trap. Inflation has moderated considerably, but the inflation story going forward will require more careful attention to inflation measures, including some that don’t typically make news.
Every month the U.S. Bureau of Labor Statistics releases data on hiring, firing, and other labor market flows from the Job Openings and Labor Turnover Survey, better known as JOLTS. Today, the BLS released the latest data for February 2023. This report doesn’t get as much attention as the monthly Employment Situation Report, but it contains useful information about the state of the U.S. labor market. Below are a few key graphs using data from the report.
The quits rate rose slightly in February to 2.6 percent as 4.0 million workers quit their jobs, an increase of 146,000 since January.
As job openings declined to 9.9 million and hires remained near 6.2 million, the vacancy yield increased to 0.62 in February from 0.60 in January.
The ratio of unemployed workers to job openings rose to almost 0.60 in February from just under 0.54 in January.
The Beveridge Curve moved downward and to the right in February, as the unemployment rate ticked up to 3.6 percent and the rate of job openings fell to 6.0 percent.
The overall number of reported job openings decreased by 632,000 in February. Openings fell in industries such as education & health services, leisure & hospitality, and manufacturing, but rose in construction.