Executive actions to strengthen unions and increase worker power in the United States

""

Overview

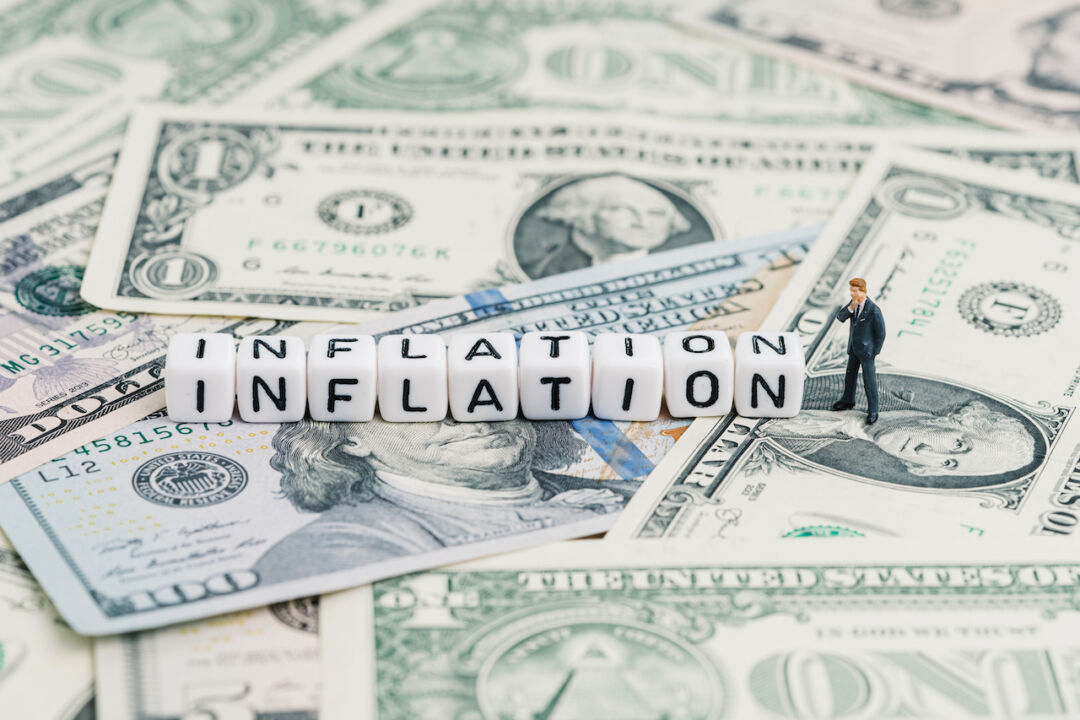
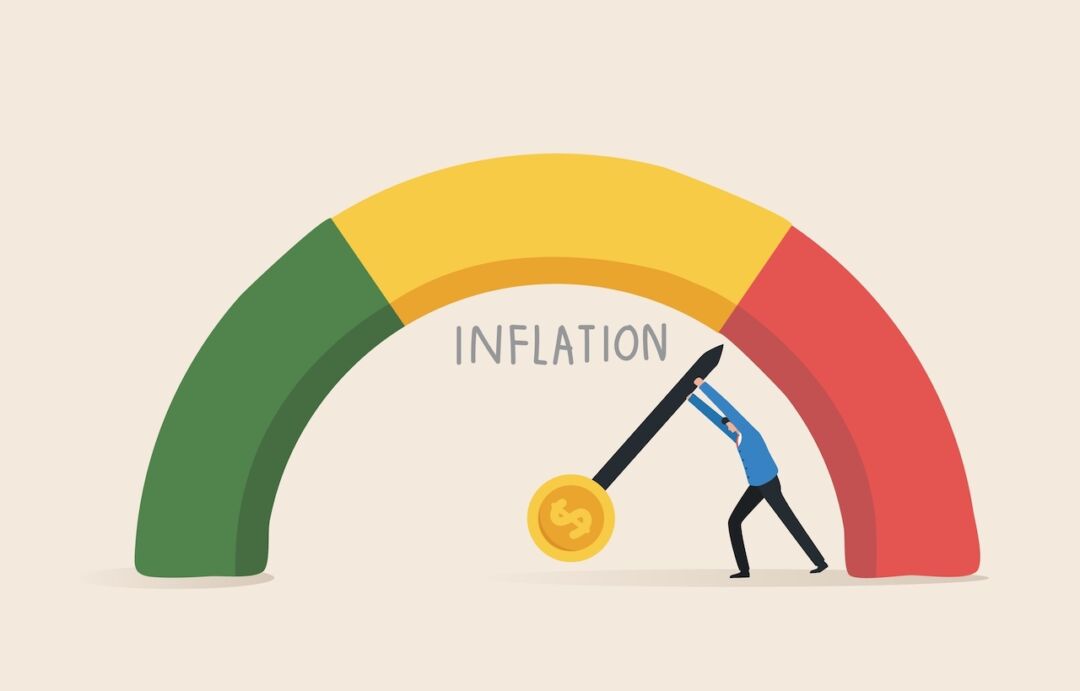
In recent decades, wage stagnation and increasing income inequality have plagued the U.S. labor market. U.S. workers experience persistent racial and gender disparities in economic outcomes. These trends largely continued even during the tight labor market immediately prior to the onset of the COVID-19 pandemic in 2020.

Declining worker power and the diminished capacity of the federal government and its state and local counterparts to enforce existing labor market protections contribute to these long-term trends. Wage theft, or when employers pay their workers less than what’s required by law, is just one phenomenon that feeds into these outcomes. The odds that a low-wage worker will be illegally paid less than the minimum wage ranges from 10 percent to 22 percent, with each violation costing that worker an average of 20 percent of the pay they deserve. Women, people of color, and noncitizens are especially vulnerable to wage theft.

Research finds that employers have little incentive to comply with the Fair Labor Standards Act, which established the federal minimum wage, and the National Labor Relations Act, which protects the right to unionize, under current enforcement regimes.

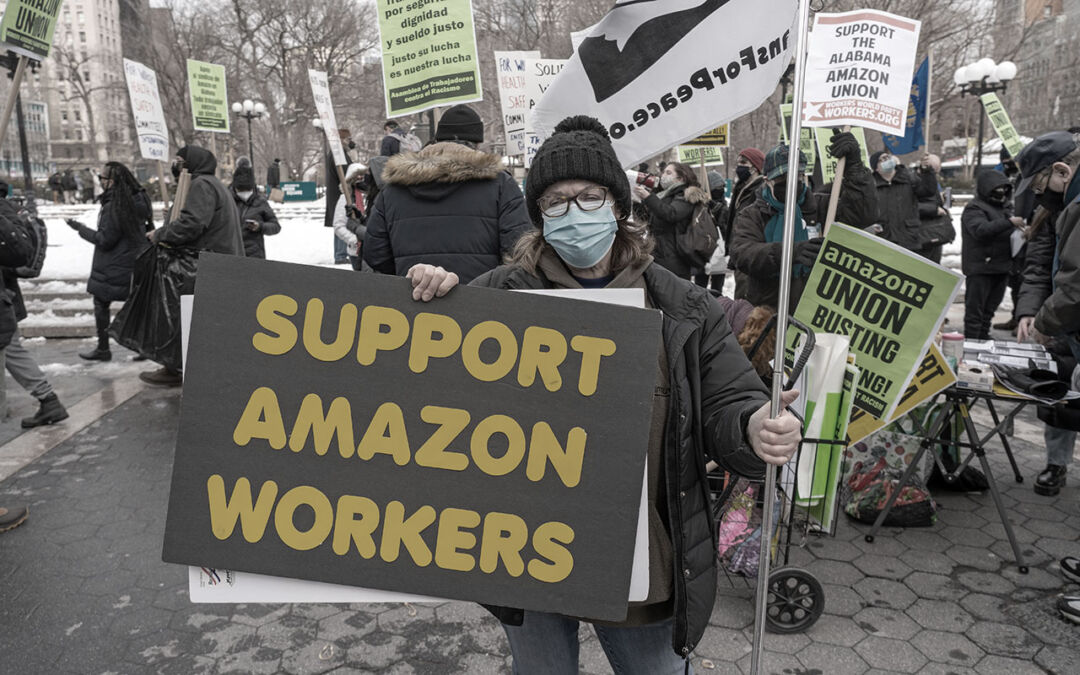
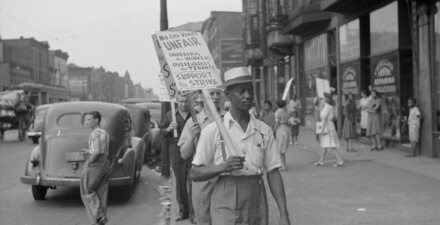
Fortunately, U.S. workers are increasingly displaying an increasing interest in unionization, despite rising attempts by employers to bust unions and delegitimize their status. From high-profile organizing efforts at Starbucks Corp. and Amazon.com Inc. to smaller businesses and various professions, union activity is on the rise in the United States. With 71 percent of U.S. public support, unions are at their highest approval rating since 1965.

Unions are essential to boosting U.S. worker power and decreasing wage stagnation and income inequality. Studies show that through collective bargaining, unions provide benefits such as increasing the likelihood of access to employer-sponsored health insurance and paid leave, as well as helping determine how new technologies are implemented in the workplace. Union workers also tend to have higher wages than otherwise-similar nonunion workers, thanks to the “union wage premium.”

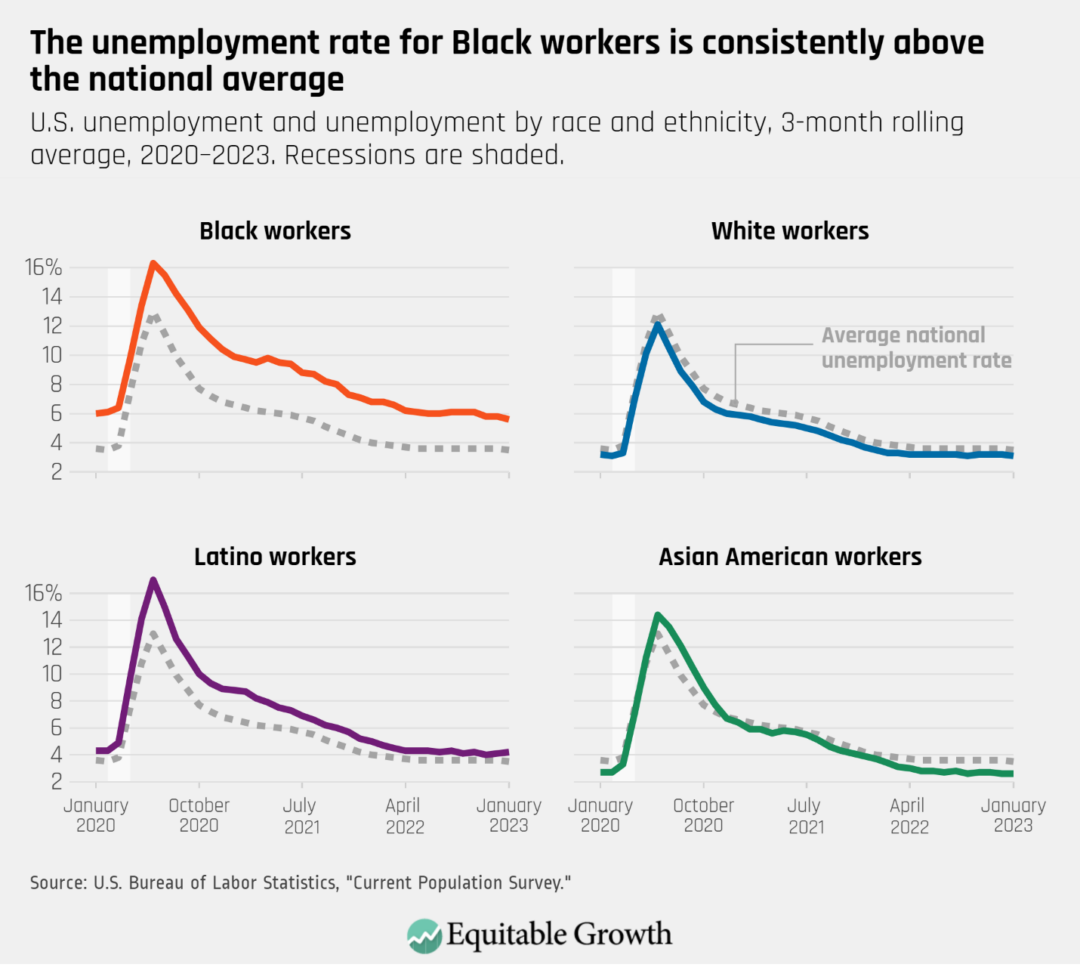
Additionally, unions provide spillover benefits to workers, such as better education on rights in the workplace and a decreased risk of employer retaliation for organizing or joining a union. Union members also more successfully apply for Unemployment Insurance after involuntarily losing a job, experience better protection against wage theft and decreased levels of sexual harassment, and report improved health and safety and reduced violations of other U.S. labor regulations. All union members benefit from these gains, but they are especially large for Black and Latino unionized workers. This is, in part, due to a reduction in workplace discrimination that otherwise unfairly maintains wage disparities between Black and Latino workers and their White peers. 

While unions can do a lot to improve U.S. workplaces, the Biden administration can also provide more institutional support to increase U.S. worker power. President Joe Biden has already taken some steps in the right direction—for example, by signing an executive order establishing a taskforce on worker organizing and empowerment and launching a resource center through the U.S. Department of Labor for workers who want to organize. Yet more can still be done. Below are some executive actions the Biden administration can take, all of which stand to boost wages, increase worker power, and help decrease income inequality.  

Improve the strategic enforcement of labor standards at all levels of government and institutionalize enforcement within the U.S. Department of Labor

Instead of relying on complaint-based enforcement of labor standards, agencies such as the U.S. Department of Labor should institute strategic enforcement to increase the real and perceived costs of violations. As outlined by David Weil of Brandeis University, strategic enforcement includes a range of actions: targeting industries high in violations but low in complaints, proactively investigating targeted industries, maximizing penalties for violators, launching information campaigns, and instituting robust compliance agreements. Janice Fine, Jenn Round, and Hana Shepherd, all of Rutgers University, and Northwestern University’s Daniel Galvin also outline how a triage system can supplement strategic enforcement by maximizing statutory tools to disincentivize the obfuscation of noncompliance and by assessing large penalties to deter future violations.  

Strategic enforcement also can be applied at the state and local levels. State and local labor enforcement agencies operate in vastly different political climates than federal enforcement agencies, and each have their own variety of powers and limitations. Prioritizing state and local strategic enforcement would not only give states the opportunity to go above and beyond what the U.S. Department of Labor can do and experiment with different tactics and methods, but also allow for the avoidance of one-size-fits-all solutions. The U.S. Department of Labor can provide guidance to state and local labor departments on how to best use strategic enforcement, allowing for maximum impact despite federal budgetary and bureaucratic limitations.

A key component to this strategy is co-enforcement, or sustained partnerships with worker centers, unions, legal advocacy organizations, and other community-based groups that are embedded in low-wage worker communities and high-violation sectors of the U.S. economy. These organizations provide an important connection to workers for labor law enforcers and often have access to information on compliance with labor standards that would be difficult for state and local or federal officials to gather on their own. They also can continue to monitor employers over time after inspectors have moved on to new cases. State and local labor enforcers are likely to have better connections to these groups than federal enforcers, making them a key facet in ensuring successful strategic enforcement.

Finally, the U.S. Department of Labor should institutionalize its enforcement directives within its Wage and Hour Division to ensure more consistent and even application from one presidential administration to the next. This would prevent large swings in policy every 4 or 8 years, provide more stability to employees and employers, and allow for better and more concrete planning among stakeholders. While this action could also limit positive developments, instituting a more concrete floor of enforcement would provide a demonstrable benefit to U.S. workers.  

Require a labor cost analysis from contractors who submit bids for federal contracts

When it comes to competing for federal contracts, contractors often find themselves in a race to the bottom to provide the least expensive services to the federal government. While this ostensibly saves the government money, those cheap prices come at a cost. The biggest driver of a contractor’s costs is labor. So, when contractors skimp on the price, it’s their workers who often bear the burden.

During the Great Recession of 2007–2009 and the 8 years following it, more than 300,000 workers on federal contracts were victims of wage-related labor violations. Research shows that many contractors who are penalized for wage and/or health and safety violations also have contract performance issues such as cost overruns, falsifying legal compliance, and fraudulent billing practices. Due to occupational segregation and systemic bias, the lowest bids disproportionately harm workers of color and women workers, both of whom are disproportionately employed in low-pay and high-risk industries.

The Biden administration should implement an executive order requiring contractors to include a labor cost analysis when bidding on a federal contract. This would require contractors to submit staffing plans in their solicitations, thereby committing contractors to paying proposed wage rates. Such an executive order also would allow the government to audit and evaluate wage information in proposals for successor contracts.

This would essentially force contractors to either self-report their wage violations or comply with good-faith actors who also are competing for the same contract. As such, a labor cost analysis can serve as a powerful tool to help boost wages among those who are most at risk of having their wages stolen.

Allow unions better access to worksites

When it comes to helping organize workers, one big issue that unions and their representatives face is reaching workers at their worksites. One part of the broader suite of legal and illegal tactics that U.S. employers use to discourage unionization is preventing unions from accessing their worksite at all, even if union members only talk to employees during nonworking hours and in nonworking areas such as breakrooms and cafeterias.

President Biden should issue a presidential memorandum directing federal agencies to develop plans that would allow representatives of unions and appropriate nonprofit organizations to gain access to nonworking areas of worksites for the purpose of communicating with workers employed by federal contractors during nonworking time. This action would help union representatives counter the systemic advantage that employers have when it comes to implementing union-busting tactics. Something as simple as allowing union access to worksites could help boost union organizing and membership and make workers aware of their rights in the workplace, which would in turn provide other benefits that come from unionization to both unionized and nonunionized employees.

Summary of Equitable Growth’s March ‘Econ 101’ briefing on inflation for Capitol Hill staffers

""

The Washington Center for Equitable Growth hosted a briefing earlier this month—part of a series we call “Econ 101”—presenting the key points on inflation to congressional staffers in both the U.S. House of Representatives and the U.S. Senate. During the presentation, Michael Madowitz, director of macroeconomic policy at Equitable Growth, broadly discussed what inflation is, how it is measured, where things currently stand with inflation and what the future may look like, and how public policies can help reduce inflation.

The “Econ 101” presentation came before the collapse and takeover of U.S. regional financial institutions Silicon Valley Bank and Signature Bank and the forced acquisition of embattled Credit Suisse by its larger rival UBS Group AG, as well as before the March 21–22 meeting of the Federal Reserve’s Open Market Committee, during which the Fed increased interest rates by 25 basis points.

The March 3 briefing on Capitol Hill by Madowitz, however, did presage the fundamental monetary policy choices the Fed has to make and the broad economic conditions with which it must grapple. The presentation also included his observations in his most recent column on “Inflation, Federal Reserve policymaking, and liquidity traps.”

With a topic as complex as inflation, it seems as though everyone has a different explanation of how the inflation rate increased to more than 6 percent and what may happen in the future—along with a variety of data to support their arguments and further their particular narratives. Among this sea of differing opinions, Madowitz helped congressional staffers make sense of some of the basic inflation trends leading into 2023 and those likely to drive the narrative going forward.

To learn more about inflation, you can find the presentation slides from the March 3 congressional briefing here.  

Posted in Uncategorized

Executive actions to modernize federal data collection and improve measurements of U.S. economic inequality

""

Overview

Timely and accurate data are critical for diagnosing and responding to a wide variety of policy problems facing the United States, as well as improving the efficiency and effectiveness of the U.S. government. National statistics and the agencies that collect and distribute them—most notably, the U.S. Census Bureau, the U.S. Commerce Department’s Bureau of Economic Analysis, and the U.S. Department of Labor’s Bureau of Labor Statistics—are a critical public good because they provide policymakers, media, researchers, and the public with a common understanding of how the U.S. economy is faring.

Bolstering U.S. national statistical agencies and ensuring they’re able to do their job is of paramount importance. Cultivating and maintaining a strong federal data infrastructure is necessary to inform economic debates and accurately reflect an increasingly complex and data-driven policymaking world. Yet these agencies must be able to not only perform their core functions but also adapt to fit the current U.S. economy and the needs of policymakers.

A changing economy requires new tools. The Bureau of Economic Analysis, for example, is experimenting with disaggregating economic growth as a response to rising inequality in the U.S. economy. This data disaggregation provides deeper insight into economic disparities, furthering the conversation around how to close these divides and exposing vulnerabilities in the social and economic systems designed around a single-minded focus on growing Gross Domestic Product at all costs.

This is just one example of how more granular economic data can inform public policy. More can be done to update the statistics that federal statistical agencies produce and distribute to better understand structural changes in U.S. society. Below are other actions the Biden administration can take to support these agencies, all of which would help them produce relevant, timely data that informs conversations around the U.S economy and society as a whole.

Invest in improving the timeliness and granularity of data

Improving the level of data disaggregation and the timeliness of data reporting is crucial to the Biden administration’s goal of promoting equity through data. There are myriad ways this could be accomplished, some of which the administration is already pursuing. For example, the president’s proposed fiscal year 2024 budget for the U.S. Department of Labor calls for doubling the sample size of the Job Openings and Labor Turnover survey, which collects data on hiring, firing, and other U.S. labor market flows. This would allow for more finely disaggregated results by geography and other characteristics.

The Biden administration should consider other investments to help federal statistical agencies improve timeliness and disaggregated reporting of their economic statistics. Adding massive private datasets to the federal statistical system requires both time and money, but it could give agencies the ability to supplement official statistics and report results both faster and with more detail.

Further changes to existing survey infrastructure should also be considered. The Census Bureau’s American Community Survey is the largest annual economic survey in the United States and as such is unmatched in its ability to obtain economic data about small populations and geographies. Yet these data are only released in 1-year increments on an annual basis. The Biden administration should investigate whether it is feasible to release these data on a quarterly, rather than annual, basis.

Because the ACS survey is an input to other data products, a more frequent release schedule could have cascading effects on the availability and timeliness of other federal economic statistics. With the largest sample size of any federal economic household survey, the administration also could support the more timely release and analysis of economic statistics disaggregated by race, level of education, age, geographic location, and other demographics.

Increase funding for national statistical agencies  

The U.S. federal statistical system is at a critical inflection point. Agencies need resources to manage the transition from a largely survey-based system to new infrastructure that uses private and government administrative data, new methods for maintaining privacy and linking data, and more. Improvements to this infrastructure also are necessary to give policymakers the tools they need to monitor supply chains, make place-based investments, and implement the kind of industrial policies that are required by the Inflation Reduction Act.

Despite these critical needs, many statistical agencies find themselves strapped for cash. Their budgets are measured in millions of dollars—a drop in the bucket compared to other government programs that account for billions of dollars in annual government spending. Despite these relatively paltry funding levels, national statistical agencies are often one of the first on the chopping block when it comes to budget cuts. Spending allocated to the Bureau of Labor Statistics, for instance, has declined by almost 6 percent since 2016 (adjusted for inflation), while Bureau of Economic Analysis spending is down by 5 percent over the same period.

The budgets of past administrations have often been too timid, requesting increases for these agencies that are often paltry, if they even ask for an increase at all, while the U.S. Congress has been all too eager to cut funding for these agencies. Presidential administrations must recognize the value of these data and instead request ambitious funding levels to support this important work and prevent any further decline in data quality.

Adequately funding national statistical agencies is a relatively low-cost way to ensure we have objective, widely trusted data on the state of the U.S. economy. This will keep more U.S. workers employed, shorten recessions, and support an efficient and equitable economy. The Biden administration should engage with the National Academy of Sciences’ recent report on creating a 21st century national data infrastructure and make appropriate plans to meet the panel’s recommendations.

Advocate for data synchronization

One small change that would have an outsized impact on U.S. economic statistics is adjusting the tax code to allow the Bureau of Labor Statistics and Bureau of Economic Analysis to work with a limited amount of federal tax data from the IRS that they currently are not allowed to access. The agencies’ inability to use tax data has degraded U.S. national economic statistics in a number of ways. Perhaps most critically, it results in the Bureau of Labor Statistics and the U.S. Census Bureau, which does have access to tax data, maintaining two conflicting registers of U.S. businesses. These dueling registers disagree not only about how many business establishments there are in the U.S. economy, but also on trends within those sectors.

Take semiconductor manufacturing. The Census Bureau says there are about 3,700 U.S. businesses in “semiconductor and other electronic component manufacturing.” Data from the Bureau of Labor Statistics, however, say there are 6,000 U.S. businesses in that category nationwide. Meanwhile, the Census Bureau finds that there are fewer such businesses now, compared to 2012, while the Bureau of Labor Statistics says there has been about a 5 percent increase over that same time period.

This proposal to facilitate BEA and BLS access to tax data, known as data synchronization, can’t be carried out by the Biden administration—only Congress can fully implement it—but the administration should forcefully advocate for breaking down this data silo within the executive branch of the U.S. government. The U.S. Department of the Treasury, which houses the IRS, has already approved the proposal in the FY2024 edition of its “Green Book” of revenue proposals. The Treasury Department, the Department of Labor, and the Department of Commerce must coordinate to communicate this need to Congress and work with the U.S. House Ways and Means Committee and the U.S. Senate Finance Committee to advance this important data infrastructure fix.

Executive actions to reduce inequality and improve job quality for U.S. workers

""

Overview

Even during periods of sustained economic and employment growth, millions of workers across the United States still face economic uncertainty and precarious working conditions. Working conditions such as low pay, unstable schedules, little access to benefits, workplace surveillance, and discrimination and sexual harassment at work impact a considerable portion of the U.S. labor force and decrease job quality for workers.

There are many ways to tackle these problems. Some examples include raising the federal minimum wage, providing workers’ benefits that employers fail to provide, and instituting robust protections for workers. Addressing these problems would not only improve job quality and individual worker well-being, but it would also benefit the broader workforce, employers, and the U.S. economy as a whole.

One municipal-level example is the stable scheduling law passed in Seattle and enacted in 2017, which led to a 10 percentage point decrease in workers’ material hardship. Increasing the minimum wage at the local, state, and federal level increases worker tenure and, in turn, decreases employer costs due to more frequent worker turnover. The flip side of this is also true: Hostile workplaces where sexual harassment and racial discrimination are present increase employee turnover rates.

While topline statistics, such as employment growth and pay rates, are important, federal policymakers must also take steps to enact policies that improve job quality and worker well-being. There is interest in proposals to implement some of these improvements, both in the U.S. Congress, with bills such as the Schedules That Work Act and the Stop Spying Bosses Act, and through efforts from various federal administrative agencies.

Yet administrative agencies have only taken some concrete steps to address these problems, while Congress struggles to pass legislation. Though some progress is being made on these issues, there’s still more the Biden administration can do. This factsheet details several executive actions the administration could enact.

Reinstate the expanded EEO-1 form to include detailed pay information by gender, race, and ethnicity

Data collection is a key function of any administrative agency, especially when it comes to the Equal Employment Opportunity Commission. One of the most important tools the agency uses for data-gathering is the so-called EEO-1 form, which requires all private-sector employers with 100 or more employees, as well as federal contractors with 50 or more employees who meet certain criteria, to submit demographic workforce data along the lines of race and ethnicity, sex, and type of job. Thanks to these data, the EEO-1 form provides an understanding of the mechanisms behind economic inequalities and where those inequalities exist at certain firms.

The Obama administration expanded the EEO-1 form to include more detailed data, but the Trump administration stopped the collection of pay data altogether. Subsequent legal challenges during the Trump administration prevented the EEO-1 form from being properly implemented as initially designed.

Even though the agency is facing internal issues with implementing the EEO-1 form, some data continue to be collected. Collecting additional data, such as pay information broken down by employee demographics, would provide a more detailed picture of where and how economic inequality along demographic lines is perpetuated.

As such, the Equal Employment Opportunity Commission should fully reinstate the EEO-1 form to help provide these important baseline data points. Doing so would not only help stakeholders better understand the inequitable divides in the U.S. labor market, but also help guide federal, state, and local governments to more effectively target programs and policies to meet the needs of historically marginalized workers.  

Require government contractors to provide employees a fair workweek

Despite existing workplace protections, many employers—especially those in the retail and service industry—utilize unstable and unpredictable scheduling practices. Unstable scheduling practices, also known as “just-in-time” scheduling, make it harder for families to find child care, increase the likelihood of workers going hungry, and fail to offer more scheduling flexibility for workers.

Policymakers have experimented at different levels of government with fair workweek laws as a way to address just-in-time scheduling. Some common provisions of these laws include:

  • Ensuring workers have advance notice of their schedules (often 2 weeks’ notice)
  • Providing compensation to workers for last-minute schedule changes
  • Guaranteeing 10 hours of rest between working a closing and opening shift
  • Receiving an offer for additional hours before new employees are hired

Implementing such stable scheduling practices would provide important benefits to both employers and employees. Research by Columbia University’s Elizabeth Ananat, Anna Gassman-Pines at Duke University, Daniel Schneider at Harvard Kennedy School, and the University of California, San Francisco’s Kristen Harknett demonstrates that stable scheduling practices reduce scheduling unpredictability without negatively impacting hours worked, lower turnover rates in low-wage, service-sector industries, and increase workers’ productivity and employer profits in the U.S. retail industry.

The Biden administration should require government contractors to provide their employees with a fair workweek. Such a requirement could be implemented alongside commensurate efforts to ensure that contractors comply with the requirement, meaning that adequate reporting and enforcement measures should be considered. This would improve work quality and worker well-being and provide economic benefits to the employers as well, reducing the high rates of employee turnover that often lead to significant costs for the employer. Furthermore, such a mandate from the Biden administration could serve as a guide for state and local policymakers.

Prevent employers from deploying harmful electronic surveillance on their workers and ensure that monitoring does not result in discrimination

Workers across the country are increasingly vulnerable to invasive monitoring and surveillance practices by their employers. Everything from electronic surveillance tracking workers’ movements and computer use, to facial recognition software, to algorithmic management systems that are used to discipline and/or terminate workers are becoming increasingly prevalent in the United States. Low-wage and hourly workers are especially vulnerable to these practices.

Research by Lisa Kresge at the University of California, Berkeley Labor Center and Aiha Nguyen at Data & Society shows that continuous monitoring—and accompanying punitive actions from employers based on that monitoring—exposes workers to a range of harms, such as increased injuries, reduced wages, and a suppression of the right to organize.

Several federal agencies and regulatory bodies are examining issues related to workplace surveillance, including the Federal Trade Commission. A number of researchers, worker advocates, and civil society groups, as well as Equitable Growth, recently responded to the Federal Trade Commission’s Advanced Notice of Proposing Rulemaking on Commercial Surveillance and Data Security, outlining these harms and priority areas for action.

Other researchers and advocates studying this topic highlight key next steps the agency should take in its rulemaking. These include:

  • Ensuring that whatever monitoring data employers are allowed to collect is minimal and for narrow purposes that don’t harm workers, and with a goal of maximizing workers’ privacy, including by restricting businesses from deploying specific, harmful forms of electronic monitoring and sensitive data collection, such as facial recognition software, algorithmic surveillance, and biometric surveillance.
  • Facilitating researchers’ and regulators’ access to the surveillance data that firms collect to understand firms’ actions and potential harms to workers, for oversight, and for accountability. There also should be full notice and transparency of monitoring practices, coupled with other privacy and labor protections, so that workers and unions know what information is being collected and therefore can potentially bargain over these issues.
  • Making sure that any use of electronic monitoring, surveillance, algorithmic decision-making and/or data-driven worker management software tools are not used to discriminate against historically marginalized groups, including disparate impacts on protected classes.

Going forward, continuing and increased coordination between relevant agencies and regulatory bodies will also be necessary to address the many intertwined issues around workplace surveillance and worker power.

Launch a demonstration project to test the efficacy of paying workers more frequently

Like most workers in the United States, federal employees are paid every 2 weeks. But this practice—an artifact of New Deal era legislation and status quo bias—is not necessarily in workers’ best interest. Despite major advances in financial technology in recent decades, workers are still forced to wait many weeks between completing work and being paid, effectively providing their employer with an interest-free loan in the interim.

There is mixed evidence on the benefits of more frequent pay. Some workers who live paycheck-to-paycheck would surely benefit from having enough cash on hand to meet daily expenses and avoiding the high fees and interest payments associated with short-term loans, credit card debt, and other, sometimes predatory, financial products. Other workers might prefer the forced savings associated with being paid larger amounts less frequently, allowing wage earners to build up large enough sums to purchase durable goods and perhaps helping them combat self-control problems. Indeed, recent research shows that more frequent pay can lead to higher consumption due to the feeling among earners that they are richer than they actually are, while other studies find the opposite.

It is also not clear how altering traditional pay periods might affect employers. Running payroll more often will likely increase their administrative costs, but reducing workers’ financial stress could redound to firms in the form of higher employee productivity and reduced turnover. Indeed, one paper from 2022 found that more frequent pay led workers to be more productive while also increasing their homeownership rates. But much of the research touting more frequent pay has been done by private companies with a vested interest in the use of their advance pay products, some of which come with high fees.

Given these promising but inconclusive findings, there is a major opportunity for the federal government to lead the way in experimenting with long-overdue payday innovations. Using its statutory authority to conduct demonstration projects, the Office of Personnel Management could collaborate with federal agencies to test the efficacy of more frequent or varied paydays for a subset of federal workers. The agency could also investigate the option of allowing employees to pick their own payday to better time their incomes to expected monthly expenses.

The Office of Personnel Management is well-positioned to analyze the effects of these changes on both employee well-being and employer performance, using existing tools such as the Federal Employee Viewpoint Survey to gauge worker satisfaction. Findings from the trial could help inform not just federal workforce policies, but also state pay frequency laws, requirements for federal contractors, potential federal legislation, including minimum wage and overtime regulation, wider labor market practices, and even ways to relieve macroeconomic congestion

Inflation, Federal Reserve policymaking, and liquidity traps

Fighting inflation in a liquidity trap is difficult, but with inflation cooling, the gains from doing it right are becoming harder to ignore

""

The Federal Reserve is fighting inflation, but more importantly, the Fed wants everyone to know that it is fighting inflationary expectations. This means, in the short term, that with inflation seemingly trending lower but not as fast as the Fed wants it to, interest rates are likely to go significantly higher until indications of the persistence of inflation abate further. The recent turmoil in U.S. regional bank stocks after the failure of Silicon Valley Bank and Signature Bank will complicate the Fed’s decision-making, but the federal government’s rescue of the two banks’ depositors is unlikely to upend its medium-term effort to quell inflationary expectations.

That’s why it’s worth stepping back to revisit a longer-term driver of inflation in the current economic recovery, both mechanically and through policy responses: the lost decade of U.S. economic growth and investment that followed the Great Recession of 2007–2009. Simply put, fighting recessions and inflation is more complicated and riskier when an economy starts in a liquidity trap—that is, when inflation and interest rates are too low such that investment is disincentivized.

In addition to the typical risk that too much support for a faltering economy can trigger temporary inflation, there is the far greater risk that too timid a response can deepen economic decline and permanently shrink the economy. That was still the situation when the recovery from the COVD-19 recession began less than 3 years ago.

This relatively recent surge in inflation, the Fed’s policymaking in reaction to that surge, and the yield curve inversions that the U.S. financial markets have experienced recently all reflect the challenges of making sound fiscal and monetary policy responses amid that liquidity trap. The Fed is well aware that it does not understand all the precise causes of inflation today, but the decades-long low-growth, low-inflation economic environment that preceded today’s inflationary pressures strongly caution against excessively strident monetary and fiscal policy that risks pushing the economy back toward a liquidity trap—a far worse outcome than today’s inflation.

To be sure, the Fed, the Biden and Trump administrations, corporations, workers, and the U.S. Congress have all received some blame for the initial surge in inflation and some continuing inflationary pressures. And more precisely calibrated monetary and fiscal policies and more competitive markets may have reduced the inflationary surge, as several recent studies suggest.

Yet the focus on these more immediate real-time culprits for inflation is overly simplistic. To understand why, let’s step back to early 2022, when the Fed’s monetary policy was not maximally anti-inflation and should not have been—and not just due to the short-term supply shocks caused by the start of the war in Ukraine early that year. The U.S. economy was still being lashed by the COVID-19 pandemic that began in 2020 amid a long-persistent liquidity trap. Since the so-called dot-com recession ended in 2001, the federal funds rate has been below 1 percent more often than it has been above it, and below 2 percent more than three-quarters of the time. Engineering an economic recovery in a liquidity trap is difficult because it requires more aggressive monetary and fiscal policies to spark strong and sustained economic growth.

Fast-forward to the fiscal and monetary policy responses to the COVID-19 recession. The aggressive fiscal policy and (at the very least the de facto) lower-for-longer monetary policy the Fed pursued in 2020 and 2021 were precisely the prescriptions of macroeconomics for this condition. None of these policy choices was a mystery. Policymakers and Fed officials repeatedly stated that the goal, well into the recovery, was to err on the side of being too aggressive to avoid choking off growth or causing a deflationary recession. The result is the strongest jobs recovery the U.S. economy has experienced in 40 years. (See Figure 1.)

Figure 1

Percent loss in employment since the start of the recession

This approach contrasts sharply with the fiscal and monetary policies pursued after the end of the dot-com recession and the Great Recession—periods characterized as “jobless” economic recoveries, where more timid responses brought very low inflation but at the cost of a permanently smaller economy, weak job growth, and increased income and wealth inequality. The weak recoveries deepened the U.S. economy’s decline into secular stagnation—slow growth and underinvestment during economic expansions.

Escapes from liquidity traps are rare—just look at how Japan has struggled for nearly a half-century in its liquidity trap—and returning the U.S. economy to a sustained healthier growth trajectory is a resource strain, and not only due to short-term factors. Two decades of underinvestment in the 21st century meant capacity constraints may have generated price inflation longer than they should for a healthy recovery economy. This investment decline is readily apparent in private-sector investment data overall. (See Figure 2.)

Figure 2

Private investment as a share of U.S. Gross Domestic Product by decade, 1970s to 2020s

U.S. private investment in the 2010s was just 15.5 percent of Gross Domestic Product, compared to around 18 percent of GDP for the last 3 decades of the 20th century. The well-publicized nature of the home mortgage crisis that sparked the Great Recession makes residential investment an obvious culprit, but nonresidential investment as a share of GDP fell a full percentage point from the pre-2000 levels on top of that. Taken together, this underinvestment can have significant effects on the supply side of the economy—even when this is a downstream effect.

A 20-year trend such as this is not the kind of short-term supply shock that monetary policymakers can ignore. Indeed, this is the result of the very secular stagnation that economists such as Olivier Blanchard at the Peterson Institute for International Economics and Larry Summers at Harvard University have been raising alarms about for much of this time.

The robust U.S. economic recovery today, even amid inflation, is unambiguously better for the United States than a weaker recovery with lower inflation. This is one reason why the nonpartisan Congressional Budget Office’s projected 2030 GDP is stronger now than its pre-pandemic projections, when the CBO anticipated shrinking economic growth for years after the previous recovery beginning in 2009.

Inflation is going to remain a major concern, but the record on inflation so far does not point to a dire future. Inflation has been much higher than forecast over the past year, owing to both demand- and supply-side factors. Yet expected inflation has remained well-anchored, suggesting that policy has finally overcome the liquidity-trap challenge of committing to being irresponsible, while maintaining long-term price stability. This is not a reason for complacency, but a clear signal that markets’ longer-term expectations are that the Fed will, perhaps more slowly than it wants, bring inflation back toward its target of 2 percent.

There are two major macroeconomic questions for economic policy over the next year—one a challenge and one an opportunity. The challenge is well-understood: With inflation having peaked and now poised to decline for multiple reasons, the Fed must balance patience with credibility in its pursuit of its 2 percent target. If it is far too patient, then inflationary expectations could increase significantly, but if it is too impatient, it could damage the economy.

The more interesting, more exciting question is whether the higher rates that the Fed is imposing on the U.S. economy now are a sign that the era of secular stagnation is over. This is a speculative question without a simple answer yet. Why? Well, if the higher rates that Fed officials are contemplating prove excessive, then that would strengthen the chances of a return to secular stagnation. But if the Fed’s long-term rate targets, known as neutral rates, can rise as much as some are discussing—much higher than the less than 3 percent levels that the Fed’s median projection has not exceeded since mid-2014—then that suggests the economic successes of this decade may also include an escape from secular stagnation.

Now that is a singular opportunity, given recent U.S. economic history.

Posted in Uncategorized

Major federal ‘Big Tech’ antitrust case against Google will test the strength of current U.S. antitrust laws in new digital markets

""

A high-profile antitrust enforcement action taken in January by the Antitrust Division of the U.S. Department of Justice against Alphabet Inc.’s Google unit—one of the largest technology companies in the world—could well determine whether existing U.S. antitrust laws remain relevant in the world of Big Tech.

Most immediately, the action will test the proposition that existing antitrust doctrines are applicable in these new, high-tech markets. More broadly, an eventual court decision in the case could help inform the U.S. Congress whether it will need to update U.S. antitrust laws to deal with Big Tech digital market concentration after the previous Congress failed to do so.

The new federal case alleges that Google consolidated its market power by acquiring its potential competitors, then used its market power to manipulate auction markets—where advertising space is sold to the highest bidder in real time—playing one side against the other. The Antitrust Division argues this is not a coincidence, but rather was a deliberate strategy by Google to thwart competition for its own gain.

To remedy these harms, the agency is asking the U.S. District Court for the Eastern District of Virginia to break the connection between Google and its advertising business. Breaking up a company is a serious remedy but not an unprecedented one. Where a breakup is the goal, though, enforcers must have it in their sights from the outset and build their case around it.

But will the federal government be able to effectively address competition concerns in these modern markets with tools designed in another era? U.S. antitrust law, which dates back to the late 19th century and has been refined by the U.S. Congress and the U.S. Supreme Court since then, is well-suited to handle routine antitrust enforcement in traditional industries. But the business practices and strategies playing out across the U.S. digital technology sectors and beyond are not always easily connected to the historic applications of U.S. antitrust law.

That’s why this new enforcement action by the federal government is so important. The Google case will test whether the analytical tools that Justice Department antitrust lawyers present can make sense of these (and other) digital technology markets and the competitive dynamics within them—and thus, whether courts and antitrust enforcers can apply longstanding, fundamental U.S. antitrust laws to allegedly monopolistic practices in the context of new technologies. The antitrust laws are broad and designed to evolve with markets and technologies, but applying them to these new technology markets still raises hard questions.

Applying evidence in antitrust cases in digital markets

A new book published in late 2022 by the Washington Center for Equitable Growth, Judging Big Tech: Insights on applying U.S. antitrust laws to digital markets, offers the judge who will handle this case and the attorneys who will prosecute it some useful ways to think about how to present and assess the evidence.

In the first chapter of the book (beginning on page 10), legal scholar Harry First, the Charles L. Denison Professor of Law at New York University School of law, uses the lens of the 2001 antitrust case, United States v. Microsoft Corp.,to examine tech remedies. First makes a compelling case that only by developing the right kind of evidence and thinking creatively about the tools to be deployed can antitrust enforcers realistically hope to obtain structural relief of this nature. Because the case for a breakup must be built throughout the case, First emphasizes that enforcers must start their case with that ultimate goal in mind.

To get to a remedy, though, the question of liability must first be resolved. The Justice Department’s complaint against Google draws on another theme addressed by the book: the acquisitions of nascent competitors. In the second chapter of the book (beginning on page 38), Doug Melamed, a professor of the practice of law at Stanford Law School, provides a much-needed framework for distinguishing problematic acquisitions of nascent or potential competitors from the overall run of productive acquisitions of small companies that provides the engine for dynamic U.S. start-up industries.

Melamed also explains why antitrust enforcers must steadfastly pursue problematic acquisitions, even though they are the exception to most nascent acquisitions. He presents detailed technical analysis of the ways in which enforcers can distinguish between these run-of-the-mill acquisitions and those with the potential to extinguish a true competitive threat, where the costs to innovation and to consumers are enormous.

The importance of intent evidence in the case of Big Tech antitrust cases

In the fourth chapter of the book (beginning on page 97), Marina Lao, the Edward S. Hendrickson Professor of Law at Seton Hall University’s School of Law, adds a forceful argument for the central role of evidence of intent. Even where it is not an element of a violation, traditional evidence of intent can be a powerful window into how those who know the industry and the players best—the players themselves—view acquisitions and other conduct.

The Department of Justice’s complaint against Google reflects this understanding of the evidence in the case, including citations to internal Google emails to show that those within Google were aware of the competitive implications of Google’s strategy and conduct. This kind of evidence is sometimes dismissed as “unscientific” in favor of quantititative evidence—the result of the influence of the so-called Chicago School of conservative legal antitrust scholars, notes Lao.

Beginning in the late 1970s and early 1980s, “under the influence of the Chicago School, economic efficiency became antitrust law’s main objective and neoclassical economic (or price) theory the preferred analytical tool,” she writes. “During this time, antitrust law also turned strongly in favor of quantitative evidence and economic analytical tools.” Yet intent evidence is the type of documentary evidence that is particularly valuable in the context of rapidly evolving and highly complex tech markets, where the players are arguably better able to perceive the impact of their conduct than economic modeling.

Quantitative evidence often fails to paint a clear picture of competitive effects when innovation and other nonprice harms to competition defy quantification or easy measurement. This creates major problems of proof for antitrust enforcement in digital technology markets, where there is a growing consensus that a narrow focus on price effects fails to capture the scope of competitive harm. Lao argues that reviving recognition of intent evidence in monopolization cases in markets marked by rapidly changing technologies—such as those involving digital platforms—can help strengthen antitrust enforcement by enabling judges to use traditional documentary evidence and the defendants’ own expertise about their products and markets to contextualize quantitative economic evidence and evaluate competitive dynamics in complex and rapidly changing markets.

The salience of anticompetitive conduct across multiple markets

A final issue of particular salience, in light of the nature of the federal antitrust allegations against Google, is how courts should address conduct that impacts multiple interrelated markets. The core allegation in the Department of Justice’s lawsuit is that Google controls all of the platforms that mediate advertising transactions between website publishers and advertisers, and exercises its power across these platforms to harm both publishers and advertisers—and competition generally.

But this raises the tough question of whether and how the impacts of Google’s conduct across multiple markets should be weighed against each other. As Erika Douglas, an associate professor of law at Temple University’s Beasley School of Law, argues in chapter 3 of the book (beginning on page 67), there is currently no clear framework for reconciling these varied effects across markets. Douglas interrogates and rejects the idea that clear precedent precludes balancing harms and benefits across different markets but argues that from first principles and sound reasoning, courts should nonetheless exercise extreme caution in this area.

Indeed, in the vast majority of antitrust cases, she writes, conduct should be evaluated based on its impact (good and bad) on a single market. Only in very particular circumstances should courts consider cross-market effects, and when they do so, they should do it forthrightly, not by stretching market definition to its breaking point, as in the highly criticized Supreme Court decision in Ohio v. American Express Co. Instead of distorting market definition principles, the American Express case should have directly addressed cross-market justifications, Douglas argues. The Department of Justice’s current case against Google includes the same cross-market issues.

Conclusion

The importance of digital information technology and communications giants to the U.S. economy and society today is undeniable, which is why the Antitrust Division of the U.S. Department of Justice and the Federal Trade Commission—the two federal enforcers of antitrust law—are carefully examining the business strategies of these Big Tech companies. This increased focus is appropriate, given that Google, alongside Meta Inc. (the parent company of Facebook), Amazon.com Inc., Apple Inc., and Microsoft Corp., are the main arteries for the U.S. public’s social and commercial engagement online.

Antitrust enforcement agencies are particularly interested in these companies because of the ways in which the dominant technology firms are expanding their businesses and how those decisions affect U.S. consumers, businesses, and workers. How the antitrust case against Google plays out in court will have outsized significance to U.S. economic competitiveness—and consequently to future economic productivity and growth and broader U.S. societal well-being. It will also prove to be a critical bellwether, indicating just how relevant antitrust remains in modern markets. Judging Big Tech provides new and valuable legal tools and insights from antitrust experts that judges and others can use to guide the way through this first wave of digital platform antitrust cases and plot a course for antitrust’s future.

Posted in Uncategorized

Equitable Growth’s Jobs Day Graphs: February 2023 Report Edition

On March 10, the U.S. Bureau of Labor Statistics released new data on the U.S. labor market during the month of February. Below are five graphs compiled by Equitable Growth staff highlighting important trends in the data.

The employment rate for prime-age workers increased from 80.2 percent in January to 80.5 percent in February as total nonfarm employment rose by 311,000.

Share of 25-to 54-year-olds who are employed, 2007–2023. Recessions are shaded.

The unemployment rate increased to 3.6 percent in February, and is highest for Black workers (5.7 percent) and Latino workers (5.3 percent), compared to White workers (3.2 percent) and Asian American workers (3.4 percent).

U.S. unemployment rate by race, 2019–2023. Recessions are shaded.

Nominal wage growth (not accounting for inflation) did not change dramatically in February, with average hourly earnings growth at 4.62 percent over the past 12 months.

Percent change in U.S. wages from previous year, as measured by two surveys. Recessions are shaded.

Employment in many sectors, including construction, retail, and educational services is now back to or surpassing pre-pandemic levels. Employment in leisure and hospitality has not quite recovered, but added 105,000 jobs in February.

Employment by selected major U.S. industries, indexed to industry employment in February 2020 at the beginning of the COVID-19 recession (shaded).

The share of unemployed workers who are unemployed due to job loss increased to 32.2 percent, and the share on temporary layoffs rose to 13.6 percent; the share who left their jobs (14.8 percent), are reentering the labor force (30.8 percent), or are new entrants (8.6 percent) declined.

Percent of all unemployed workers in the United States by reason for unemployment, 2019–2023

The importance of the American Rescue Plan for U.S. workers and families on the law’s second anniversary, in 8 charts

""

Tomorrow marks 2 years since the American Rescue Plan Act was signed into law. One year after the COVID-19 pandemic that began in early 2020 triggered enormous employment losses and the worst economic contraction since the mid-1940s, the 2021 law allocated $1.9 trillion in relief and critical public investments. Among its key provisions were:

The COVID-19 shock sparked an unprecedented public health crisis, widened longstanding racial, ethnic, and gender socioeconomic disparities, and highlighted important cracks in the country’s social infrastructure. Many parts of the U.S. economy have not yet fully recovered, and legislators have failed to maintain successful pandemic-era policies.

Yet swift government action through legislation such as the American Rescue Plan Act of 2021 and the Coronavirus Aid, Relief, and Economic Security, or CARES, Act of 2020 were essential in mitigating the economic pain brought on by the pandemic. The result of these policies, shown below, demonstrate how public investment is critical for robust and broad-based economic growth, especially for groups already facing socioeconomic hardship. Here is a snapshot of the U.S. economy on the second anniversary of the American Rescue Plan Act of 2020, in 8 charts.

The impact of the American Rescue Plan in 8 charts

Between February 2020 and April 2020, U.S. employment shrank by almost 15 percent. While job losses dwarfed those of previous downturns, the U.S. labor market has fully bounced back in the 2 years since the onset of the COVID-19 recession. (See Figure 1.)

Figure 1

Percent loss in employment since the start of the recession

The overall U.S. economic recovery in employment, then, has been exceptionally strong, and industries such as transportation and warehousing have grown substantially since early 2020. Yet some parts of the U.S. economy, such as leisure and hospitality and the public sector, are not yet back to their pre-pandemic job levels. (See Figure 2.)

Figure 2

Percent and net change in employment by major U.S. industries, February 2020–July 2022

The same is true within sectors of the U.S. economy. For instance, employment in the essential child day care services industry dropped by a massive 35 percent at the height of the COVID-19 recession. This sector is still experiencing a notable shortfall in employment. (See Figure 3.)

Figure 3

Total U.S. nonfarm employment and employment in the child day care services industry, indexed to February 2020 (COVID-19 recession is shaded)

The decline in U.S. employment was also especially severe for women workers and workers of color. Latinas experienced the deepest decline—a drop in employment of almost 20 percent. As of January 2023, however, Black male workers and Latino and Latina workers have surpassed their pre-pandemic employment levels. (See Figure 4.)

Figure 4

Percent change in employment, 3-month moving average, among workers 20-years-old and over, by gender, race, and ethnicity, 2020–2023

As such, workers of color, low-income workers, and workers with lower levels of formal education were much more likely to report having lost employment income in the first year of the pandemic in the United States. A much smaller share of workers is still reporting lost income, but important disparities remain. (See Figure 5.)

Figure 5

Share of U.S. adults reporting that they or someone in their household lost employment income, by 2019 household income, race/ethnicity, and educational attainment

These disparities are also reflected in U.S. households’ abilities to pay for basic expenses. According to data by the U.S. Census Household Pulse Survey, Black and Latino households are much more likely to find it very difficult to pay regular expenses than their White and Asian American counterparts. (See Figure 6.)

Figure 6

Share of U.S. respondents who found it "very difficult" to make regular expenses by race and gender, August 2020 - February 2023

And when important pandemic-era policies expired at a time of rising inflation, more and more U.S. households turned to credit cards, loans, and savings to meet their spending needs. (See Figure 7.)

Figure 7

Millions of U.S. households that reported using these seven sources to meet spending needs by week, June 2020 _ February 2023

Indeed, perhaps one of the greatest missed opportunities of the past few years was failing to permanently strengthen the country’s income supports that were boosted through the CARES Act of 2020 and the American Rescue Plan Act, such as continuing the enhanced Child Tax Credit—a policy that reduced child poverty in the United States by 40 percent and mitigated economic hardship among low-income households. (See Figure 8.)

Figure 8

The percentage of low-income U.S. households with and without children reporting food insufficiency, difficulty with expenses, and missed mortgage payments, April 14, 2021 – August 16, 2021

Conclusion

Three years after the onset of the COVID-19 pandemic and the resulting inflation crisis, and 2 years after the passage of the American Rescue Plan Act, many economic indicators show that the recovery from the 2020 recession has been exceptionally strong. That the deepest recession in recent U.S. history was also the shortest is, in large part, the result of a robust public policy response to an unprecedented crisis. These investments in the U.S. economy point to the importance of government support to achieve full and equitable recoveries.   

At the same time, neither the CARES Act nor the American Rescue Plan Act thoroughly addressed the structural challenges in the U.S. income supports system, nor did they establish greater institutional support for worker power, which is critical to reversing longstanding disparities. And more recent pieces of legislation, such as the historic Inflation Reduction Act of 2021, did not prioritize investments in the country’s social infrastructure—key for broad-based and sustainable economic growth. The current U.S. economic recovery rests on the positive outcomes that stem from robust public investments in U.S. workers, families, and communities, a lesson that continues to be important for policymakers to understand going forward.

Posted in Uncategorized

JOLTS Day Graphs: January 2023 Edition

Every month the U.S. Bureau of Labor Statistics releases data on hiring, firing, and other labor market flows from the Job Openings and Labor Turnover Survey, better known as JOLTS. Today, the BLS released the latest data for January 2023. This report doesn’t get as much attention as the monthly Employment Situation Report, but it contains useful information about the state of the U.S. labor market. Below are a few key graphs using data from the report.

The quits rate fell to 2.5 percent as 3.9 million workers quit their jobs in January 2023.

Quits as a percent of total U.S. employment, 2001–2023. Recessions are shaded.

As job openings declined to 10.8 million and hires remained near 6.4 million, the vacancy yield increased to 0.59 in January from 0.56 in December.

U.S. total nonfarm hires per total nonfarm job openings, 2001–2023. Recessions are shaded.

The ratio of unemployed workers to job openings increased to almost 0.53 in January from less than 0.51 in December.

U.S. unemployed workers per total nonfarm job opening, 2001–2023. Recessions are shaded.

The Beveridge Curve moved inward in January, reflecting declines in both the job openings rate and unemployment rate. 

The relationship between the U.S. unemployment rate and the job openings rate, 2001–2023.

The number of job openings declined in January, including in sectors such as construction, financial activities, and leisure and hospitality.

Job openings by selected major U.S. industries, indexed to job openings in February 2020
Posted in Uncategorized

Ahead of new U.S. jobs data releases, here’s what employment growth and job switching mean for wage disparities in the U.S. labor market

""

Overview

Later this week, the U.S. Bureau of Labor Statistics will release data on February 2023 job growth through its Employment Situation Summary. It will also release information on job openings, hires, and separations during the month of January 2023 through its Job Openings and Labor Turnover survey. As new economic data are published and the U.S. labor market continues to recover from the COVID-19 recession, one important underlying dynamic that economists and policymakers alike need to heed is the relationship between employment growth, job switching, and wage disparities in the U.S. labor market.

Topline economic indicators show that the U.S. labor market is remarkably strong. Over the past 3 months, the U.S. economy added an average of 356,000 jobs. The national joblessness rate, at 3.4 percent, is currently at a 50-year low. Almost all major industries have surpassed their pre-pandemic employment levels. And the quits rate continues to be near record highs—a sign that U.S. workers are confident in the labor market and in finding new and better employment opportunities.

Underlying these strong positive trends are several key developments that are shaping the recovery from the short but deep COVID-19 recession of 2020. One is the real wage gains experienced by workers at the bottom of the wage distribution. Another is the high rates of quits among these workers and U.S. workers overall. And a third development is the positive relationship between these two dynamics.

This issue brief will detail these three trends to put into perspective the importance of the stronger bargaining power experienced by low-wage workers in the wake of the most recent recession, as well as the key social infrastructure investments and policies that need to be undertaken in order to maintain and strengthen the gains workers made over the first 2.5 years of the economic recovery.

The topline U.S. labor market indicators

Let’s first set the stage by examining three important U.S. labor market indicators: employment growth, the labor force participation rate, and the prime-age employment-to-population ratio, or the share of 25- to 54-year-olds who are employed. Employment growth is strong but may be slowing down. And while neither the labor force participation rate nor the prime-age employment-to-population ratio is back to its February 2020 levels, both metrics experienced upticks in 2022. (See Figures 1 and 2.)

Figure 1

Change in total nonfarm U.S. employment, monthly change, and 3-month moving average (in thousands), July 2021-January 2023

Figure 2

U.S. labor force participation rate and employment-to-population ratio, 3-month moving average, for the population 16 years old and older and the population between the ages of 25 and 54, 2006-2023

Employment outcomes continue to be widely unequal across demographic groups, but the hot U.S. labor market seems to be narrowing some of the longstanding disparities that then skyrocketed during the onset of the pandemic in early 2020. The unemployment rate for workers without a high school diploma, for instance, is at a record low, and employment among Black men and Latino workers, both men and women, has experienced a particularly strong bounce back.

Indeed, the number of Black men who are employed was almost 8 percent greater in January 2023 than it was during February 2020, reflecting stronger job growth than for any other group of workers. Likewise, the gap between the national joblessness rate and the joblessness rate of both Black workers and Latino workers is smaller now than during the immediate aftermath of the COVID-19 recession in the early spring of 2020. (See Figures 3 and 4.)

Figure 3

Percent change in U.S. employment, 3-month moving average, among workers 20 years old and older, by gender, race, and ethnicity, 2020-2023. Recessions are shaded.

Figure 4

U.S. unemployment and unemployment by race and ethnicity, 3-month rolling average, 2020-2023. Recessions are shaded

A higher quits rate is associated with greater worker bargaining power

Why are some U.S. labor market disparities narrowing? The year after the onset of the COVID-19 pandemic, the number of U.S. workers quitting their jobs rose to record highs. Some workers left their jobs because they no longer felt safe at work; others moved. And other workers had new or greater caregiving responsibilities, started their own businesses, or decided to pursue another career path. Indeed, many workers not only switched employers but also decided to transition to another industry or occupation altogether.

During the final 2 months of 2021, the monthly national quits rate—or the share of all workers who voluntarily leave their job in a given month—reached a record peak of 3 percent. More than 4.5 million workers quit in November 2021—the highest number since the U.S. Bureau of Labor Statistics started reporting the metric in the early 2000s. While both the quits rate and the absolute number of quits declined throughout the course of 2022, these two statistics continue to be well above their pre-pandemic levels. (See Figure 5.)

Figure 5

Quits as a percent of total U.S. employment, 2021-2022. Recessions are shaded

As quits and job mobility accelerated in the years after the initial shock of the COVID-19 pandemic, the pace at which workers changed jobs increased more for some demographic groups than others. An analysis by the Pew Research Center, for example, finds that the share of Black workers and Latino workers who change employers in a given month is substantially higher than the share of Asian American workers and White workers who make that same switch.

Moreover, the same analysis finds that while Asian American workers and White workers were about as likely to change employers in 2019 as in 2022, the likelihood that Black workers and Latino workers moved from one employer to another increased substantially after the onset of the pandemic. Workers with a high school diploma or less were also much more likely to switch employers in 2022 than in 2019. (See Figure 6.)

Figure 6

Share of U.S. workers who changed employers in the past month, by race, ethnicity, and level of formal education, 2019 and 2022

Workers of color and workers with lower levels of formal education change employers especially often because they are more likely to be sorted into lower-quality jobs. Indeed, inadequate pay, insufficient benefits, lack of opportunities for career advancement, unsafe working conditions, and undesirable working environments are some of the main drivers behind the particularly high turnover rates in low-paying industries such as retail and leisure and hospitality.

At the same time, a higher quits rate and greater opportunities for job mobility seem to be leading to better employment outcomes for many U.S. workers. People are more likely to leave their current jobs when the labor market is strong, and they are confident that they will find employment opportunities elsewhere. Indeed, research shows that the great majority of workers who quit move on directly to another job, rather than spending time unemployed or stepping out of the labor force altogether. In economic speak, then, a higher quits rate tends to reflect that workers have more outside options.

A climbing quits rate also is associated with faster wage growth because workers tend to transition to higher-paying opportunities after voluntarily leaving their previous jobs. And, as a higher share of the workforce quits, employers usually have to offer higher wages in order to attract and retain employees, shifting bargaining power toward labor. Indeed, several studies suggest that the sluggish earnings growth that U.S. workers experienced during most of the recovery from the Great Recession of 2007–2009 can be, at least in part, attributed to a decline in what economists call job-to-job transitions.

In addition, economic disparities can be reduced amid a tight labor market due precisely to a higher number of job openings and an elevated quits rate. Job switchers usually experience stronger wage growth than job stayers, especially during economic booms, and research shows that lower-wage workers tend to rely more on job switching to get increases in pay than higher-wage workers.

In a 2021 study, for instance, a team of economists used administrative data on dual job-holders to examine the pathways workers use to get higher wages. Their findings suggest that the highest earners were much more likely to see increases in pay by bargaining with their employers, since firms generally have to spend more time and resources filling higher-wage positions and are therefore more likely to make efforts to retain higher-paid employees. Those in the bottom of the distribution, in contrast, usually had to change firms in order to get a raise.

Similarly, research by Nathan Wilmers and William Kimball at the Massachusetts Institute of Technology finds that workers in low-wage occupations are much more likely to move on to higher-quality jobs when switching employers than when changing positions through internal hiring processes.

The tight labor market reduced wage inequality in the U.S. economy, but there are signs that disparities are no longer narrowing

The rapid recovery of the U.S. labor market after the COVID-19 recession in 2020 was accompanied by faster nominal wage growth for U.S. workers, especially for those in low-wage jobs. An analysis by the Peterson Institute for International Economics finds, for instance, that between December 2019 and December 2021, wage growth was fastest in the industries of retail trade and leisure and hospitality—the lowest-paid sectors of the U.S. economy. And an analysis by the Economic Policy Institute finds that in the same year, workers in the bottom 30 percent of the wage distribution were the only ones to experience real wage gains. That is, these workers saw a wage increase even after accounting for inflation.

Greater competition for workers, recent research shows, was an important driver of this compression in wages. For instance, a study by David Autor at the Massachusetts Institute of Technology and Annie McGrew and Arindrajit Dube at the University of Massachusetts Amherst finds that as the U.S. labor market started to recover from the initial COVID-19 shock, increased competition for labor led to particularly strong wage growth among the lowest-paid workers, who now had greater access to better-paying employers.

Specifically, the team of economists analyzed differences in state-level unemployment rates and job switching rates—two metrics researchers use to determine how tight a given labor market is. They find that in states with lower joblessness and relatively more job-to-job transitions, real wage growth among low-wage workers was faster, especially among younger workers without a college degree. In addition, Autor, McGrew, and Dube find that as the lowest-paid workers became especially likely to quit their previous job in response to higher-paying opportunities elsewhere.

Overall, these dynamics contributed to an important decline in the wage divide, reversing about 25 percent of the four-decade increase in the gap between workers in the top 10 percent of the wage distribution and workers in the bottom 10 percent.

But these recent U.S. labor market dynamics, which triggered what Autor, McGrew, and Dube call the “great compression” in wages, might be decelerating. In the second half of 2022, wage growth slowed down for workers in general, and for workers in low-paying sectors such as leisure and hospitality in particular. And while employment growth continues to be strong and the quits rate is still relatively high, there are signs that employers’ competition for workers has cooled over the past few months.

Conclusion

When the U.S. Bureau of Labor Statistics later this week releases its February 2023 data on job growth and information on job openings, hires, and separations during the month of January 2023, these recent underlying trends in the U.S. labor market will become a bit more clear.

As the new data come in, policymakers need to consider how to institutionalize worker power and enact policies that proactively and intentionally promote broadly shared growth, so that wage disparities continue to narrow. A higher federal minimum wage, providing government agencies with the tools and resources to better enforce labor standards, and making it easier for workers to form and join unions, for example, would all go a long way to foster better outcomes for U.S. workers in the bottom of the wage distribution, even when the U.S. labor market is not sizzling hot.

Posted in Uncategorized