JOLTS Day Graphs: January 2023 Edition

Every month the U.S. Bureau of Labor Statistics releases data on hiring, firing, and other labor market flows from the Job Openings and Labor Turnover Survey, better known as JOLTS. Today, the BLS released the latest data for January 2023. This report doesn’t get as much attention as the monthly Employment Situation Report, but it contains useful information about the state of the U.S. labor market. Below are a few key graphs using data from the report.

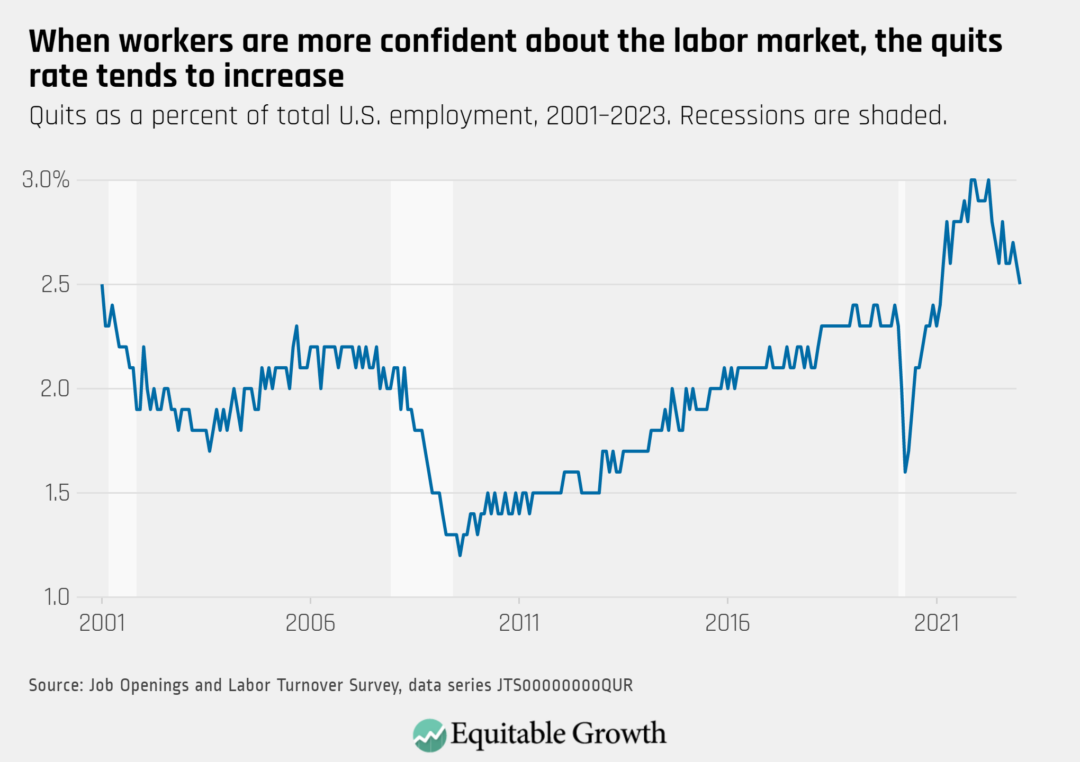
The quits rate fell to 2.5 percent as 3.9 million workers quit their jobs in January 2023.

Quits as a percent of total U.S. employment, 2001–2023. Recessions are shaded.

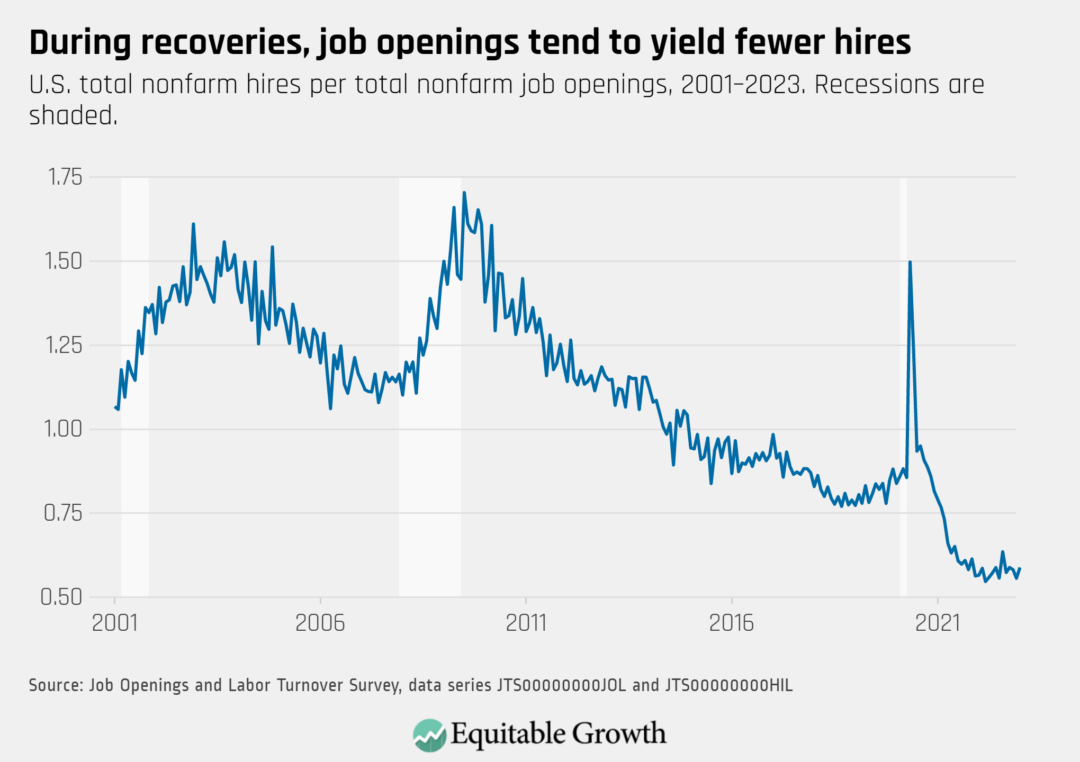
As job openings declined to 10.8 million and hires remained near 6.4 million, the vacancy yield increased to 0.59 in January from 0.56 in December.

U.S. total nonfarm hires per total nonfarm job openings, 2001–2023. Recessions are shaded.

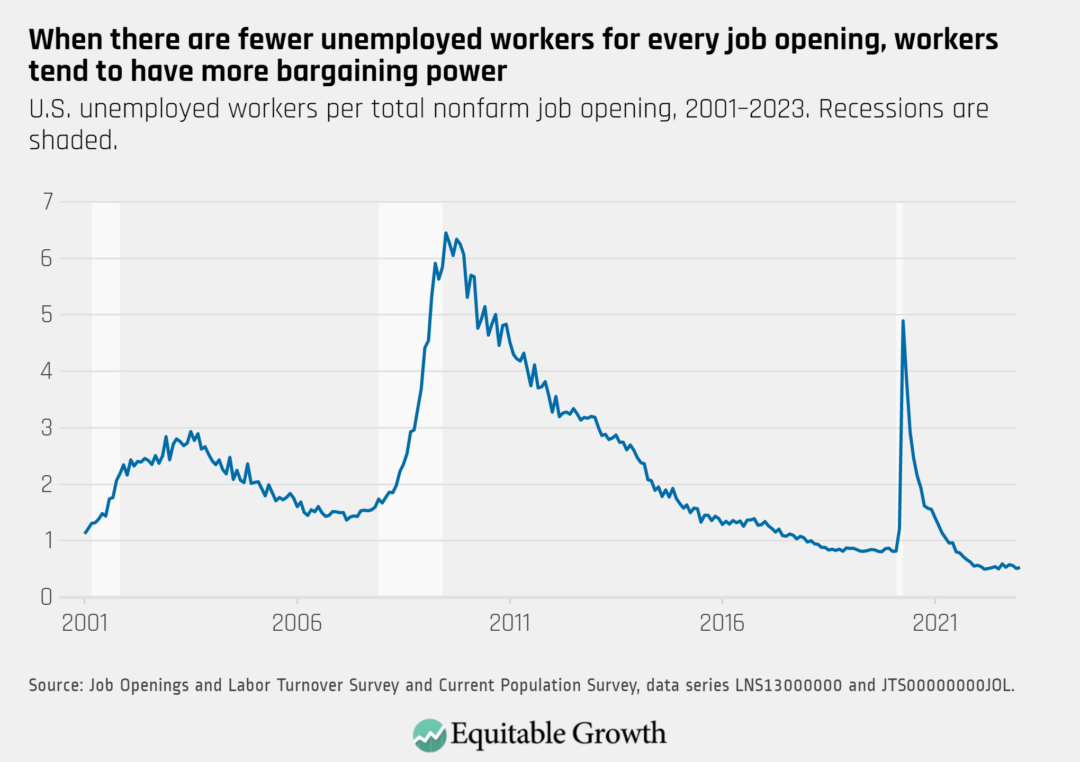
The ratio of unemployed workers to job openings increased to almost 0.53 in January from less than 0.51 in December.

U.S. unemployed workers per total nonfarm job opening, 2001–2023. Recessions are shaded.

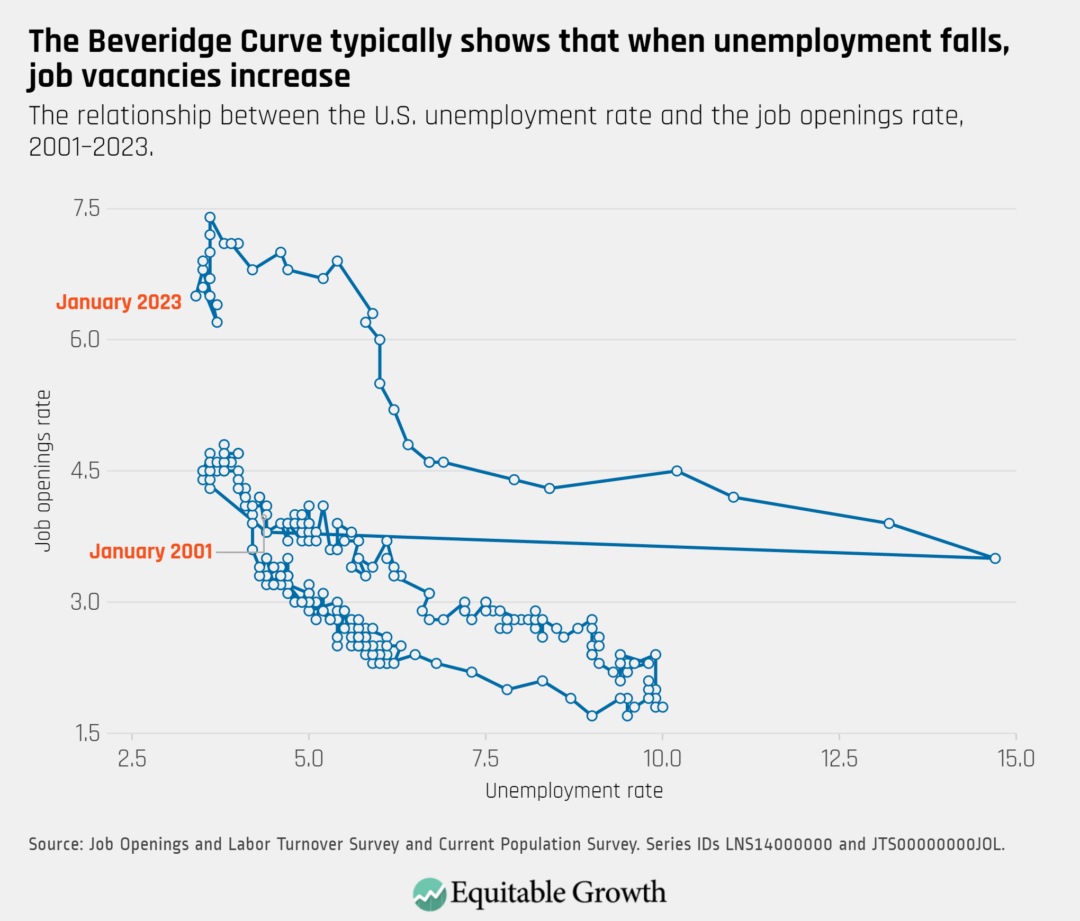
The Beveridge Curve moved inward in January, reflecting declines in both the job openings rate and unemployment rate. 

The relationship between the U.S. unemployment rate and the job openings rate, 2001–2023.

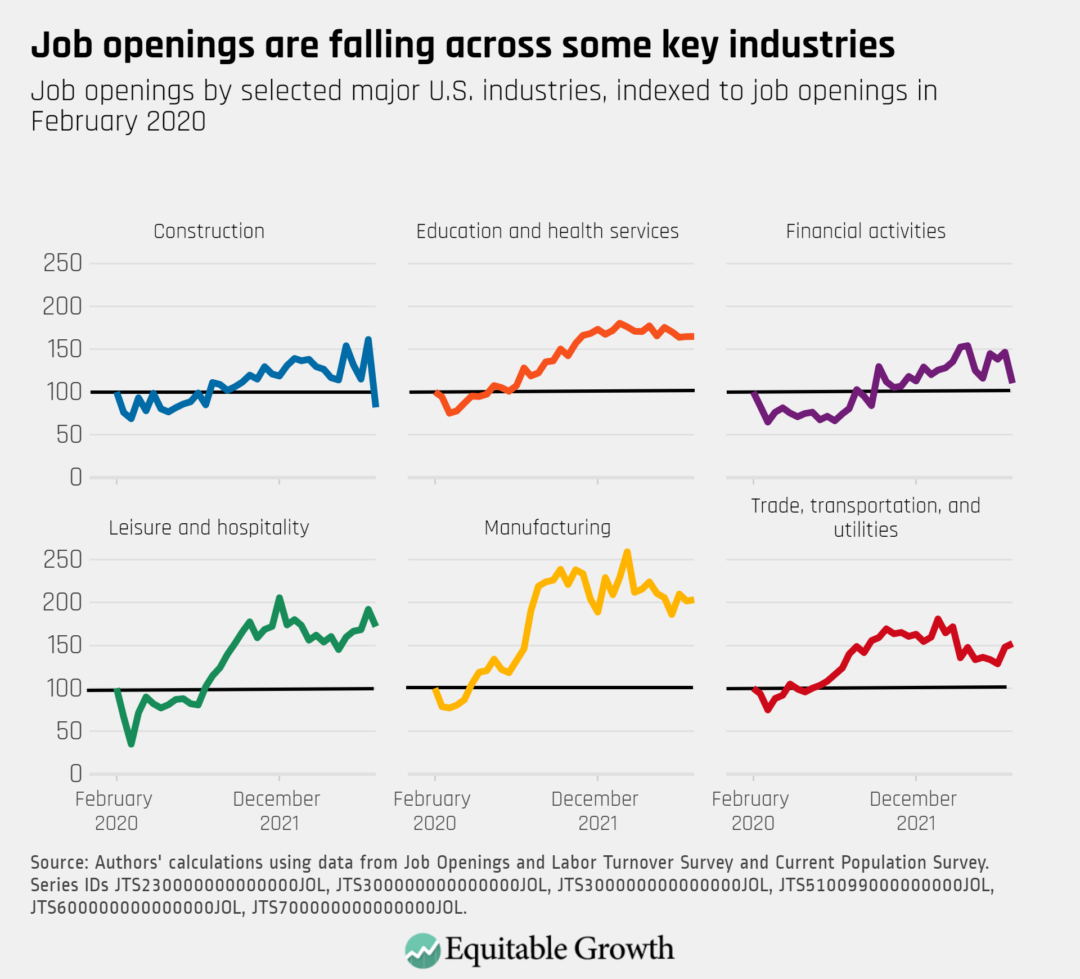
The number of job openings declined in January, including in sectors such as construction, financial activities, and leisure and hospitality.

Job openings by selected major U.S. industries, indexed to job openings in February 2020
Connect with us!

Explore the Equitable Growth network of experts around the country and get answers to today's most pressing questions!

Get in Touch