Equitable Growth’s Jobs Day Graphs: February 2023 Report Edition
On March 10, the U.S. Bureau of Labor Statistics released new data on the U.S. labor market during the month of February. Below are five graphs compiled by Equitable Growth staff highlighting important trends in the data.
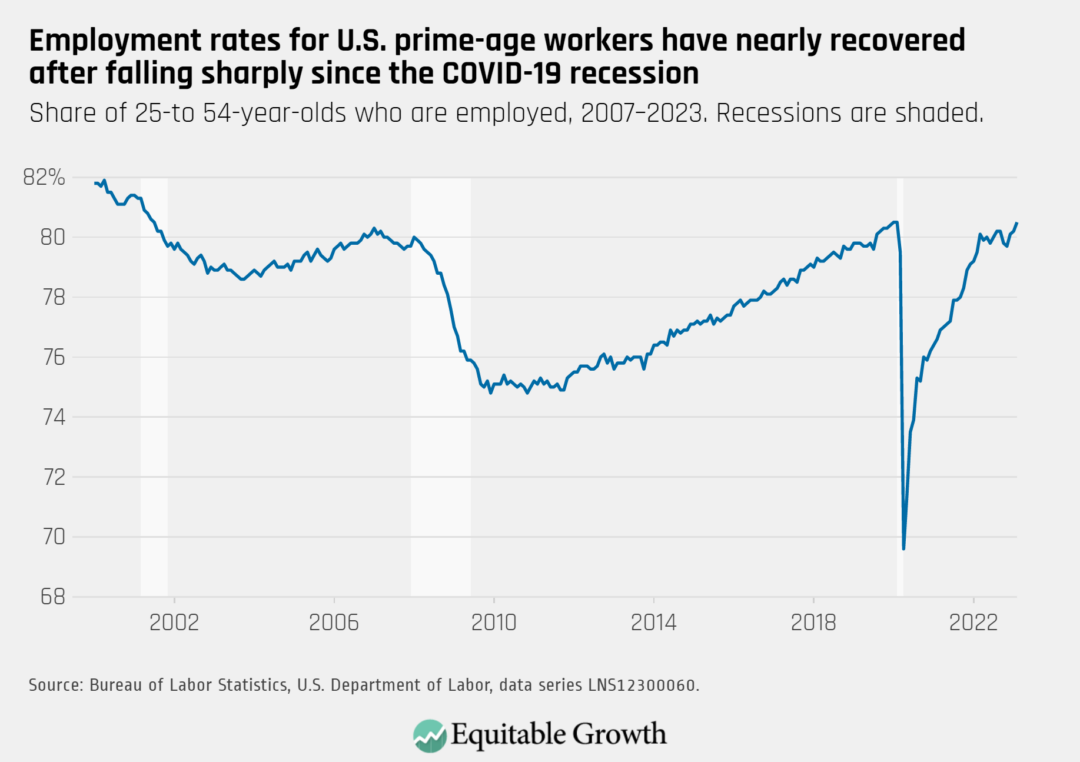
The employment rate for prime-age workers increased from 80.2 percent in January to 80.5 percent in February as total nonfarm employment rose by 311,000.
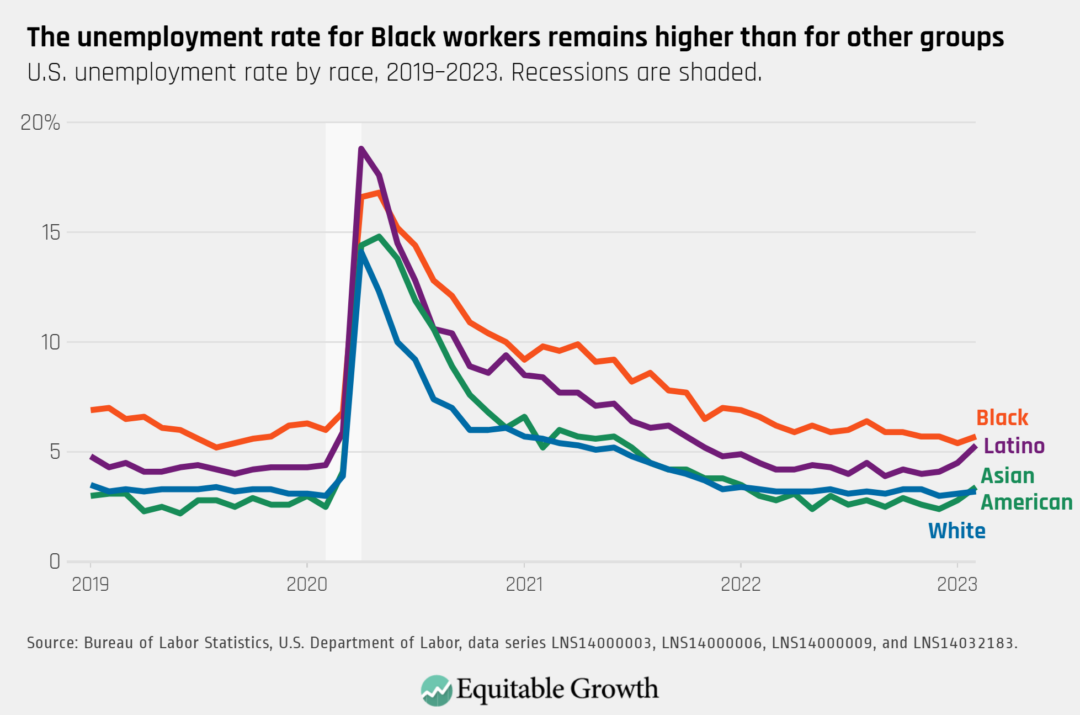
The unemployment rate increased to 3.6 percent in February, and is highest for Black workers (5.7 percent) and Latino workers (5.3 percent), compared to White workers (3.2 percent) and Asian American workers (3.4 percent).
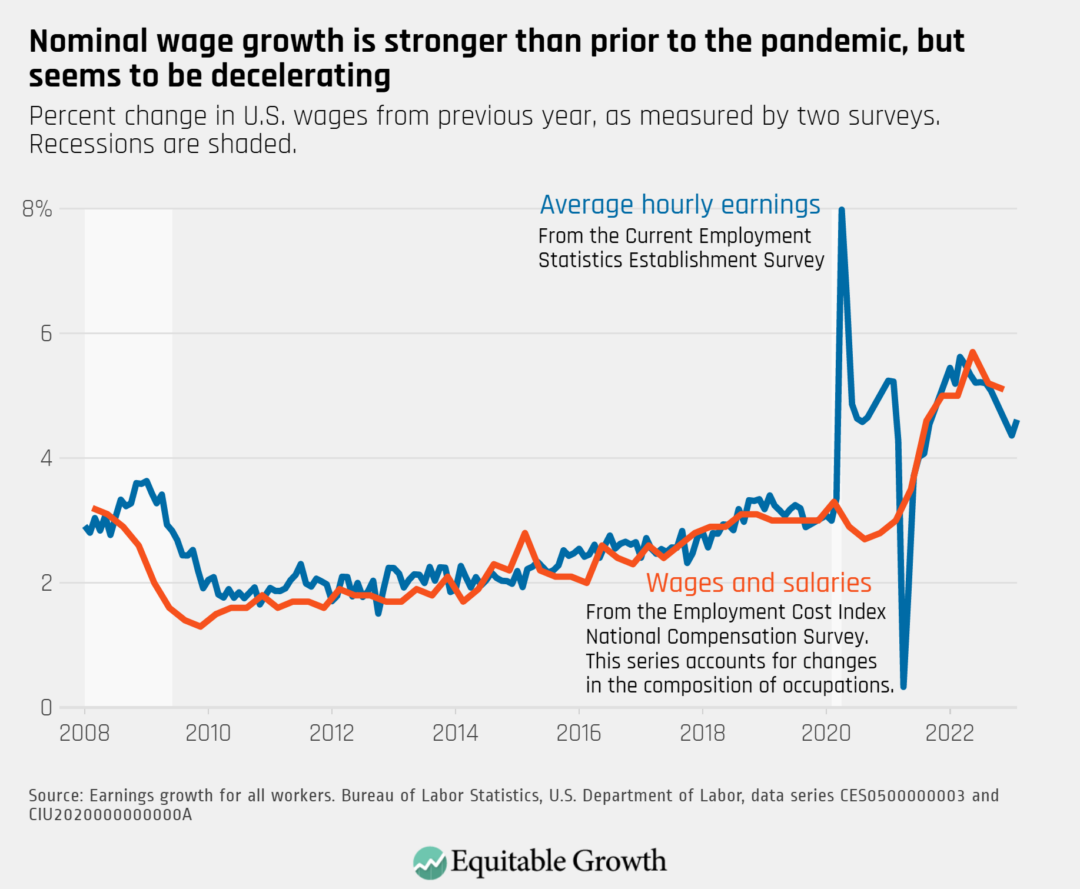
Nominal wage growth (not accounting for inflation) did not change dramatically in February, with average hourly earnings growth at 4.62 percent over the past 12 months.
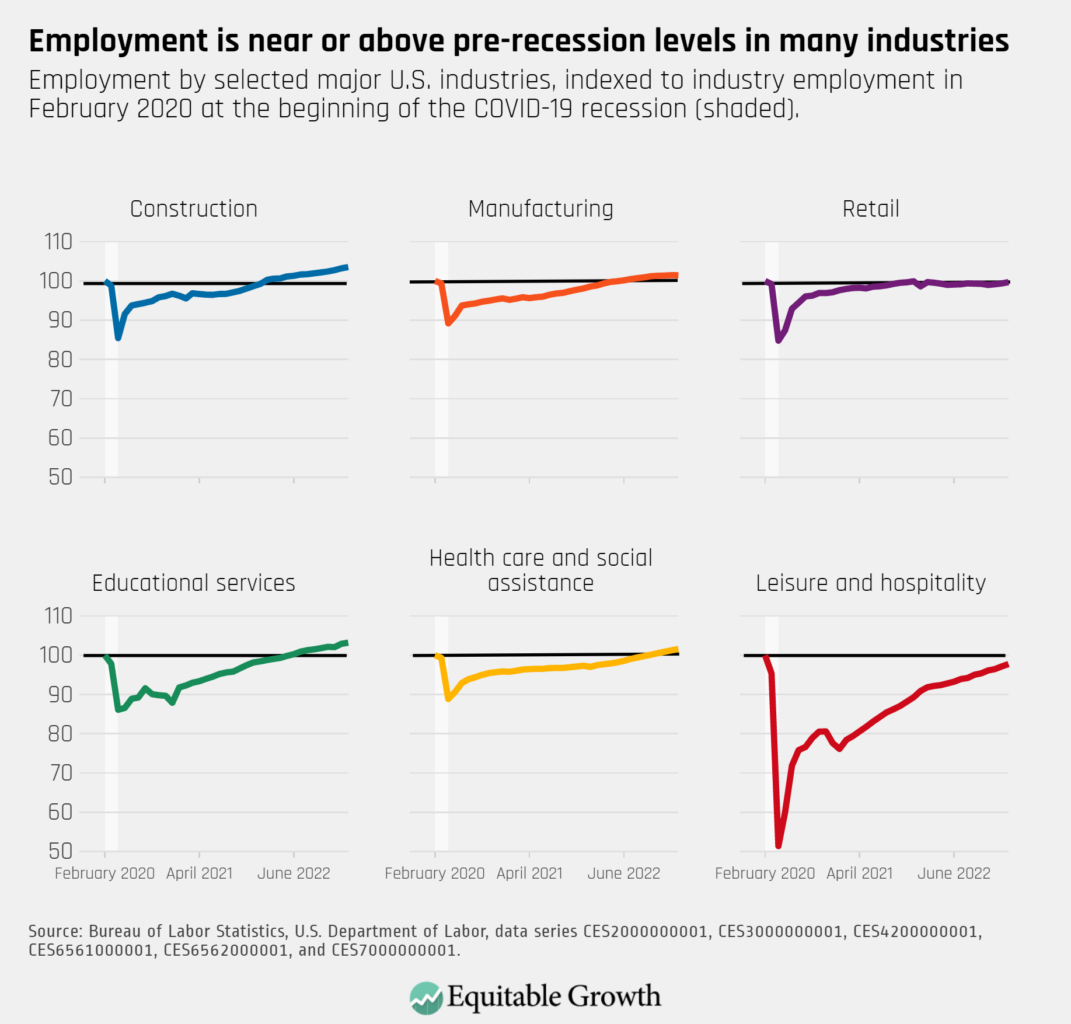
Employment in many sectors, including construction, retail, and educational services is now back to or surpassing pre-pandemic levels. Employment in leisure and hospitality has not quite recovered, but added 105,000 jobs in February.
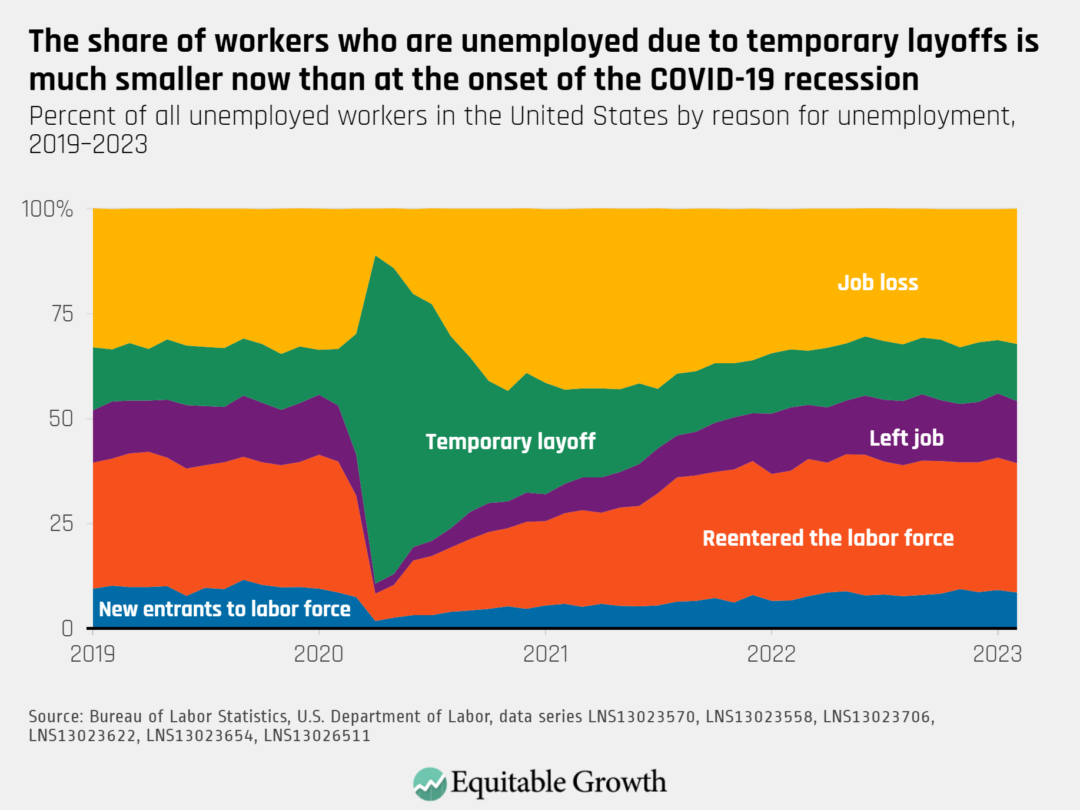
The share of unemployed workers who are unemployed due to job loss increased to 32.2 percent, and the share on temporary layoffs rose to 13.6 percent; the share who left their jobs (14.8 percent), are reentering the labor force (30.8 percent), or are new entrants (8.6 percent) declined.