Equitable Growth’s Jobs Day Graphs: May 2023 Report Edition
On June 2nd, the U.S. Bureau of Labor Statistics released new data on the U.S. labor market during the month of May. Below are five graphs compiled by Equitable Growth staff highlighting important trends in the data.
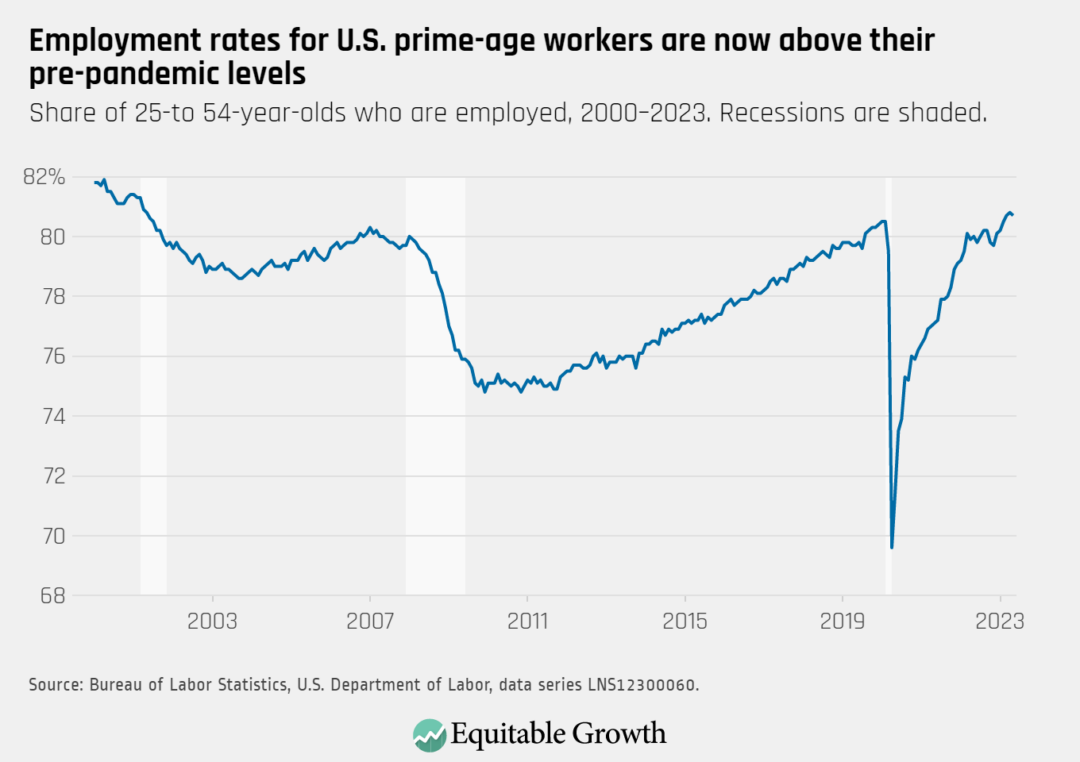
The U.S. labor market added 339,000 jobs last month, but the employment-rate for prime-age workers fell slightly from 80.8 percent in April to 80.7 percent in May.
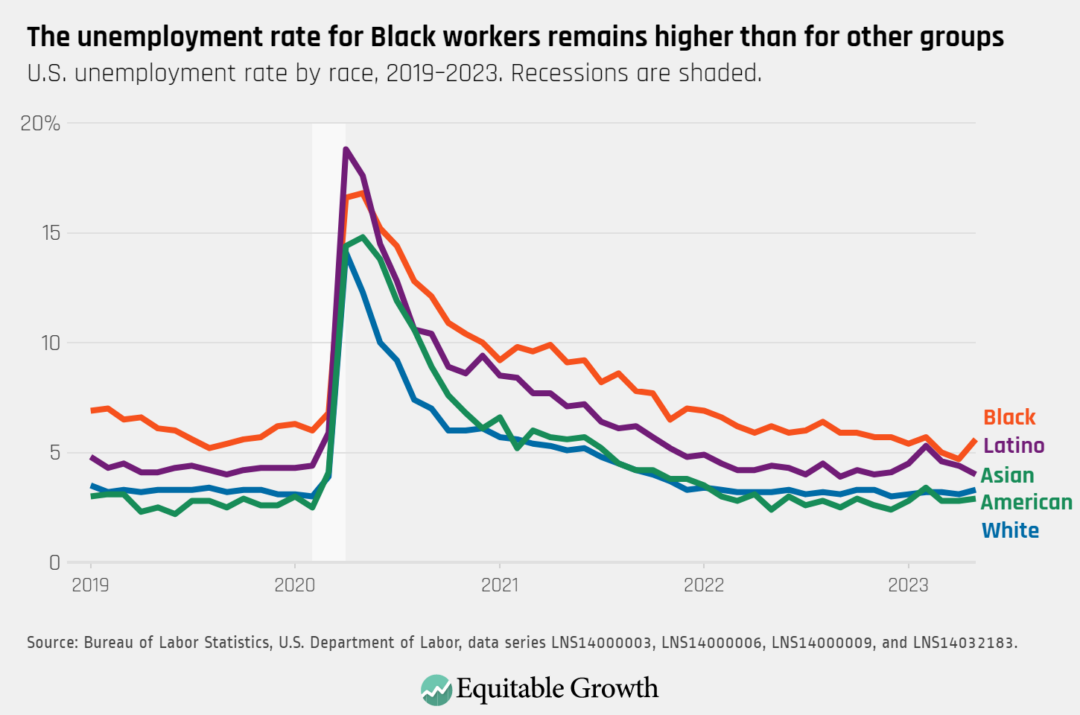
The national unemployment rate rose to 3.7 percent in May, with increases for White workers (3.3), Asian American workers (2.9), and Black workers (5.6). The jobless rate for Latino workers declined to 4 percent.
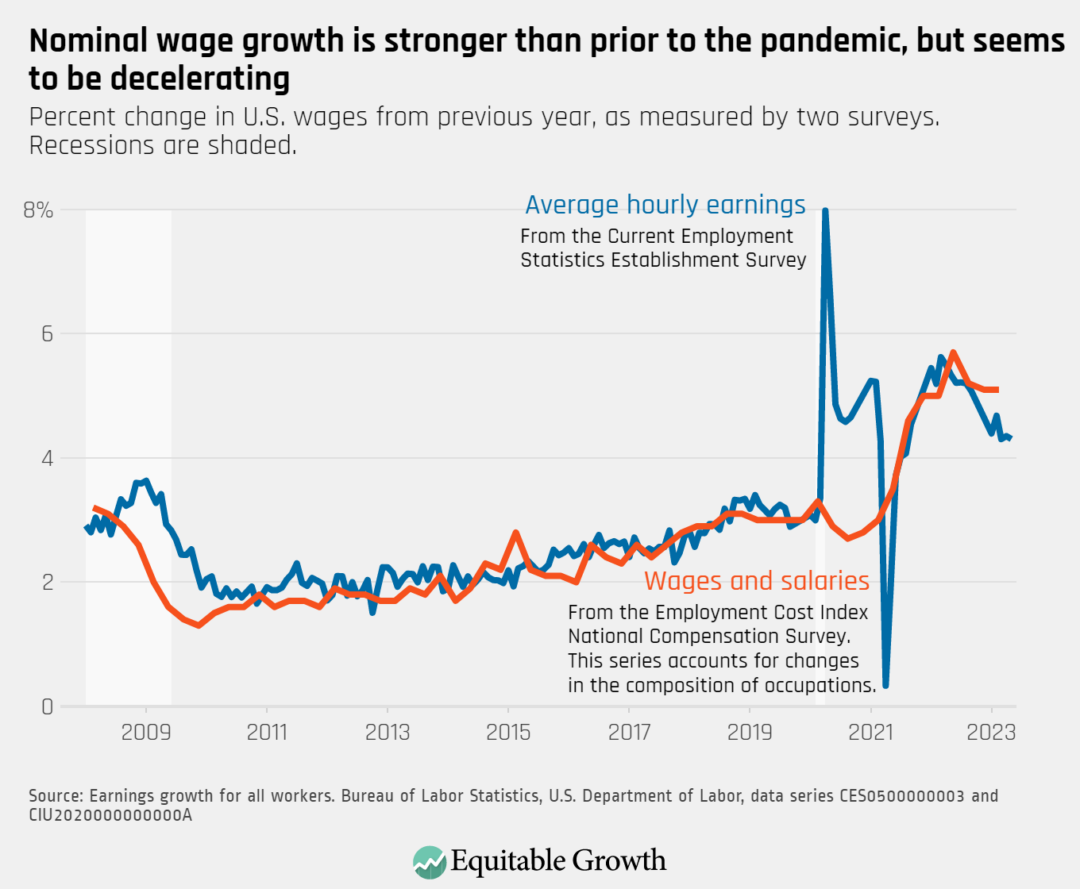
Year-over-year nominal wage growth (not accounting for inflation) declined slightly in May, with average hourly earnings growth at 4.3 percent over the past 12 months.
Net job gains were particularly strong in private education and health services (+97,000) and professional business services (+64,000). The manufacturing and information industries reported net employment losses in May.
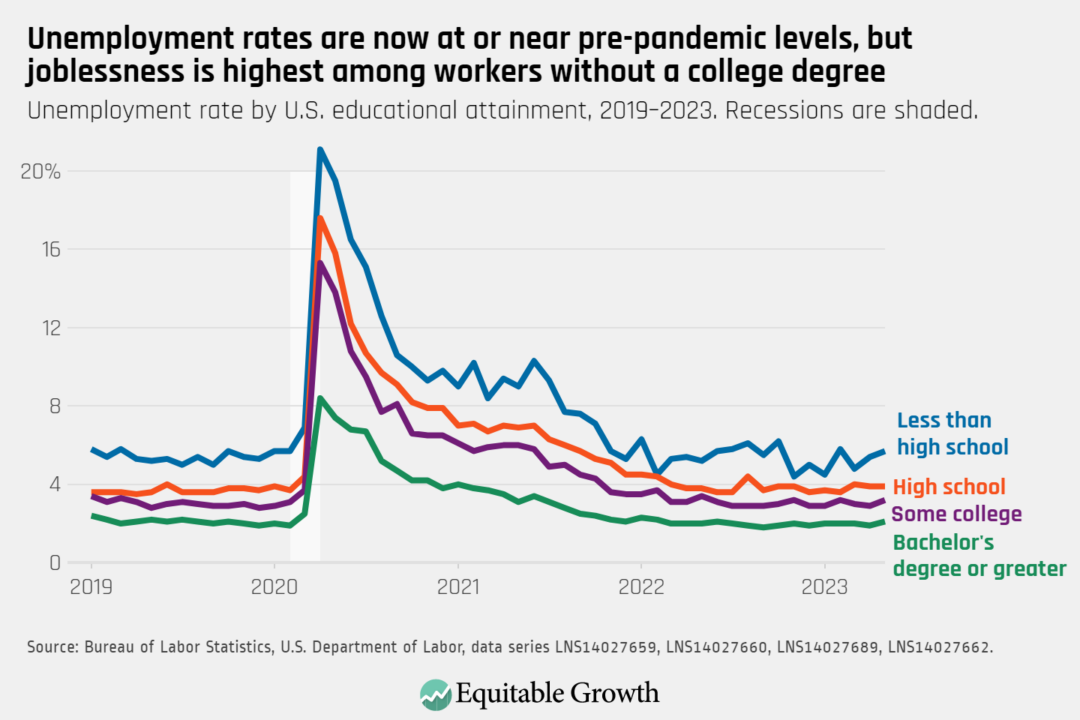
The unemployment rate for workers without a high school degree ticked up to 5.7 percent, and is consistently higher than for workers with high school (3.9 percent), some college (3.2), and a bachelor’s degree (2.1).