JOLTS Day Graphs: May 2023 Edition
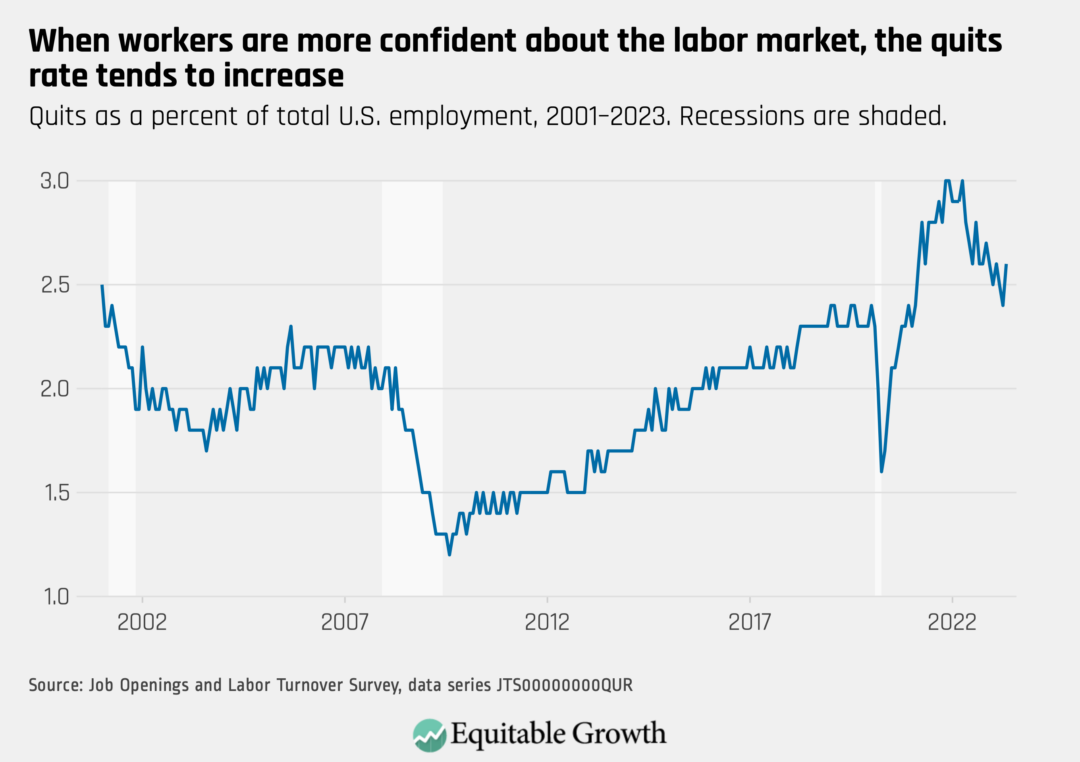
The quits rate rose from to 2.4 percent in April to 2.6 percent in May as more than 4 million workers quit their jobs.
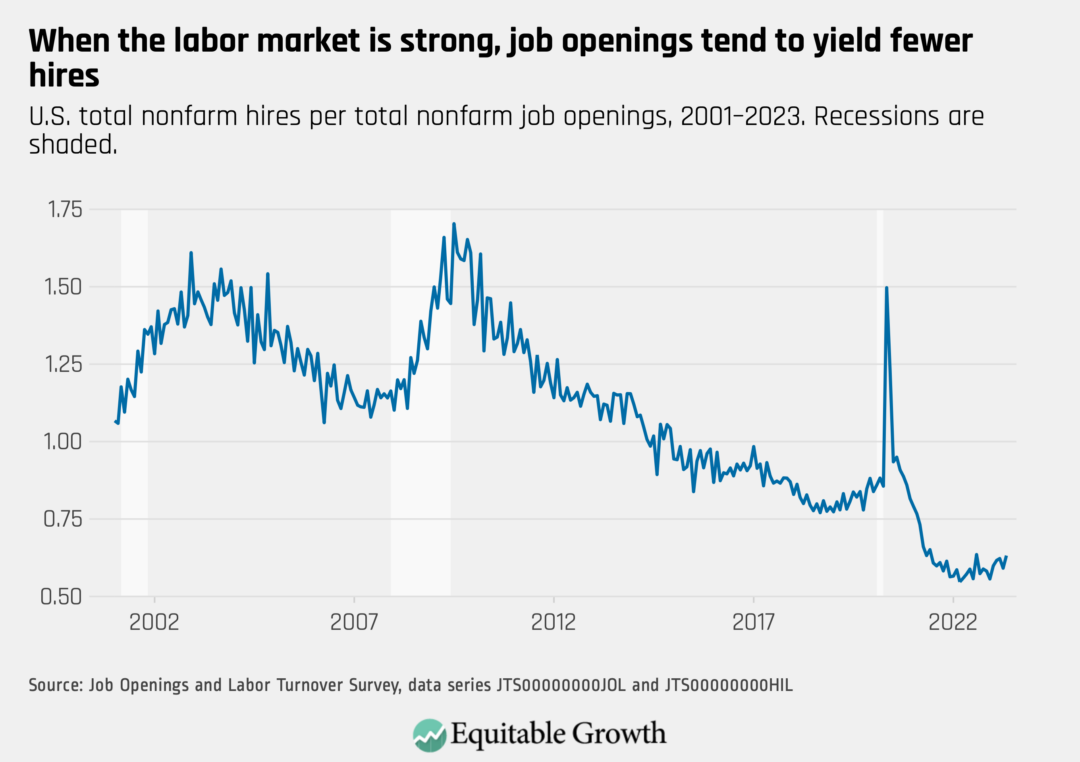
The vacancy yield, a measure that captures how easy it is for employers to fill open positions, rose in May as job openings fell to 9.8 million and hires increased to 6.3 million.
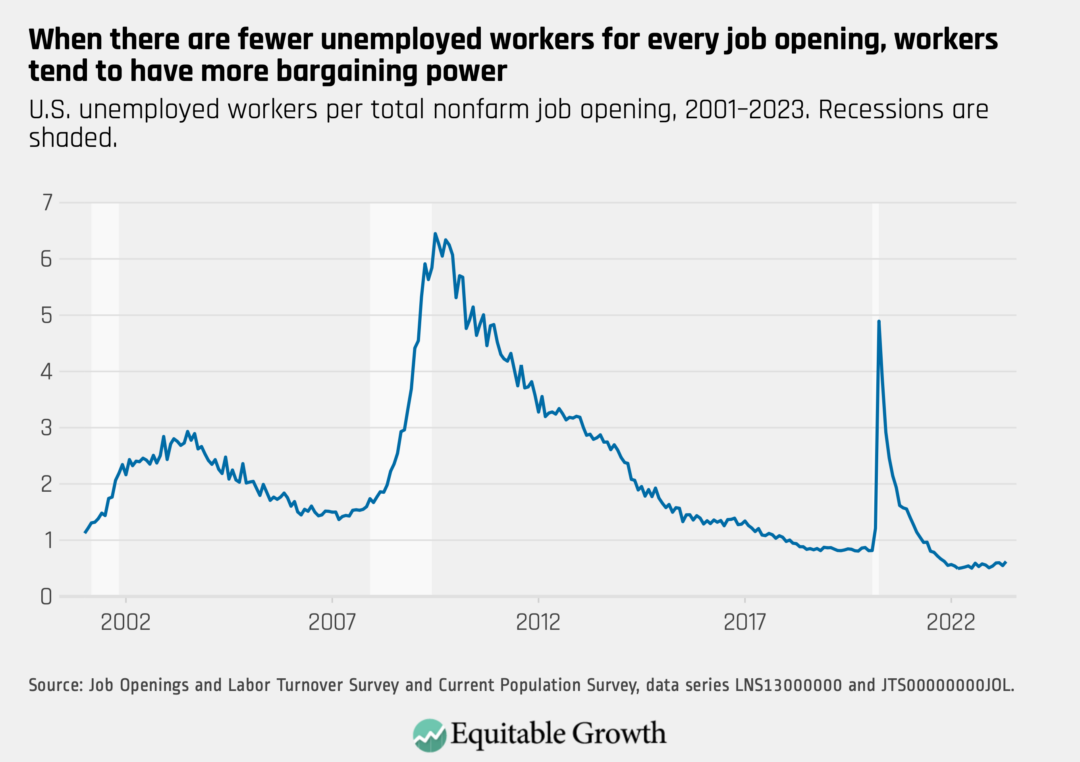
The ratio of unemployed workers to job openings increased slightly in May, as the number of job openings saw a bigger drop than the number of unemployed workers.
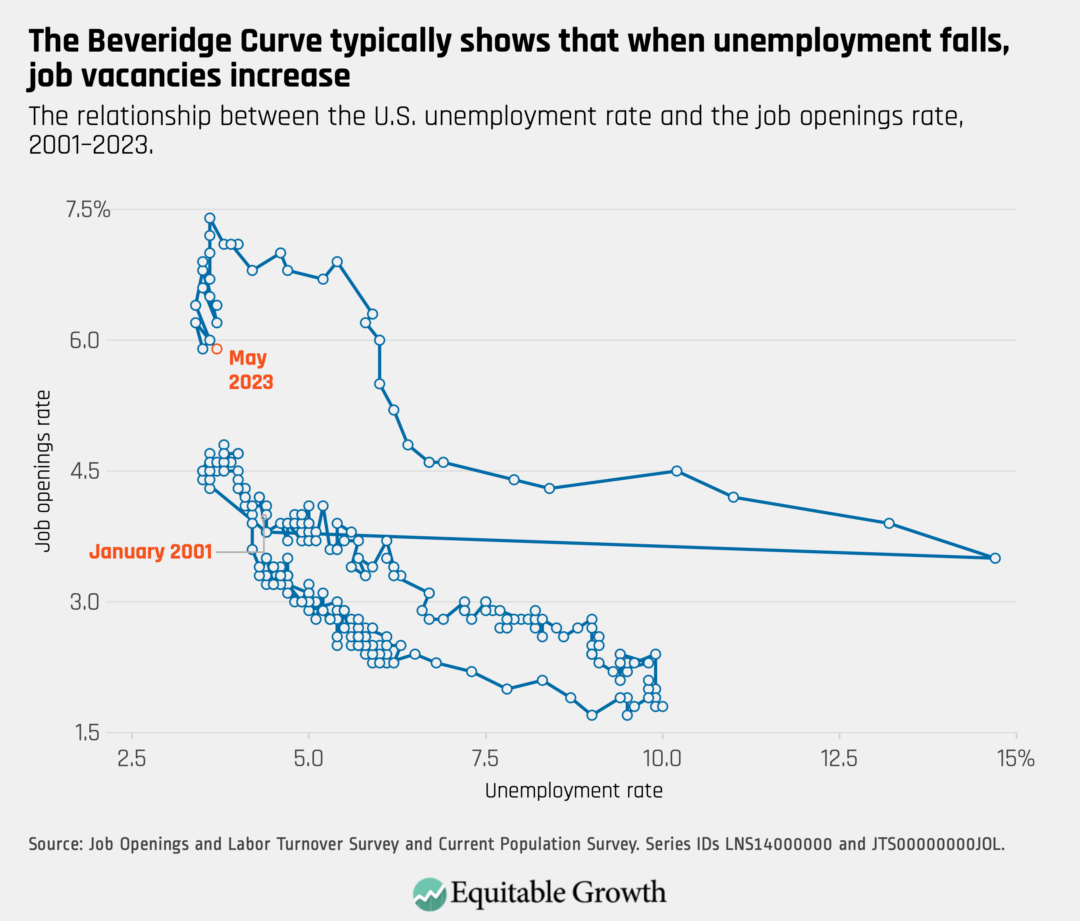
The Beveridge Curve, which usually captures that there tend to be relatively more open positions when the labor market is strong, moved inwards and down as the unemployment rate increased and the job openings rate fell in May.
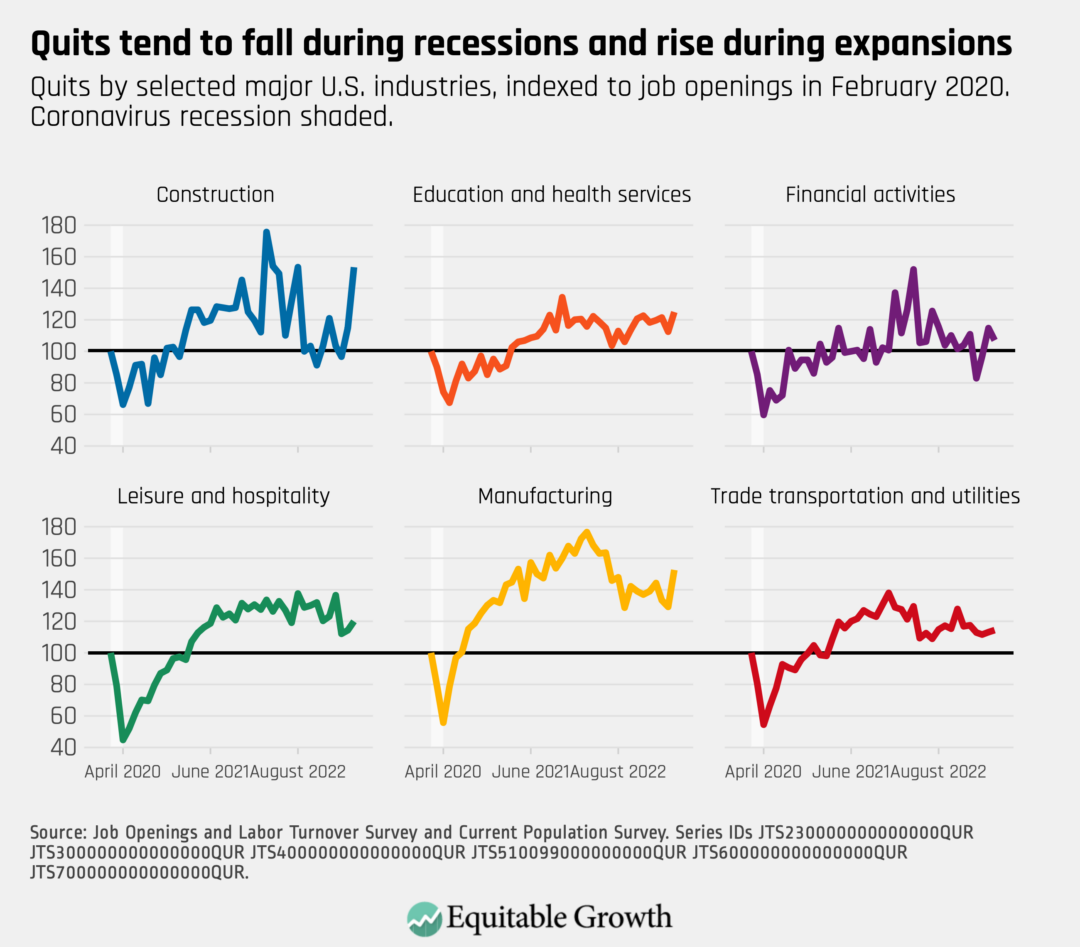
Most industries experienced an increase in quits in May. There was an especially sharp rise in the construction sector, where the quits rate increased from 2.1 percent to 2.9 percent.