Despite the important role that child care plays in the lives of many U.S. families, the private child care market is not meeting their needs. This is not just an issue for families with young children in the United States—accessible, affordable, and high-quality care also has the potential to generate substantial economic activity and growth that benefits the entire economy.1
Public investments in child care can help eliminate the drag on growth that the lack of child care options creates. These investments, in turn, facilitate economic gains for families, businesses, and the U.S. economy as a whole.
This factsheet will review the research on the short- and long-term economic growth potential of a high-quality, accessible, and affordable early care and education system as well as the evidence supporting greater public investment in this market. For more information, see Equitable Growth’s companion report on the child care economy.
The current child care market doesn’t meet U.S. families’ needs
- Licensed child care is hard to find. Roughly half of U.S. families live in “child care deserts,” or U.S. Census Bureau tracts where there are three young children for every licensed child care slot.2
- In recent years, it has gotten even harder to find licensed child care options. Overall, the number of licensed child care facilities shrunk by nearly 32 percent in recent decades, primarily due to small in-home providers exiting the market. From 2005 through 2017, nearly half of these providers left the market.3 The coronavirus pandemic has only worsened these supply challenges.
- When families can find child care, it is often unaffordable. In 2019, the average annual price of center-based care was more than $11,000 for infants and more than $9,000 for 4-year-olds.4 In 28 states, the annual price of full-time child care can exceed that of in-state college tuition.5
- Insufficient child care options can prevent parents who wish to work from doing so, with mothers often bearing the brunt of this challenge. Among parents who wish to work, child-rearing tends to interfere with women’s labor supply and employment outcomes more than men’s. 6 This leaves potential economic growth unrealized, as women’s labor force participation is significantly associated with Gross Domestic Product growth.7
Accessible and affordable early care and education options can help parents who wish to work do so, promoting economic growth in the short term
- When more child care options are available, labor force participation increases. A 2007 study using data from Maryland finds that when there are more child care options nearby, women’s labor supply increases. For every 100 additional child care slots, the women’s labor force participation rate goes up by 0.3 percentage points.8
- When the price of child care decreases, maternal employment increases. Studies generally find that a 10 percent reduction in child care costs increases maternal employment between 0.25 percent and 11 percent, with more precise estimates suggesting a 0.5 percent to 2.5 percent increase.9 This leads to greater household economic security and higher consumer spending, a larger labor pool from which employers can find workers, and, ultimately, short- and long-term economic growth.
- Dependable and affordable child care options keep parents in the workforce, which benefits employers who count on dependable workers. A 2008 study of mothers in low-wage jobs found that 19 percent stopped working entirely in the same quarter in which they experienced a disruption to their child care arrangements, compared to only 9 percent who did not experience such a disruption.10
High-quality early care and education promotes long-term economic growth because the workers of tomorrow develop their skills early
- High-quality early care and education provides critical socialization and learning opportunities when the brain is developing rapidly and is particularly responsive to the outside environment.11 Young children in pre-Kindergarten programs experience positive developmental outcomes and are better prepared for school, scoring higher than their peers on standardized measures of reading, spelling, math, and problem-solving skills.12
- The positive human capital development effects persist long past childhood.13 One study shows that 40-year-olds who participated in the High/Scope Perry Preschool program as children were significantly more likely to be employed, uninvolved with the criminal justice system, and become high school graduates and high earners than their peers who did not complete the program.14 (See Figure 1.)
Figure 1
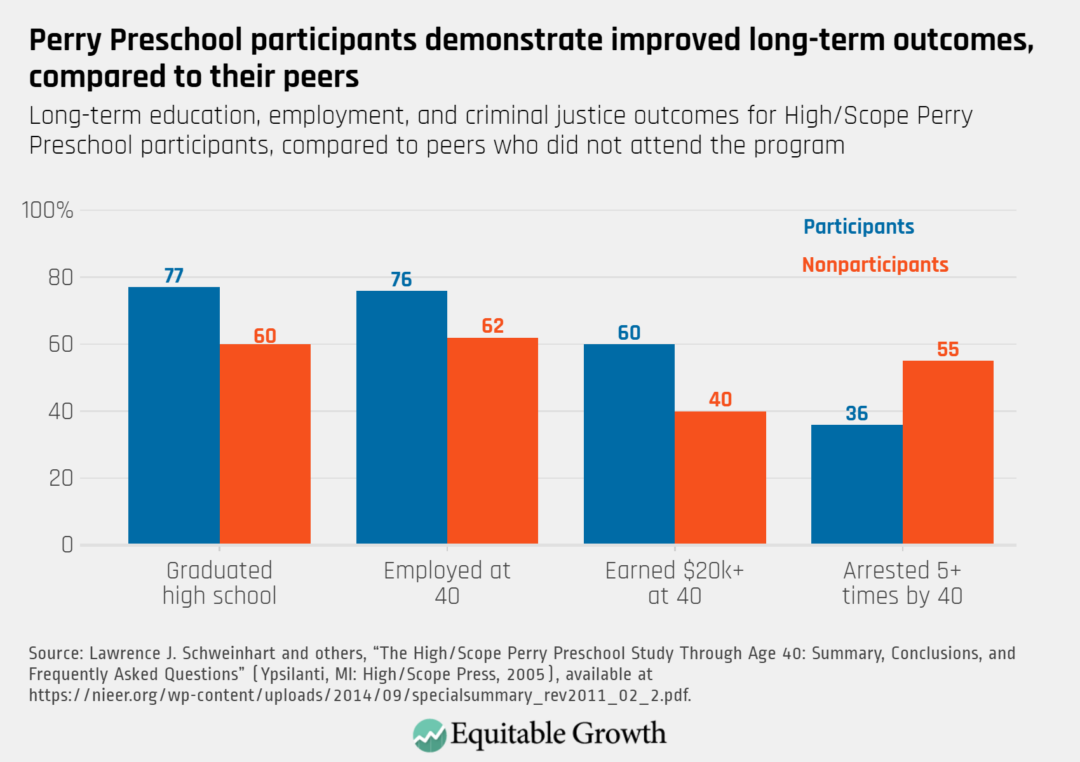
- Similarly, enrollment in Boston’s universal preschools increases the likelihood of high school graduation by 6 percentage points, SAT completion by 9 percentage points, and on-time college enrollment by 8 percentage points, as well as decreases the likelihood of juvenile justice system involvement and school suspensions by 1 percentage point and 2 percentage points, respectively.15
Greater public investment is needed to unlock the full economic potential of high-quality early care and education
- Child care subsidies can increase employment among mothers. In one 2020 study, a 10 percent increase in child care subsidies was associated with a 2 percent increase in employment among married mothers. Prior research also indicates that a $100 increase in child care subsidies could increase employment among single mothers by 2 percentage points.16
- Unfortunately, access to these subsidies remains limited. A recent Government Accountability Office report estimates that only 14 percent of qualifying children receive any subsidies.
- Adequate funding is necessary for human capital development. Subsidy dollar amounts are generally low and primarily cover staffing costs, leaving insufficient funds to invest meaningfully in the activities and materials that promote quality care and education for young children.17 Fully funding the subsidy programs and devoting resources for state-level agencies to assist providers in qualifying for subsidies are two ways in which greater public investment could increase child care availability and quality.
- Supporting child care workers is crucial for promoting quality care and human capital development. Child care workers have a median hourly wage of $12.88, or $26,970 per year.18 Low pay leads to high turnover and high stress in the profession, which can undermine the quality of care that children receive. Using public funds to support higher compensation would help stabilize the child care workforce, ensuring that these workers can afford to stay in their jobs.19
- Investing in the nation’s children is one of the safest bets policymakers can make. Research on early care and education programs finds that $1 in spending generates $8.60 in economic activity. The work of Nobel Prize-winning macroeconomist Paul Romer and others suggests that spending on human capital is one of the most effective ways to use government dollars to strengthen the economy and should be a priority for policymakers who seek to spur economic growth.20
By neglecting the child care market for decades, policymakers have shifted the burden of child care onto the shoulders of U.S. families already bearing the weight of childrearing, employment, and other responsibilities at home—despite research showing that the U.S. economy has much to gain from a functional and equitable child care system.
Addressing the child care crisis has the potential to improve families’ economic security and well-being in the United States, all while accelerating economic growth in the short- and long-term. To do so, policymakers must unburden families with meaningful, targeted, and evidence-based investments in the nation’s early care and education system.
For more information, see Equitable Growth’s report on the child care economy.