JOLTS Day Graphs: August 2021 Edition

Every month the U.S. Bureau of Labor Statistics releases data on hiring, firing, and other labor market flows from the Job Openings and Labor Turnover Survey, better known as JOLTS. Today, the BLS released the latest data for August 2021. This report doesn’t get as much attention as the monthly Employment Situation Report, but it contains useful information about the state of the U.S. labor market. Below are a few key graphs using data from the report.

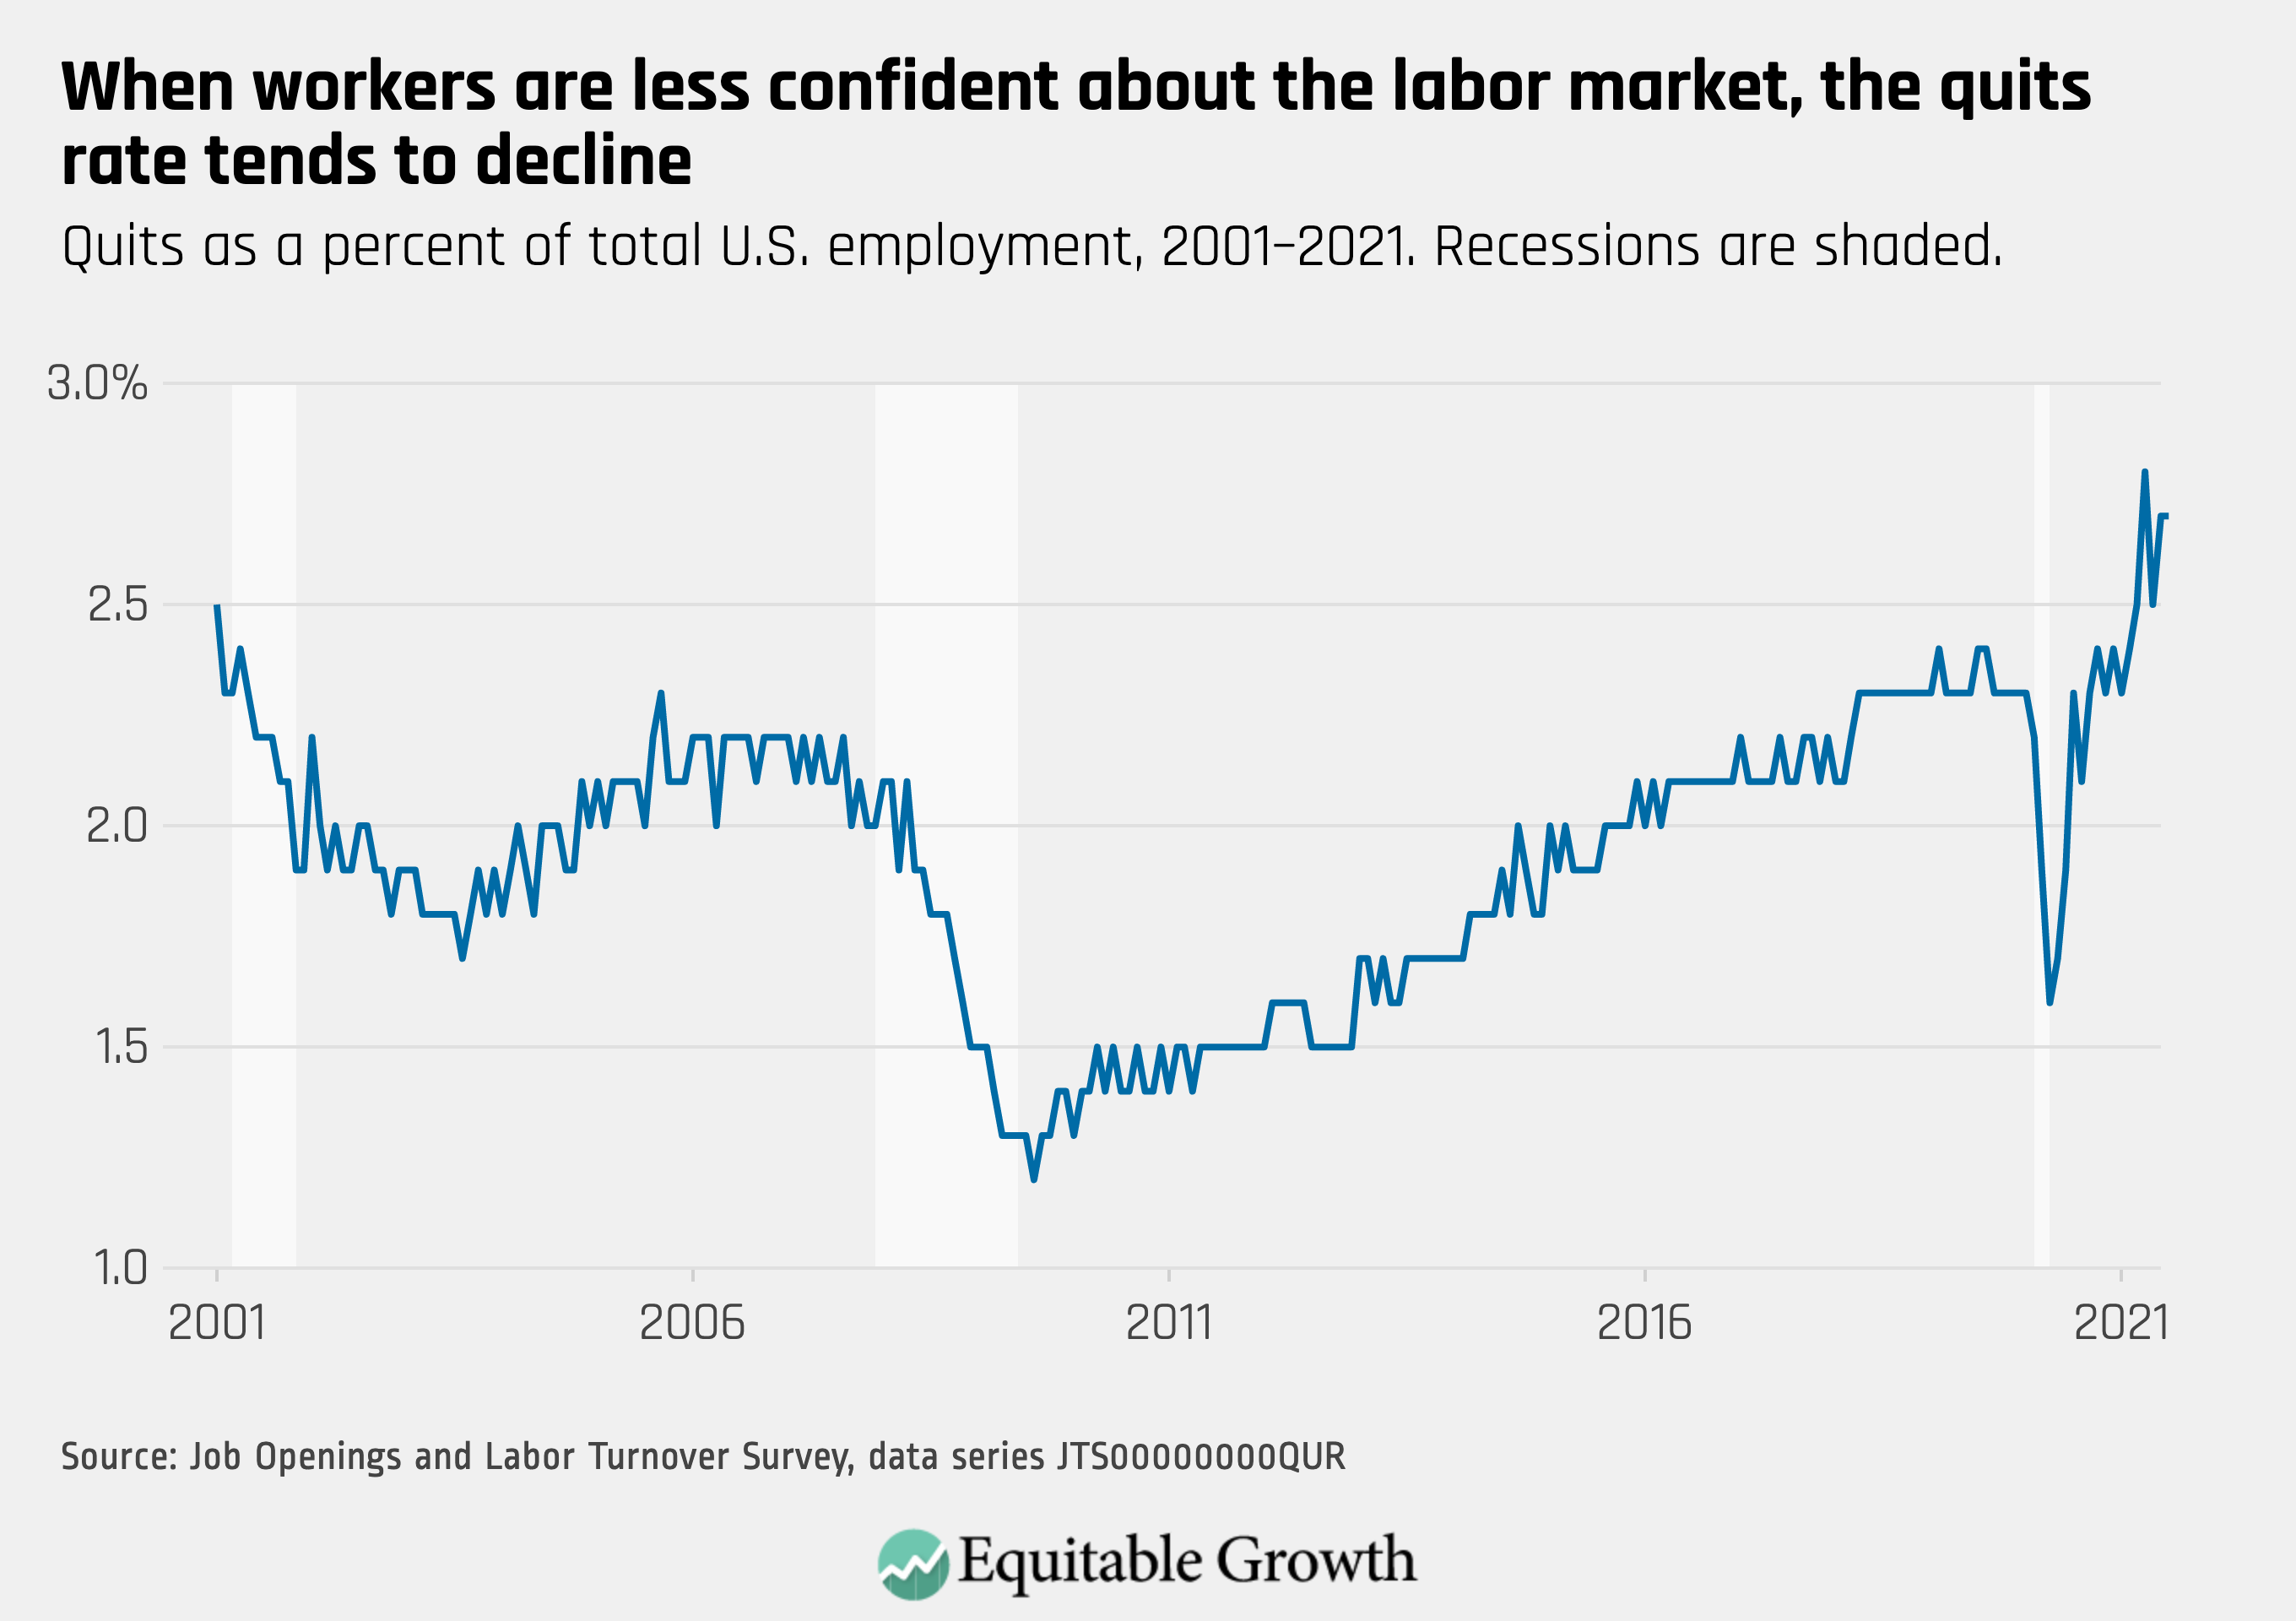
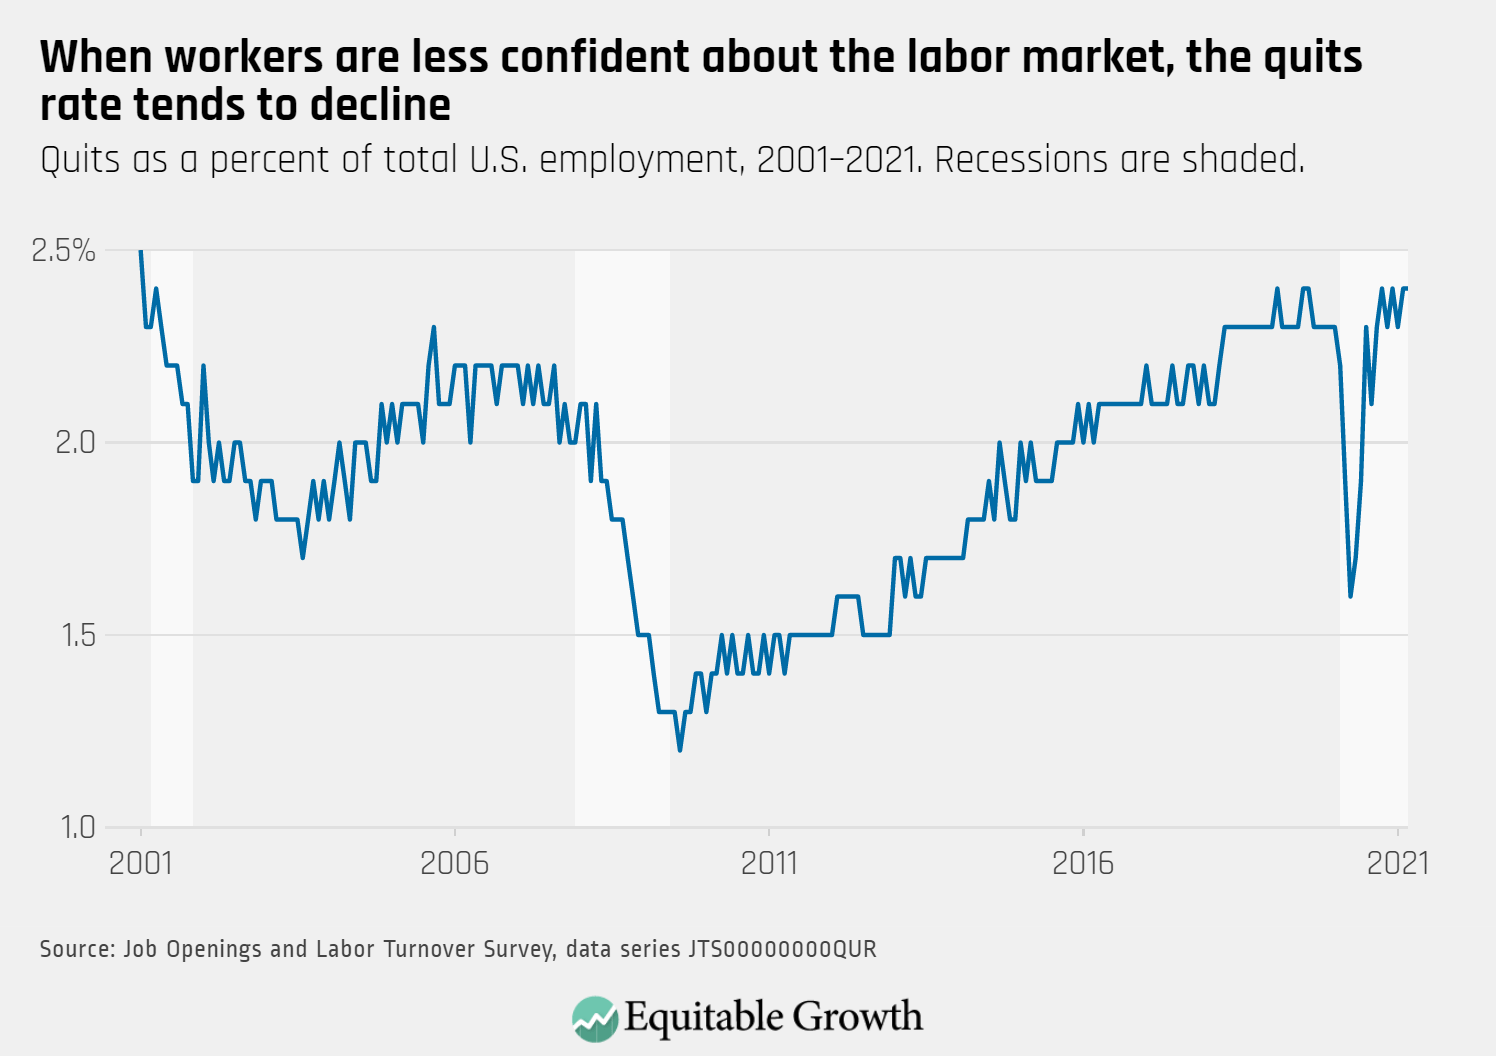
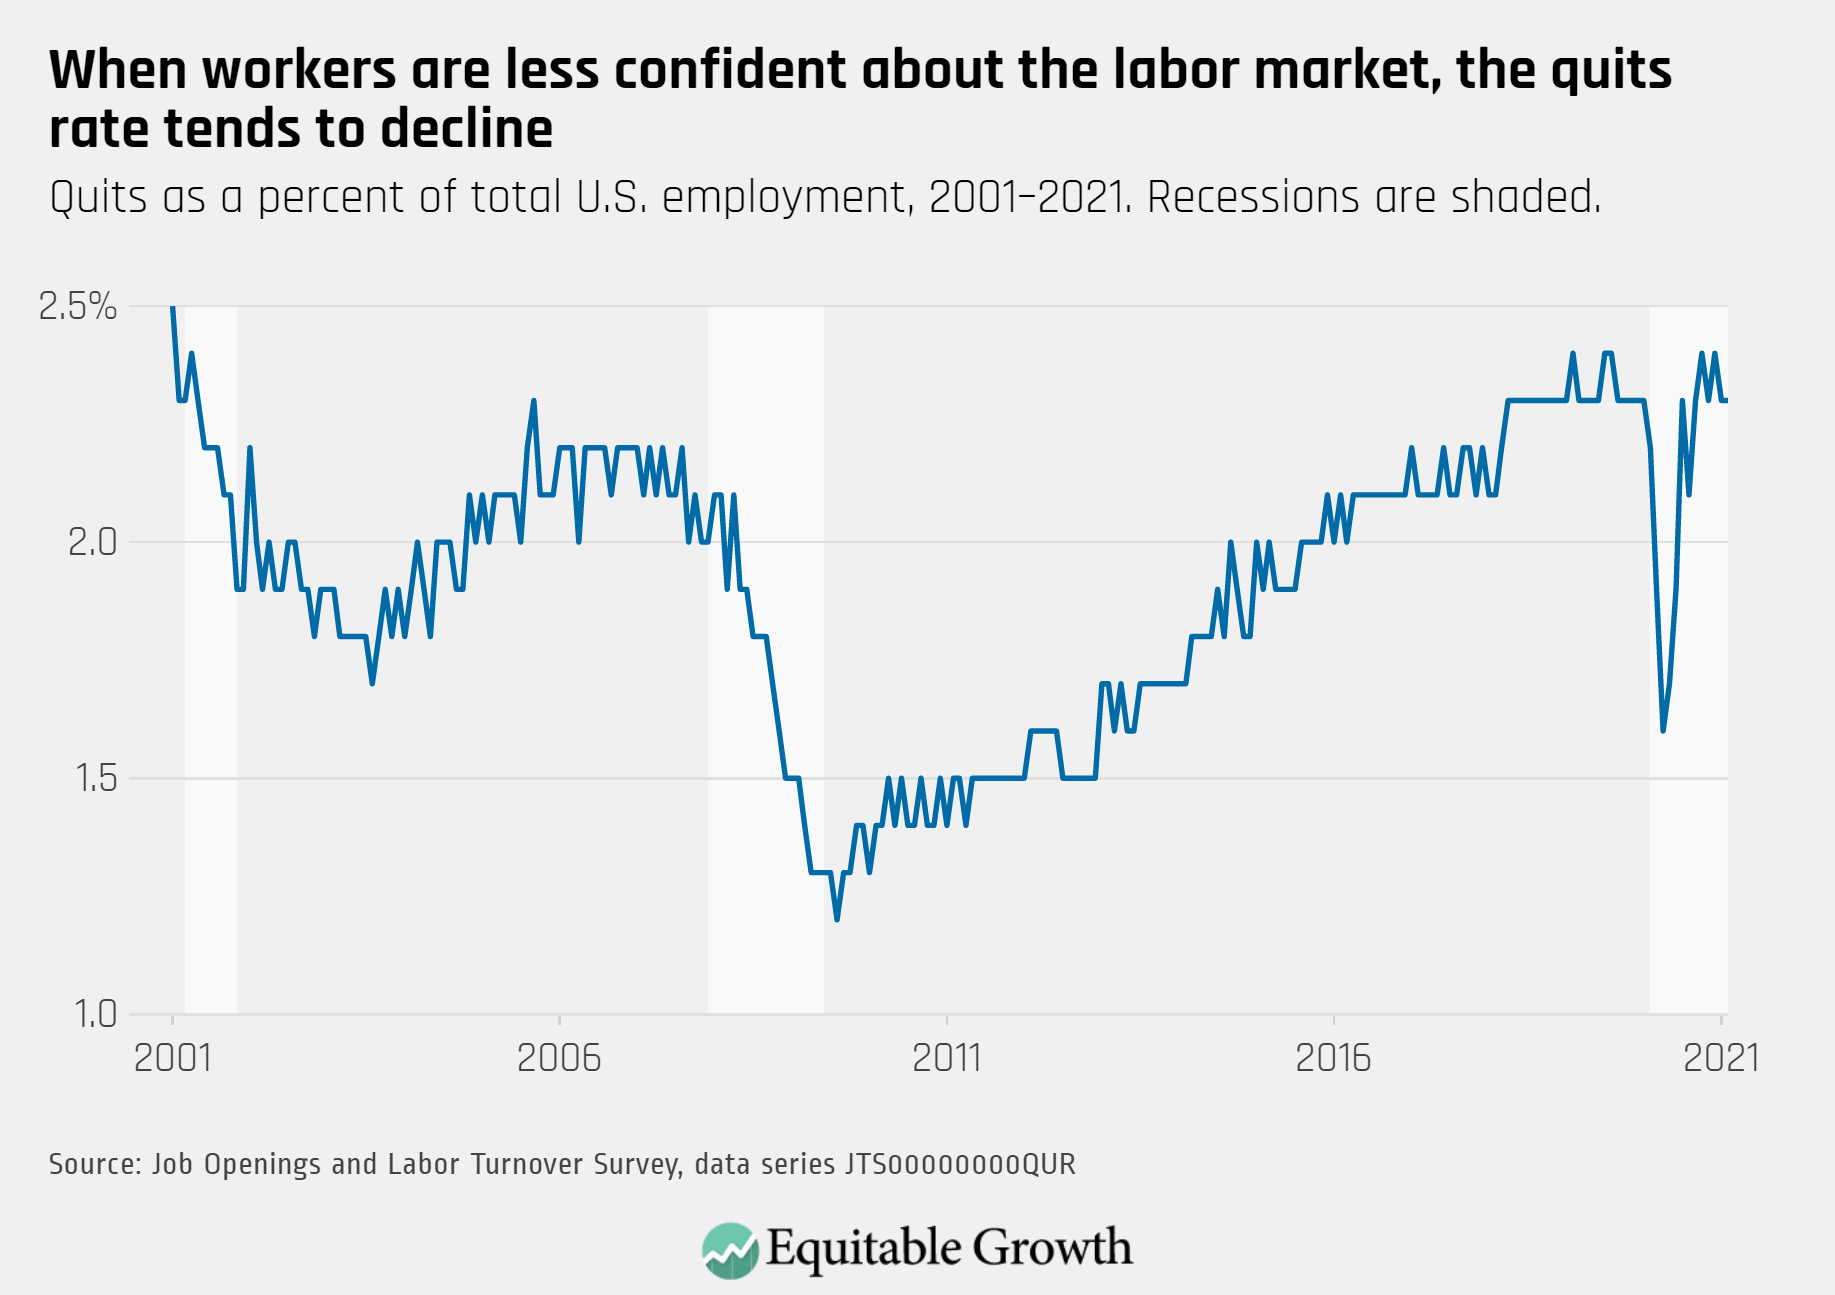
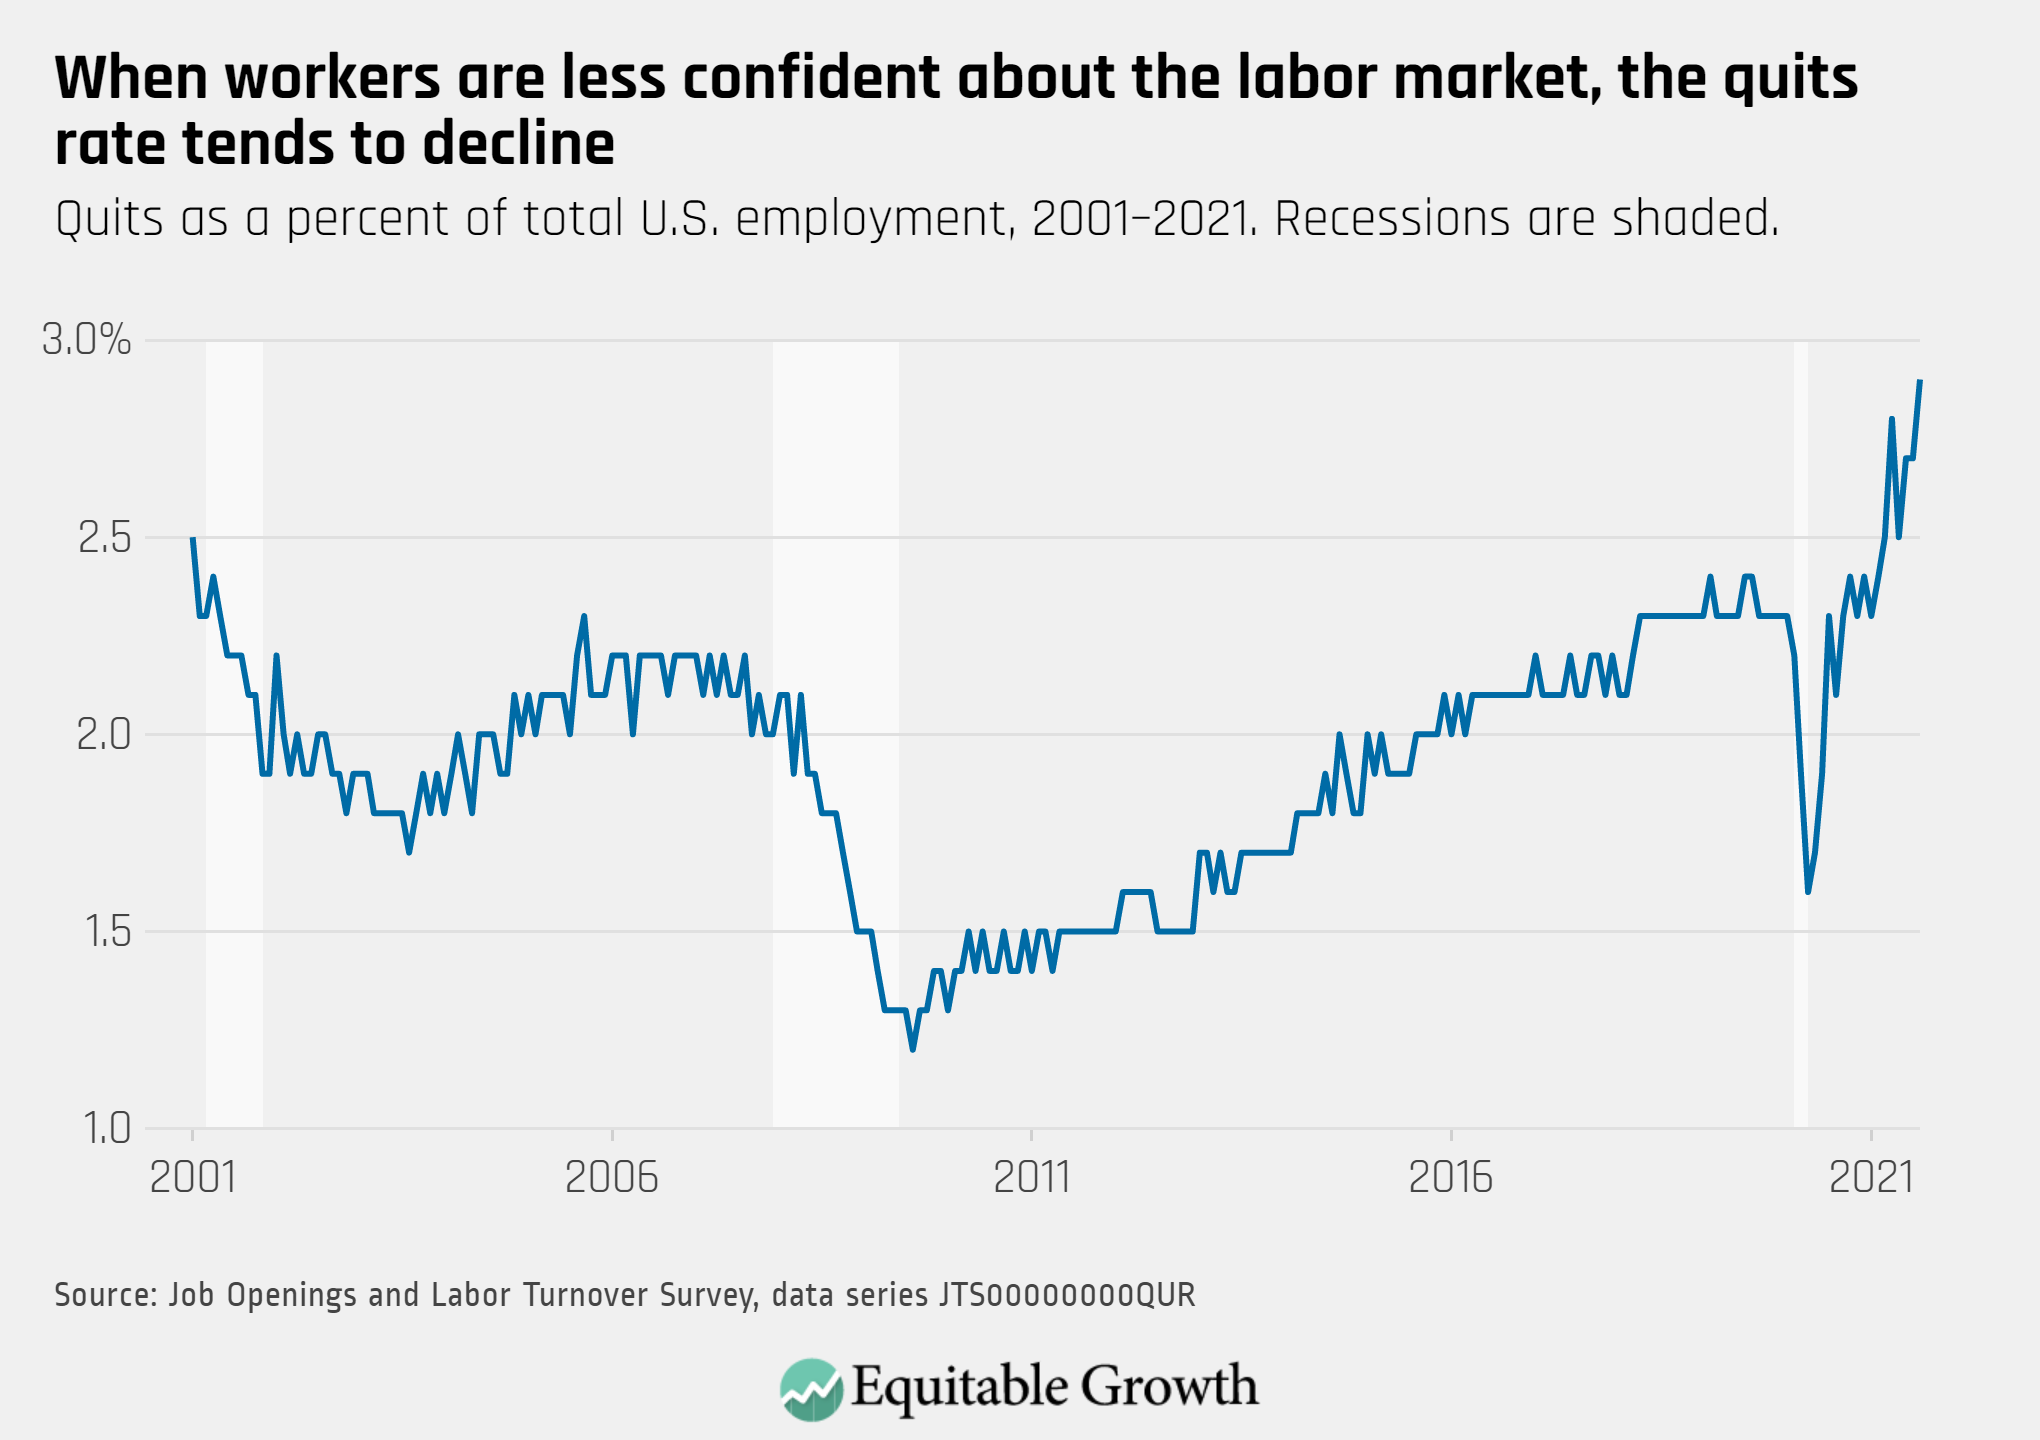
The quits rate rose to 2.9 percent as nearly 4.3 million workers quit their jobs in August, while the job openings rate decreased to 6.6 percent.

Quits as a percent of total U.S. employment, 2001-2021. Recessions are shaded.

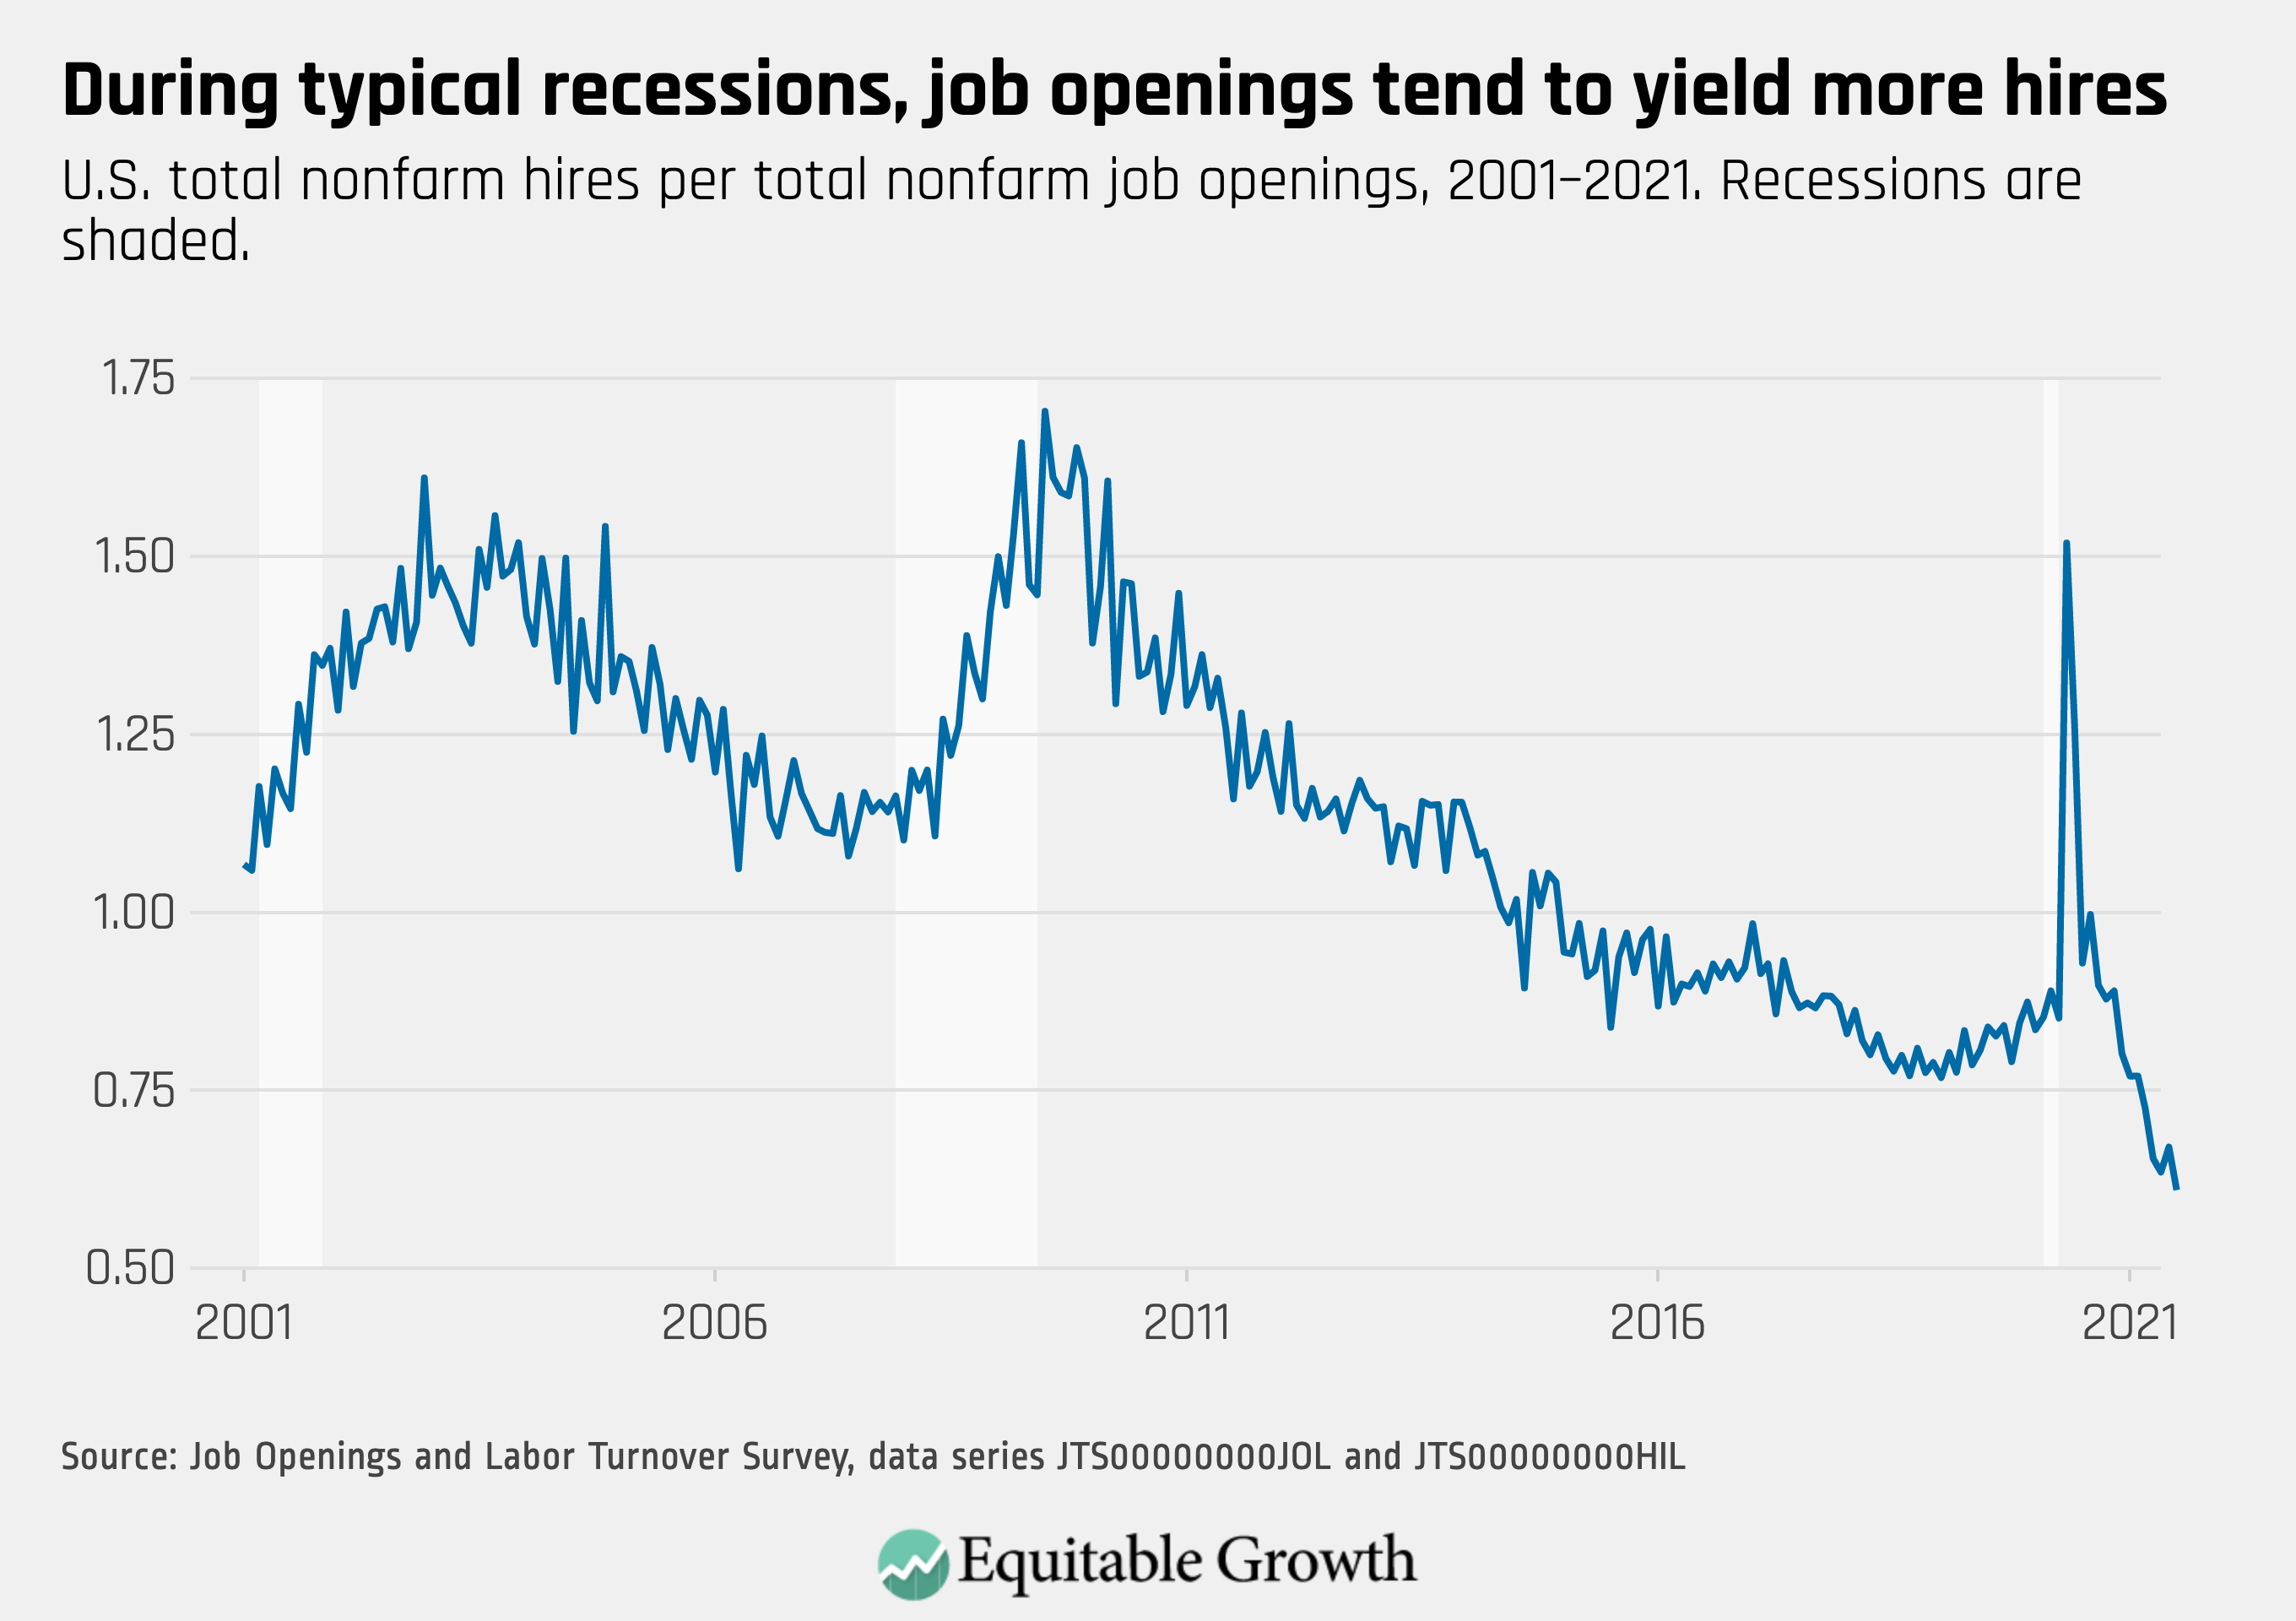
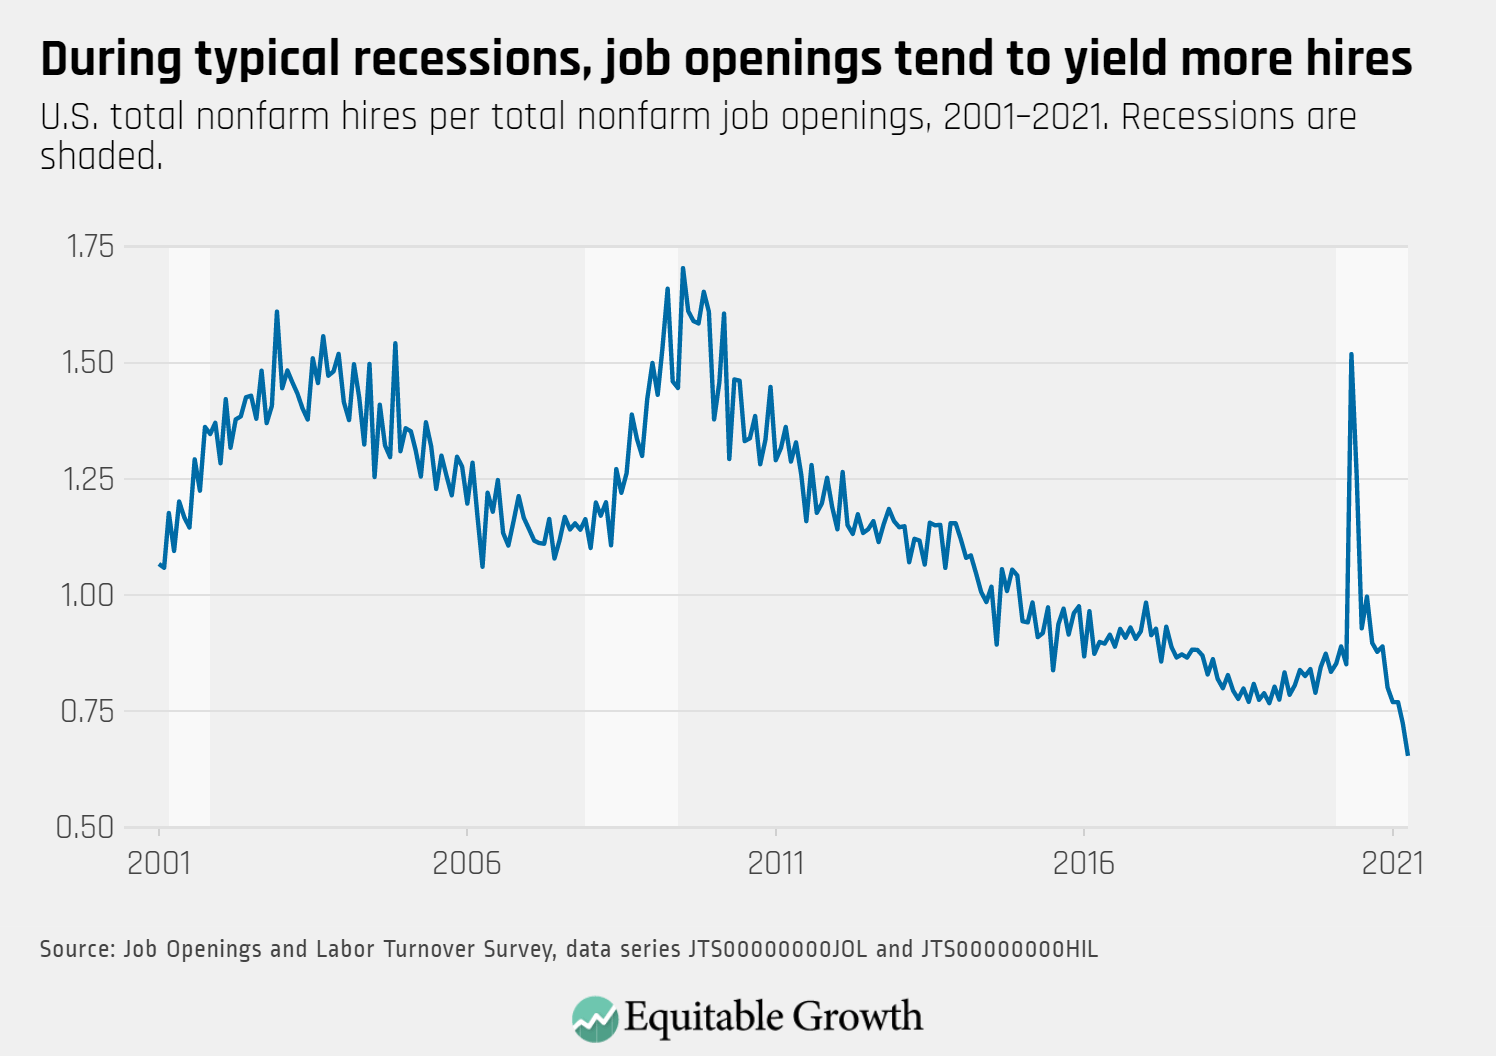
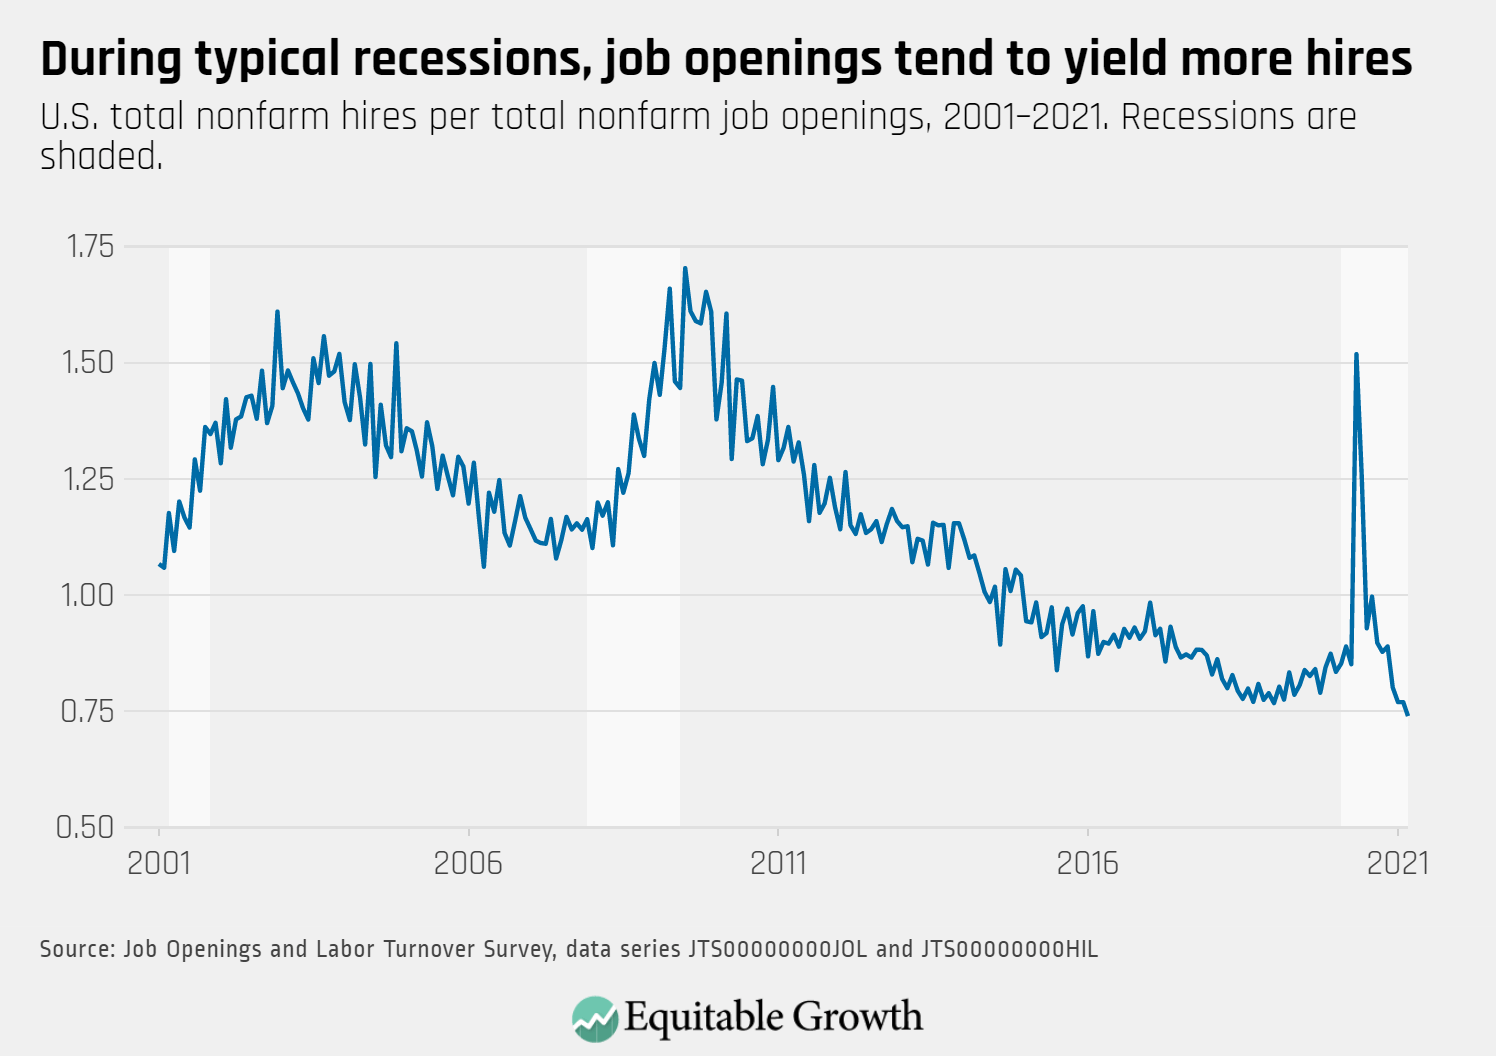
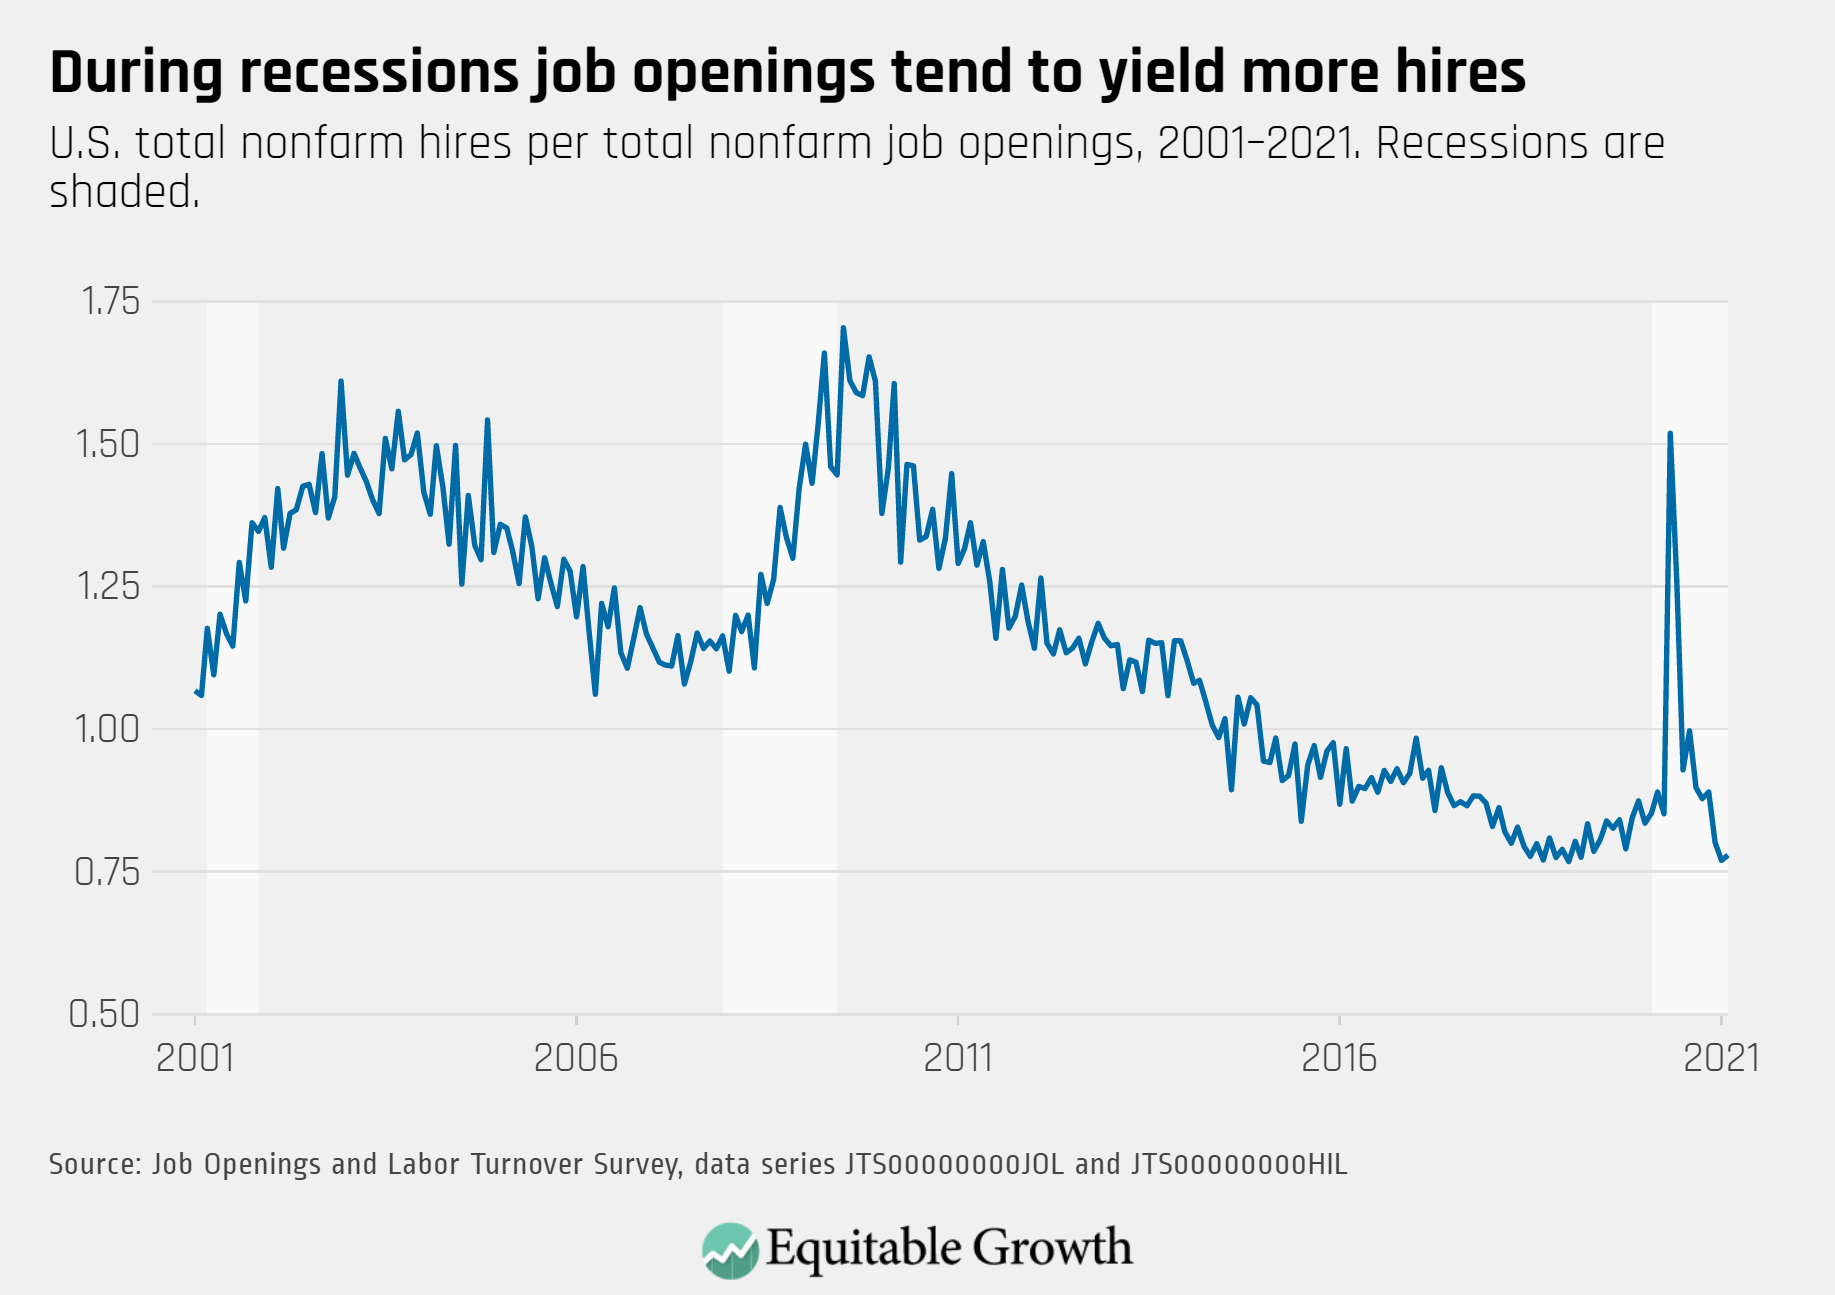
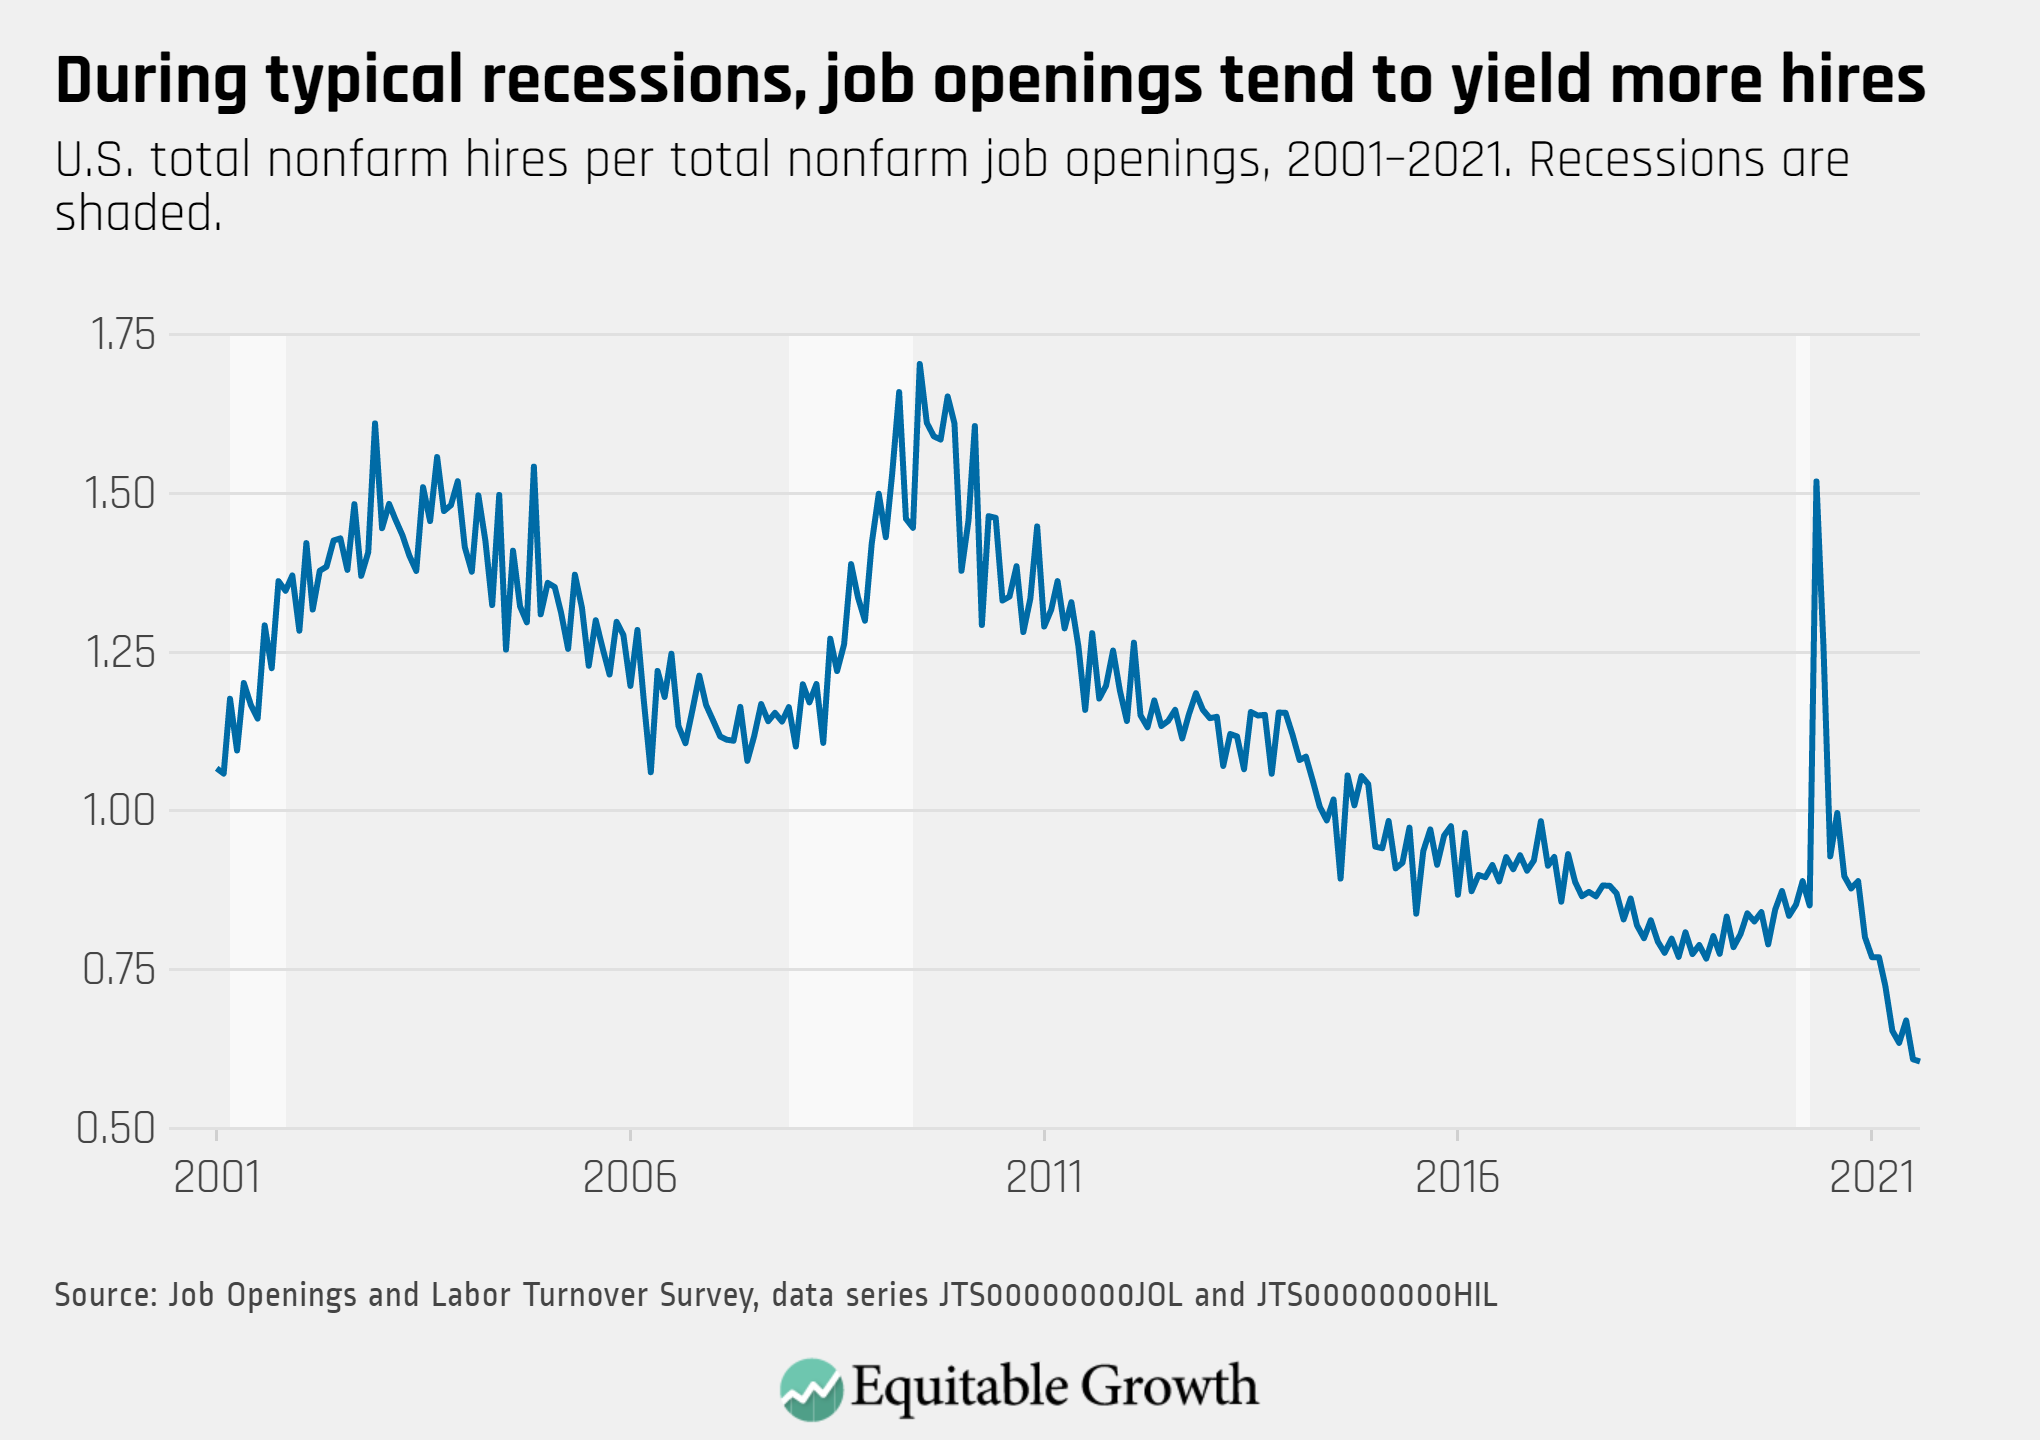
The vacancy yield declined slightly in August, remaining very low with job openings at 10.4 million—down 659,000 after a series high in July.

U.S. total nonfarm hires per total nonfarm job openings, 2001-2021. Recessions are shaded.

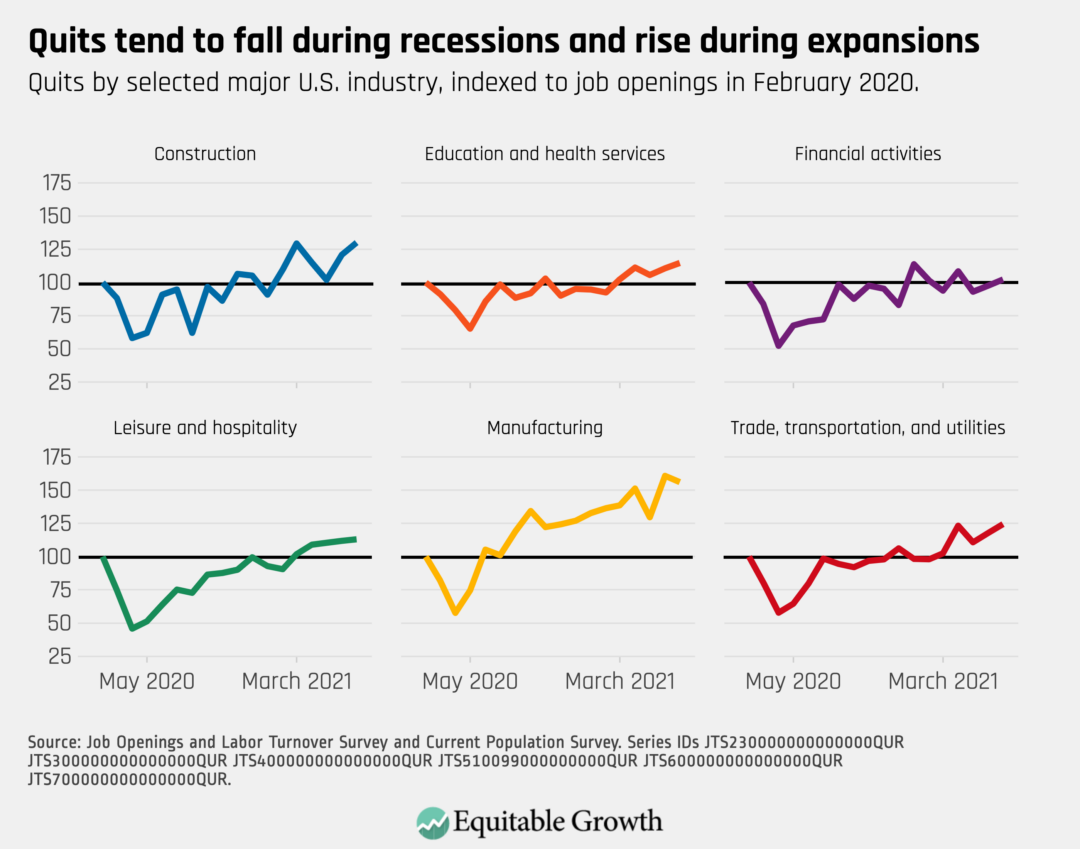
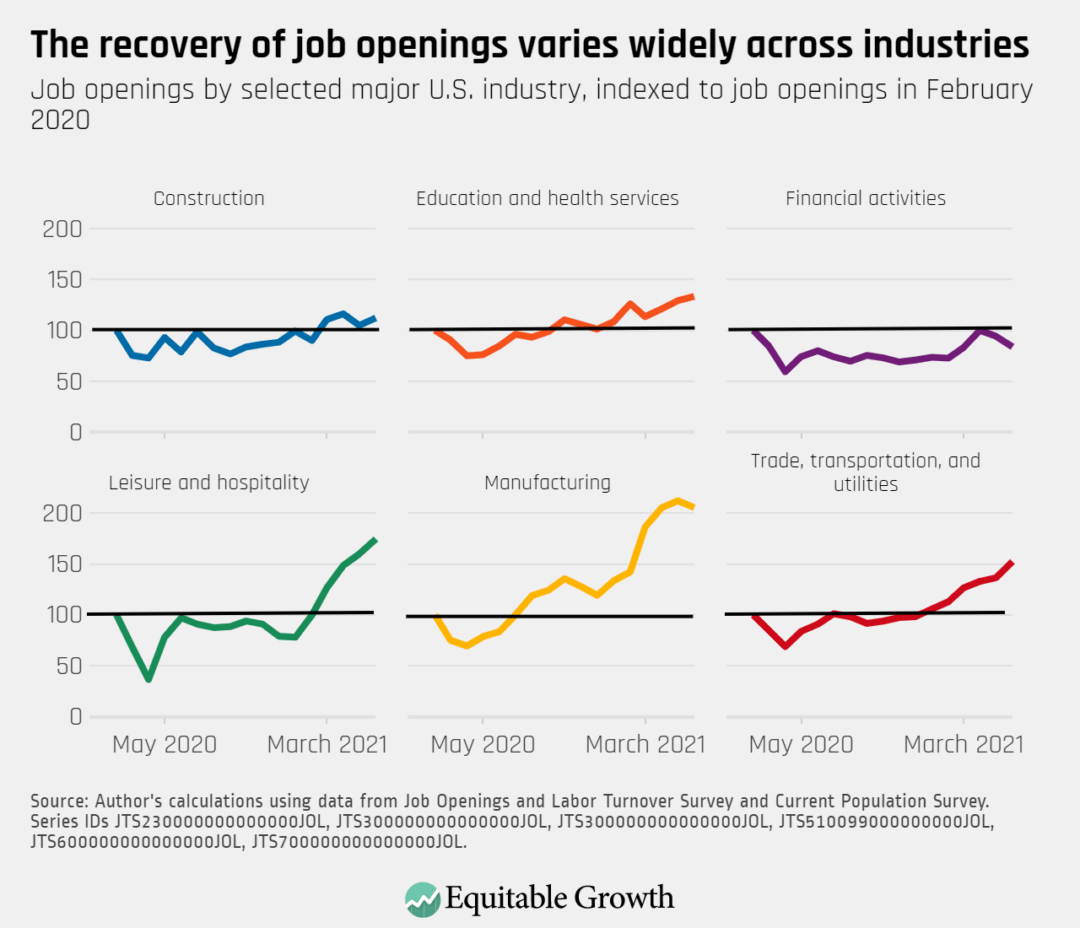
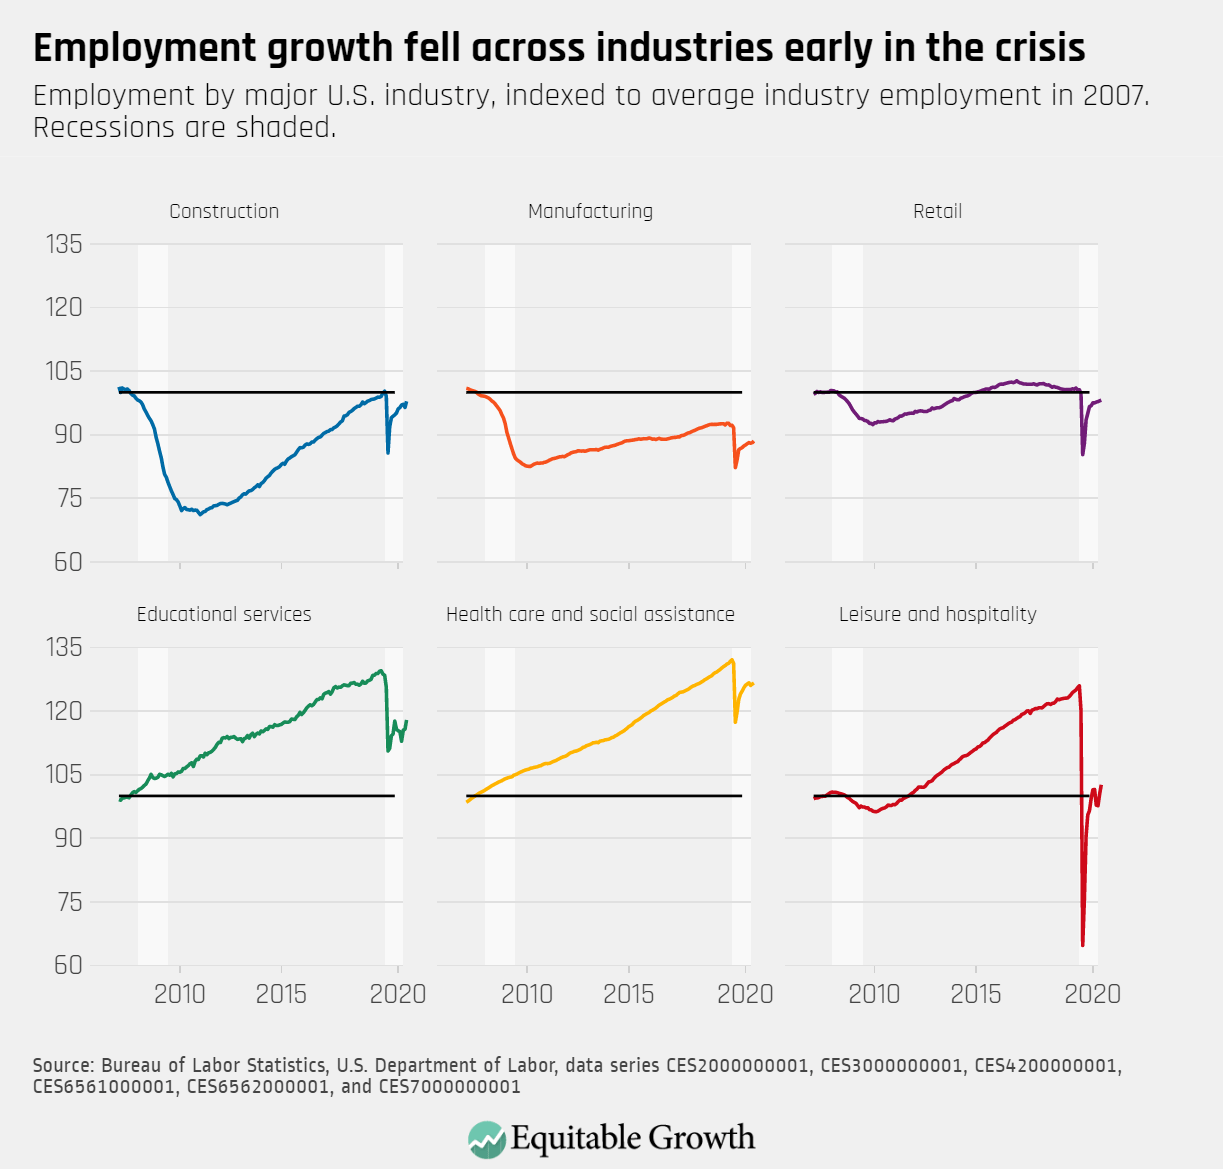
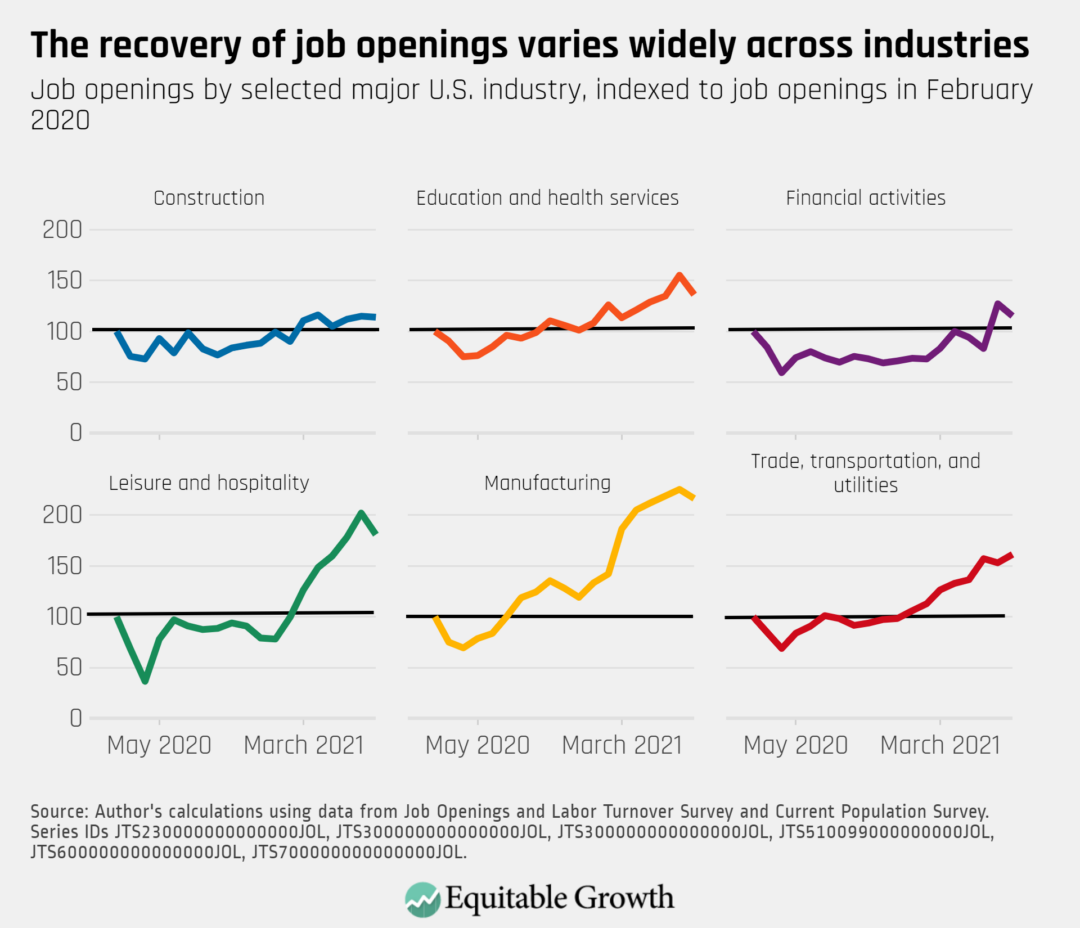
Job openings declined in August, including in sectors that had seen strong recent gains such as the education and health services, manufacturing, and leisure and hospitality.

Job openings by selected major U.S. industry, indexed to job openings in February 2020

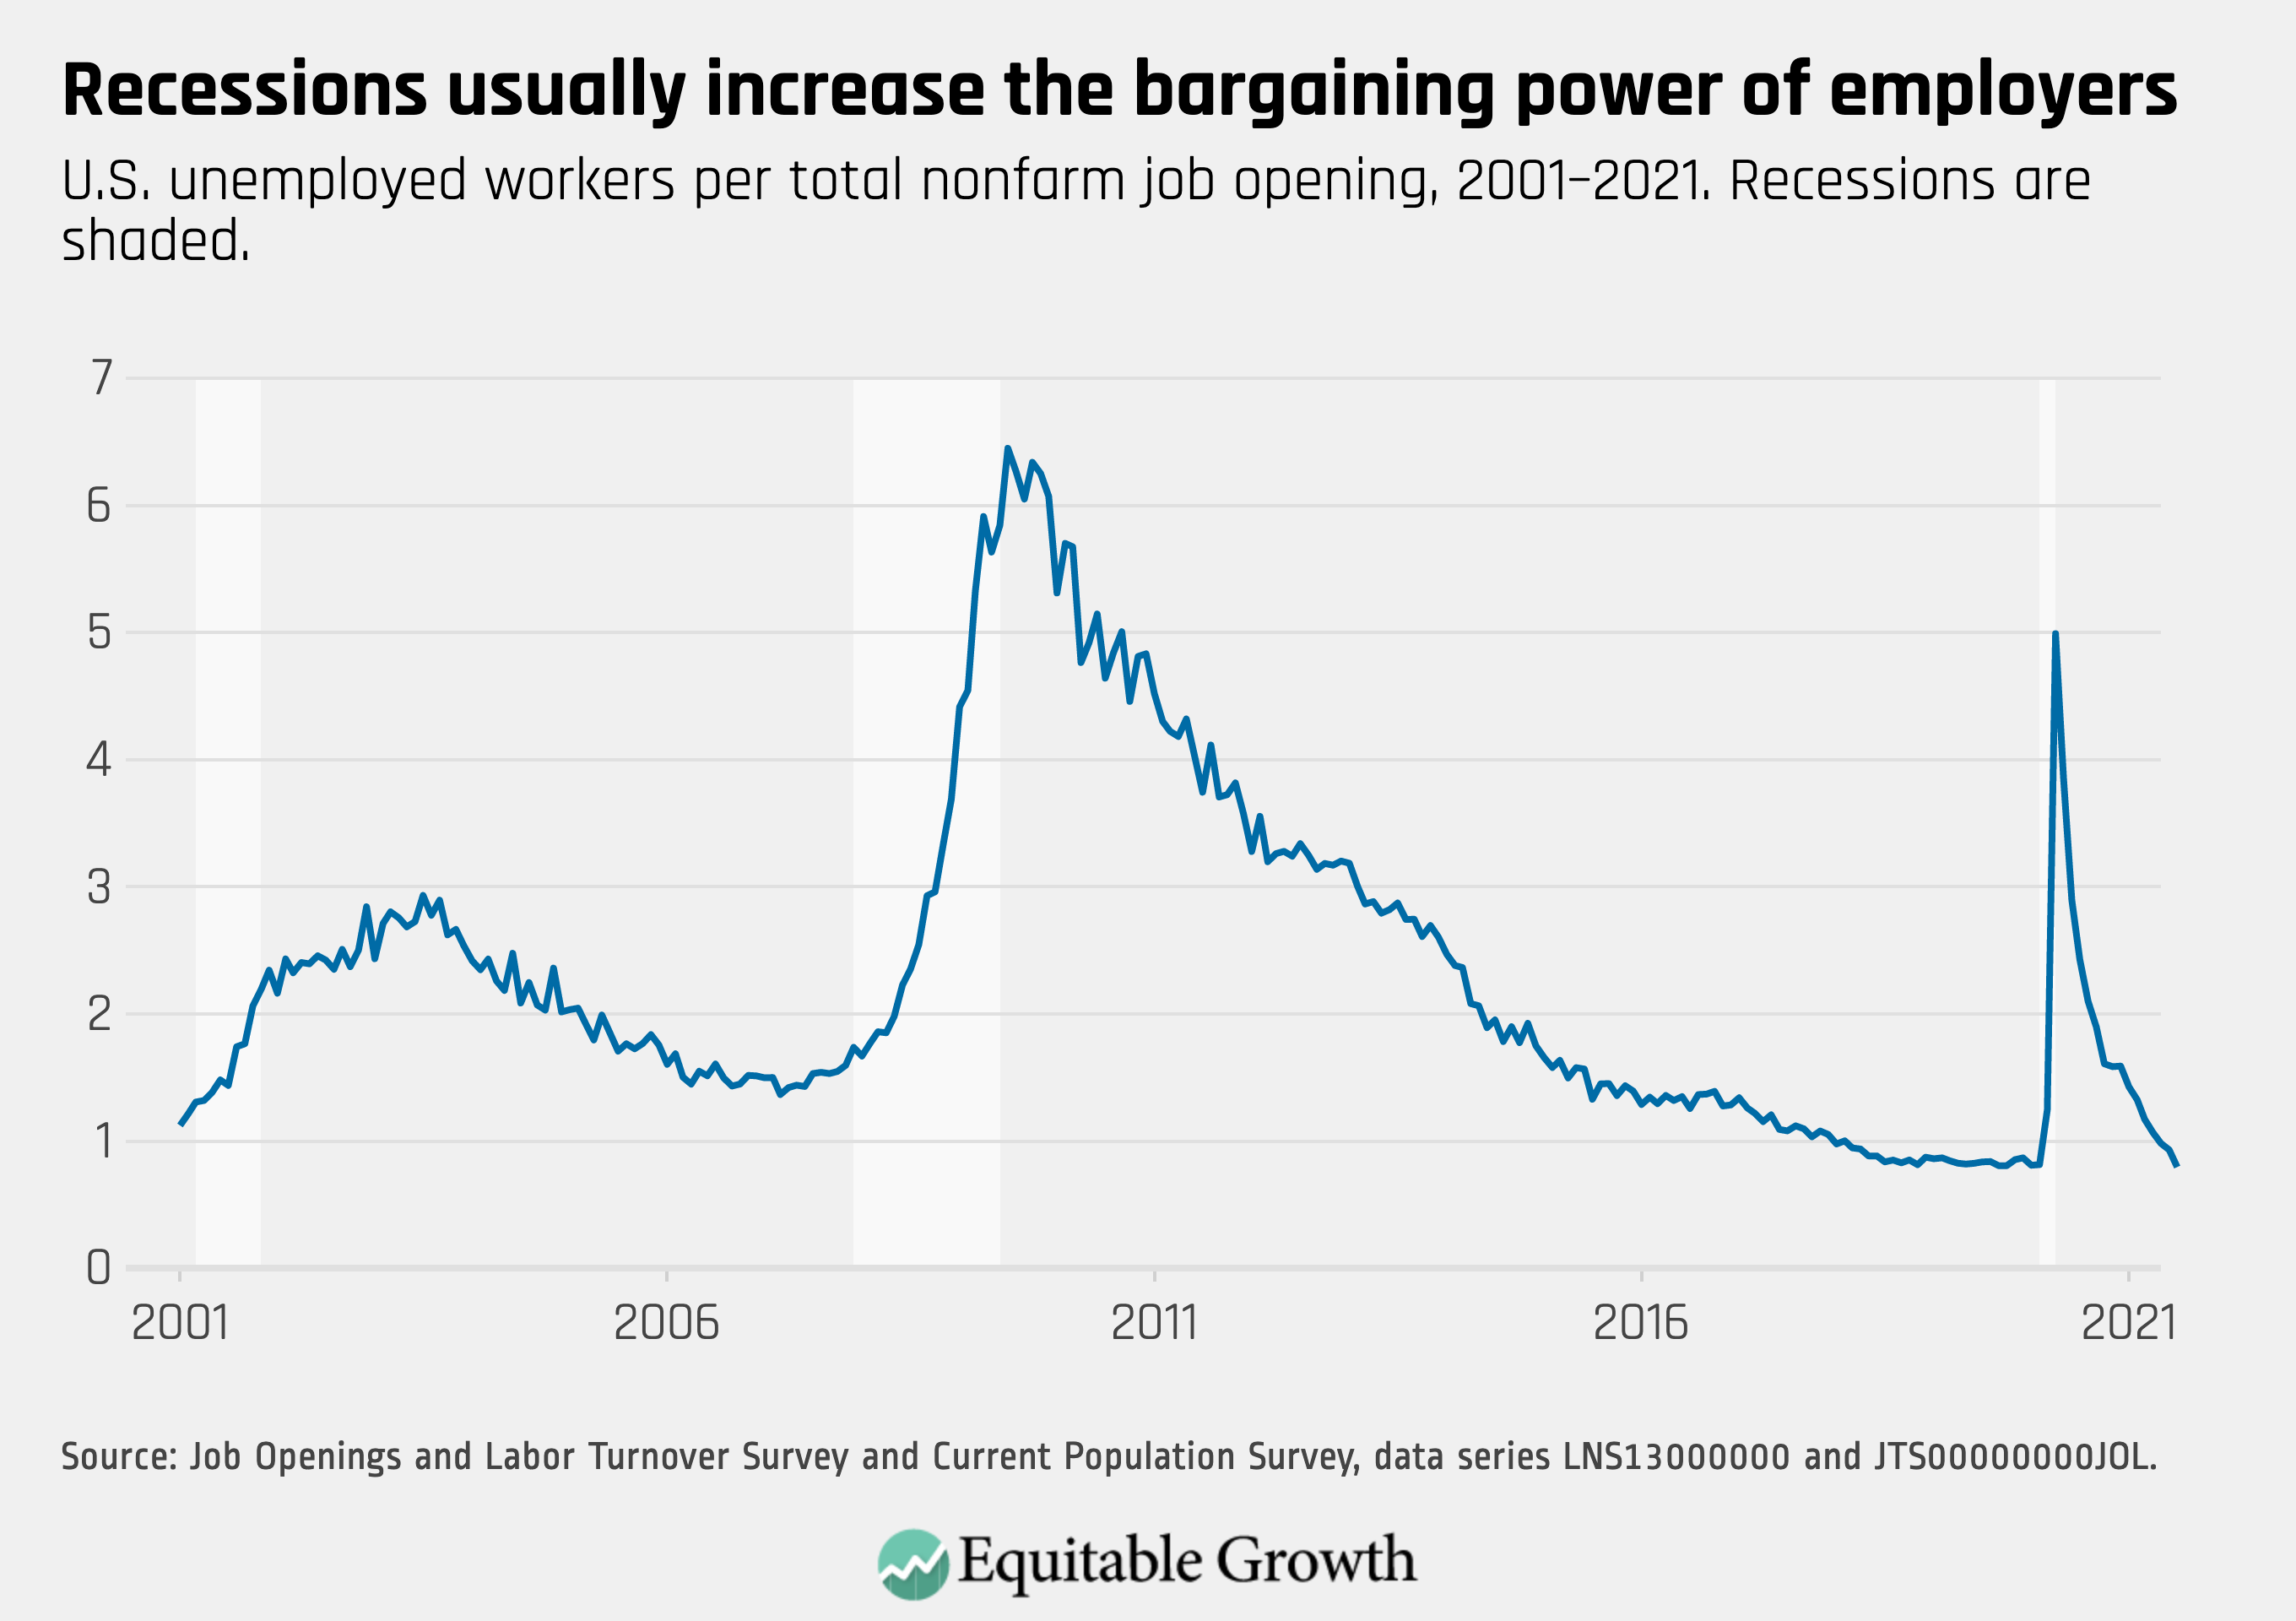
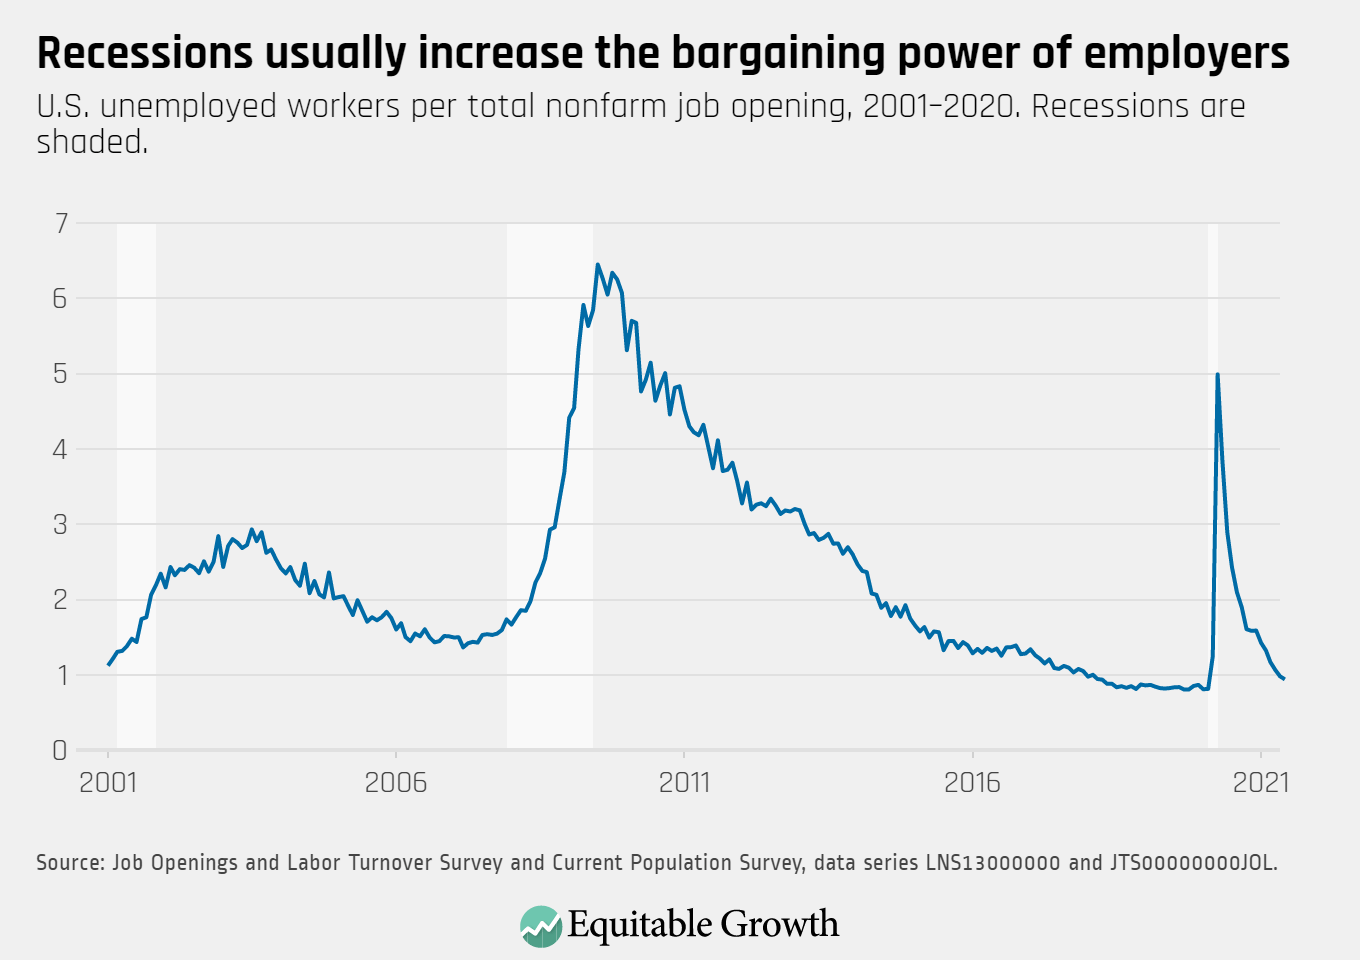
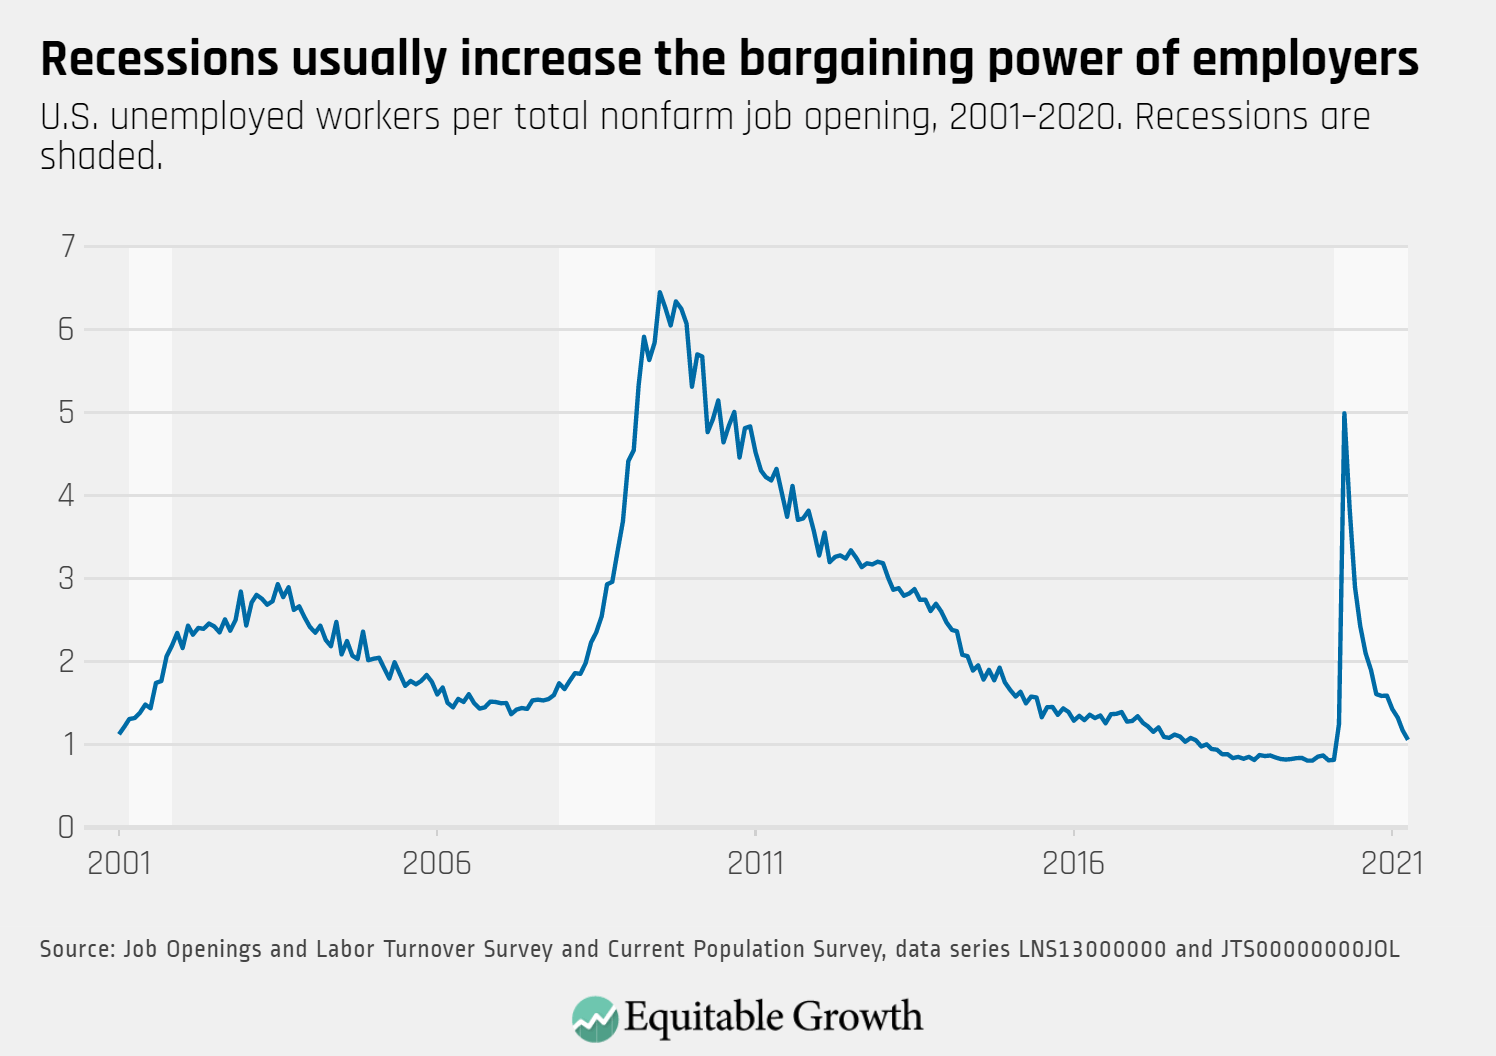
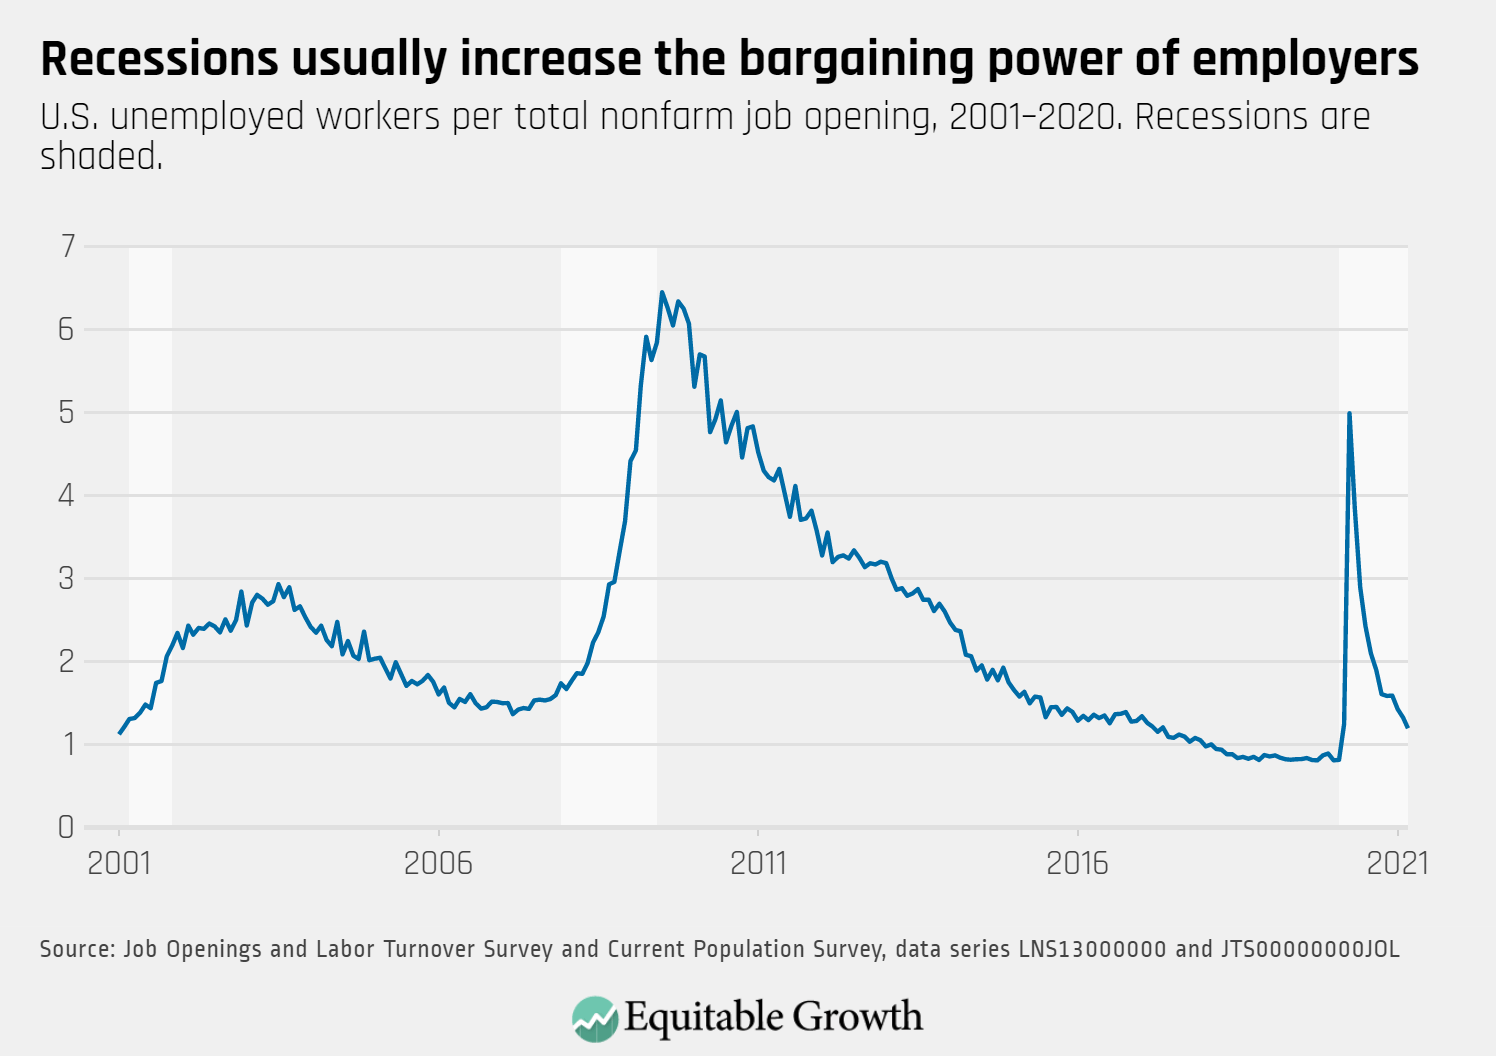
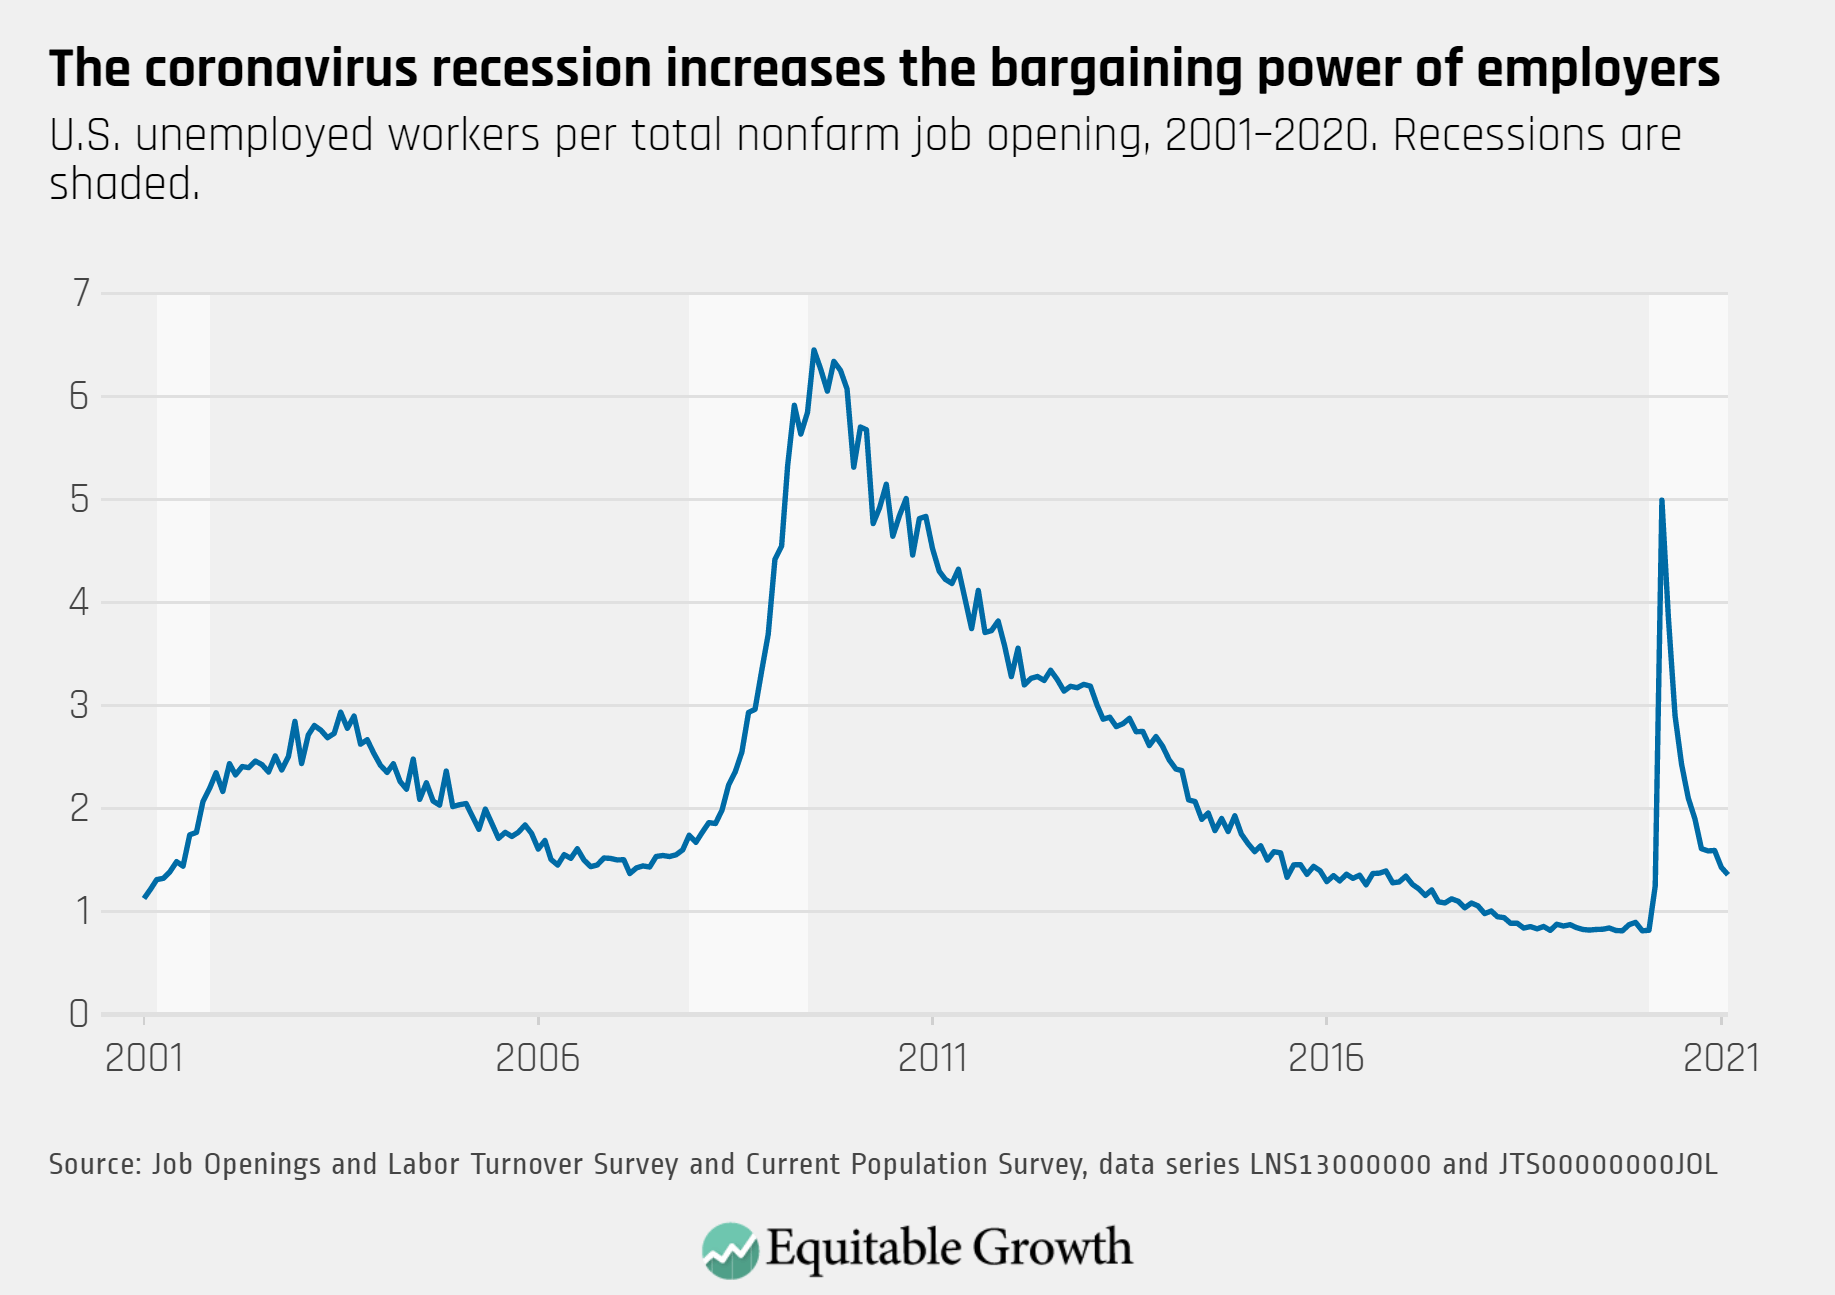
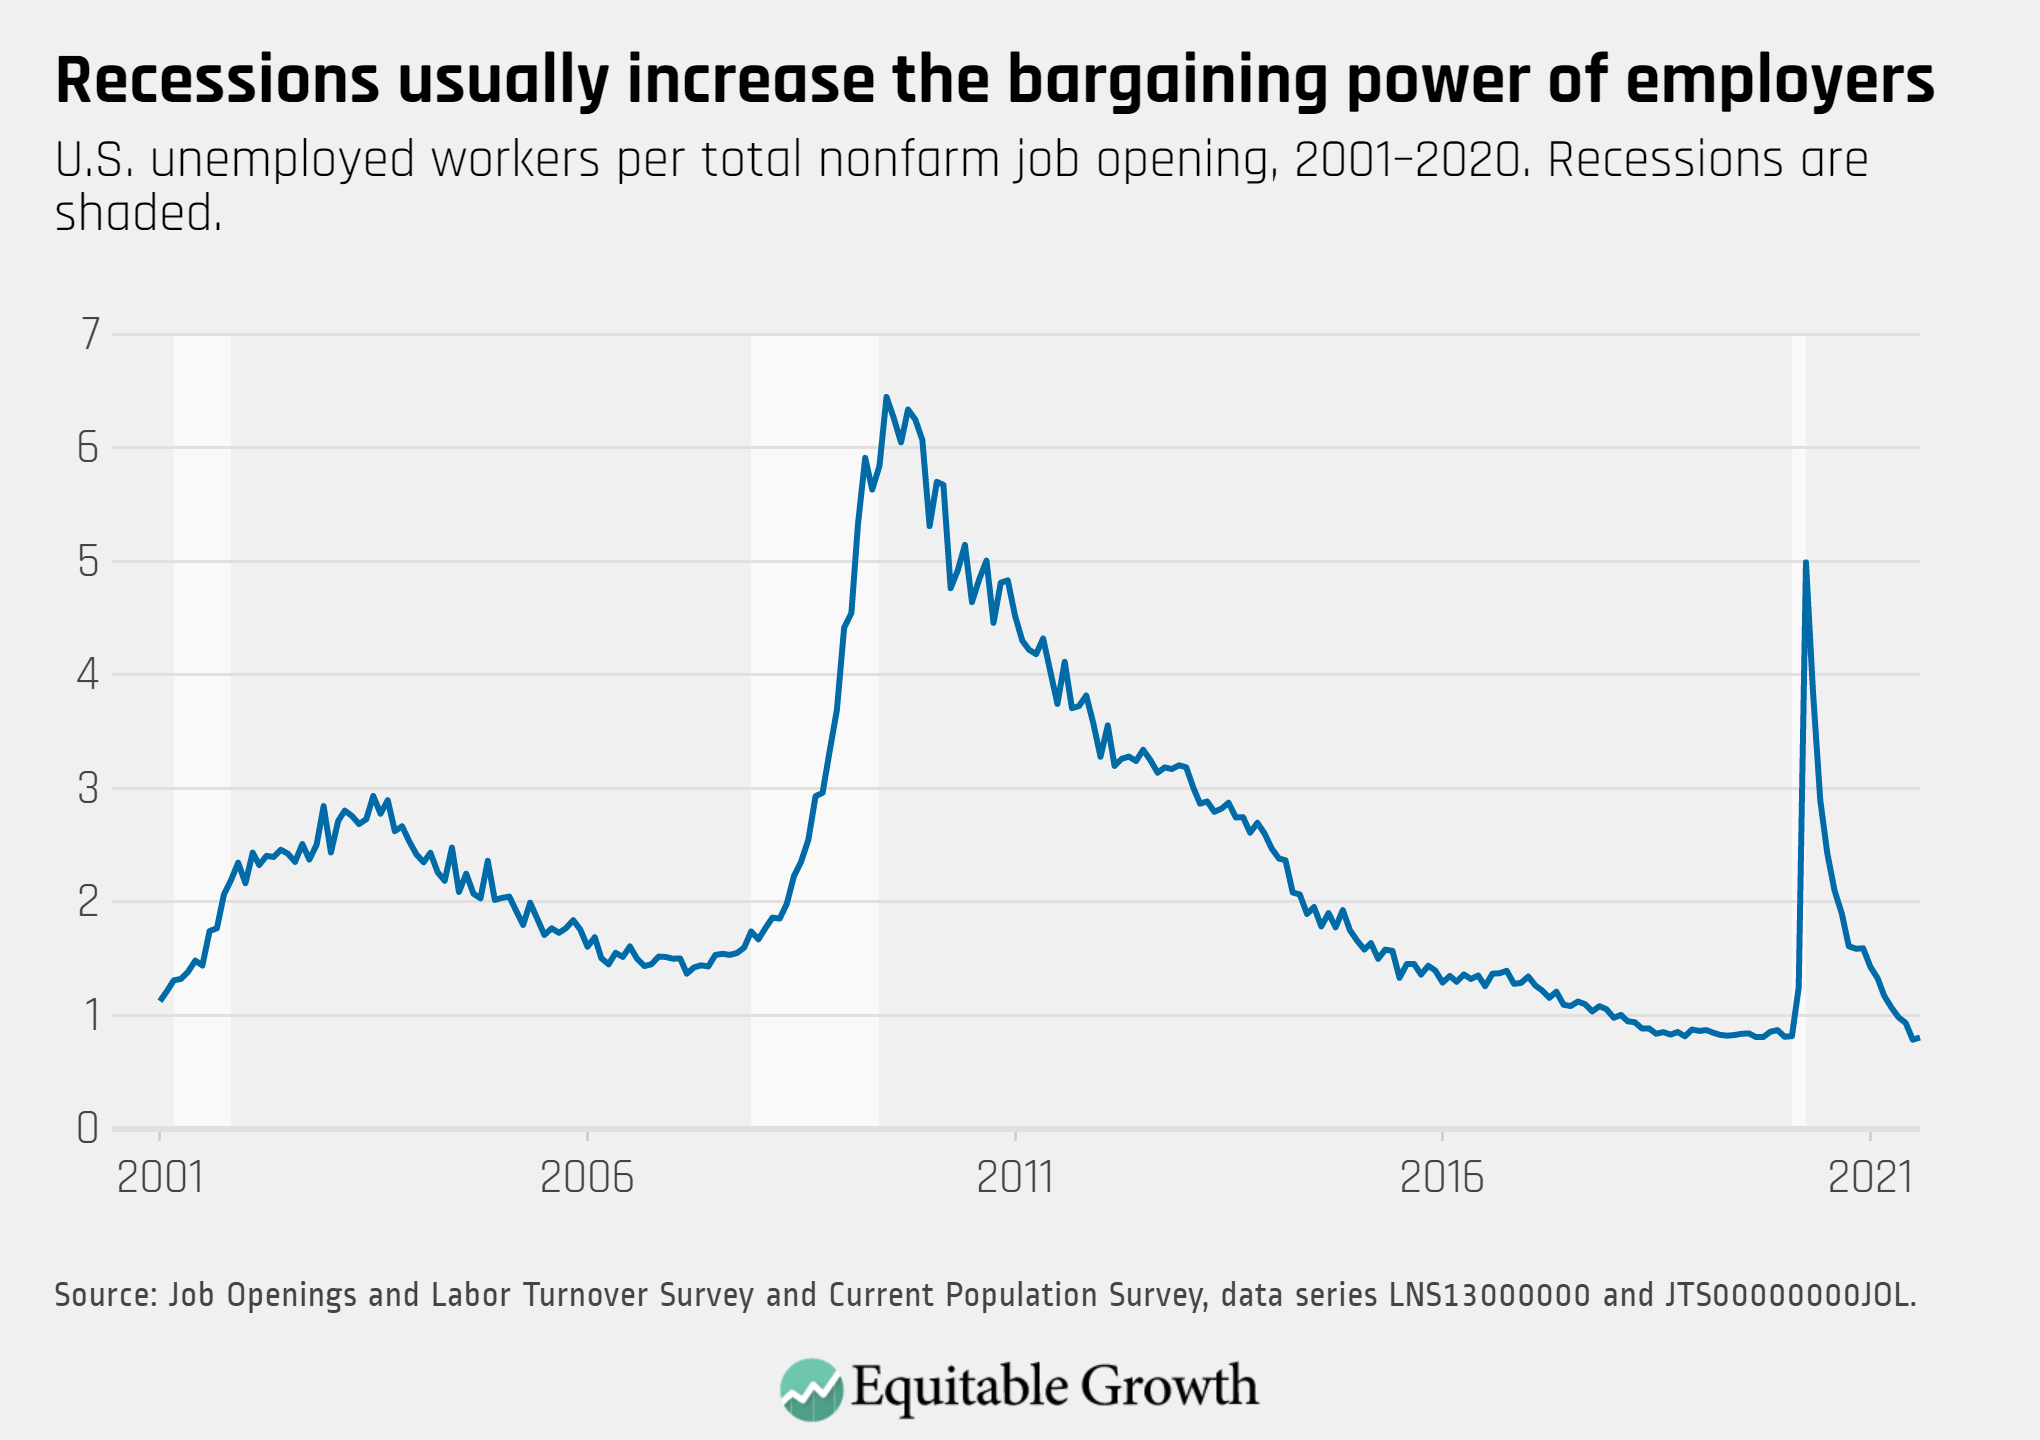
The ratio of unemployed-workers-per-job-opening increased from 0.78 in July to 0.80 in August, still similar to the low levels last seen immediately before the coronavirus recession.

U.S. unemployed workers per total nonfarm job opening, 2001-2020. Recessions are shaded.

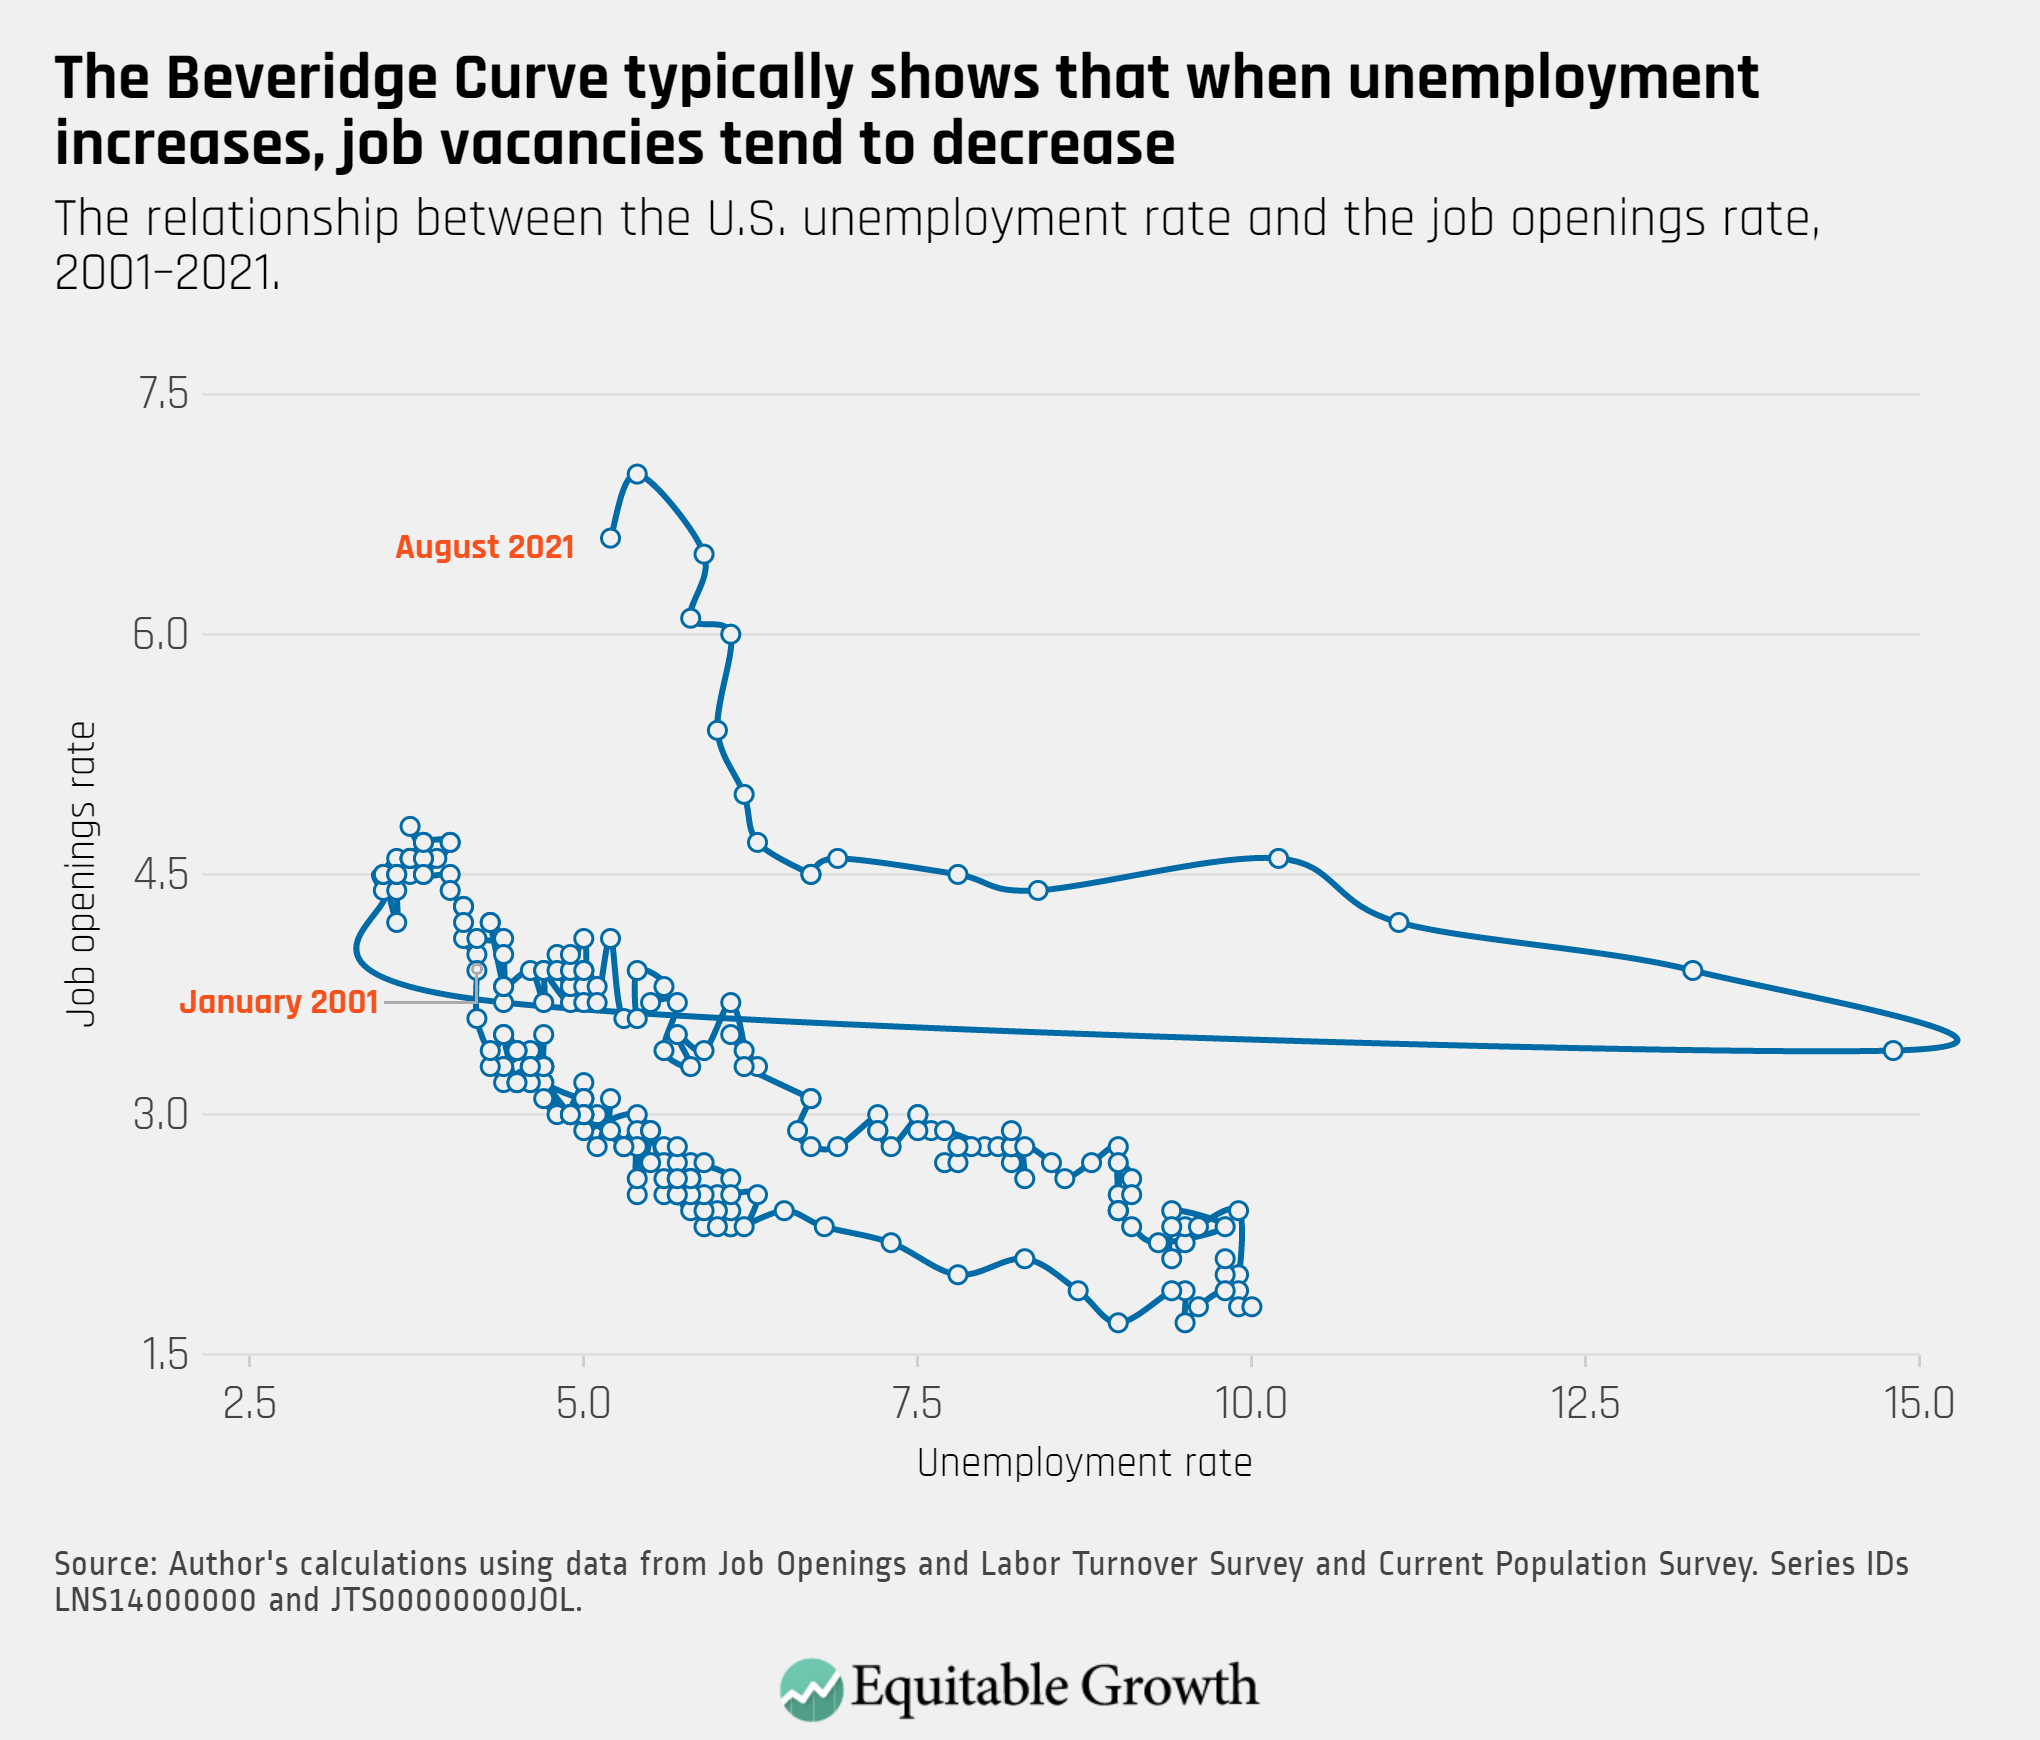
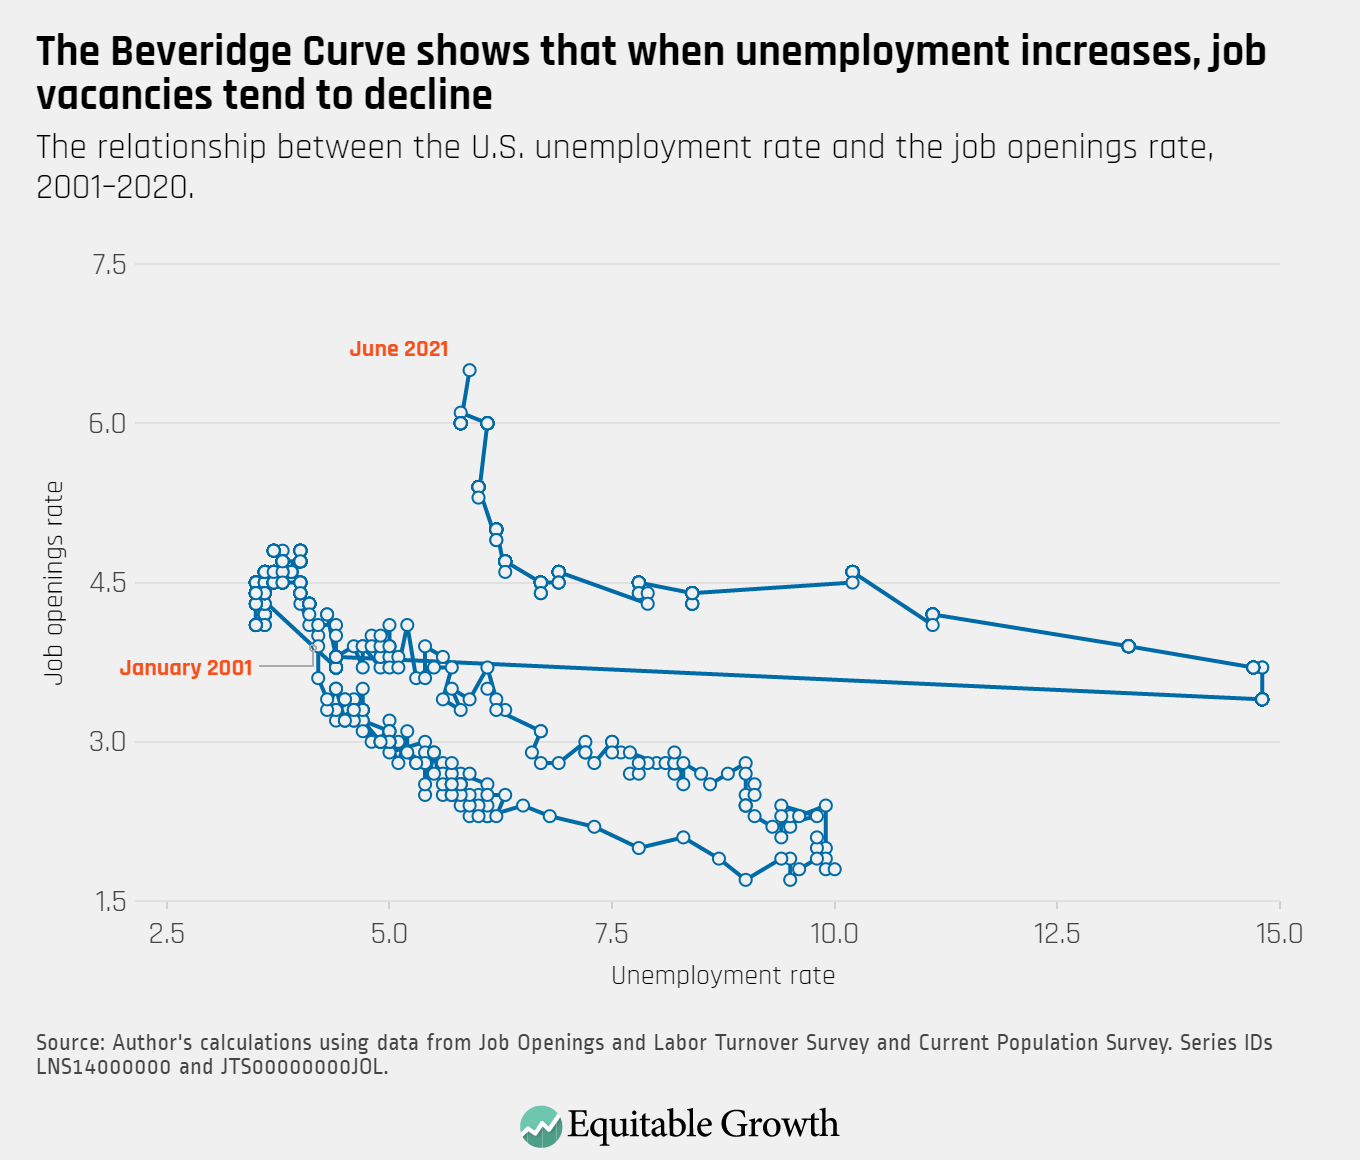
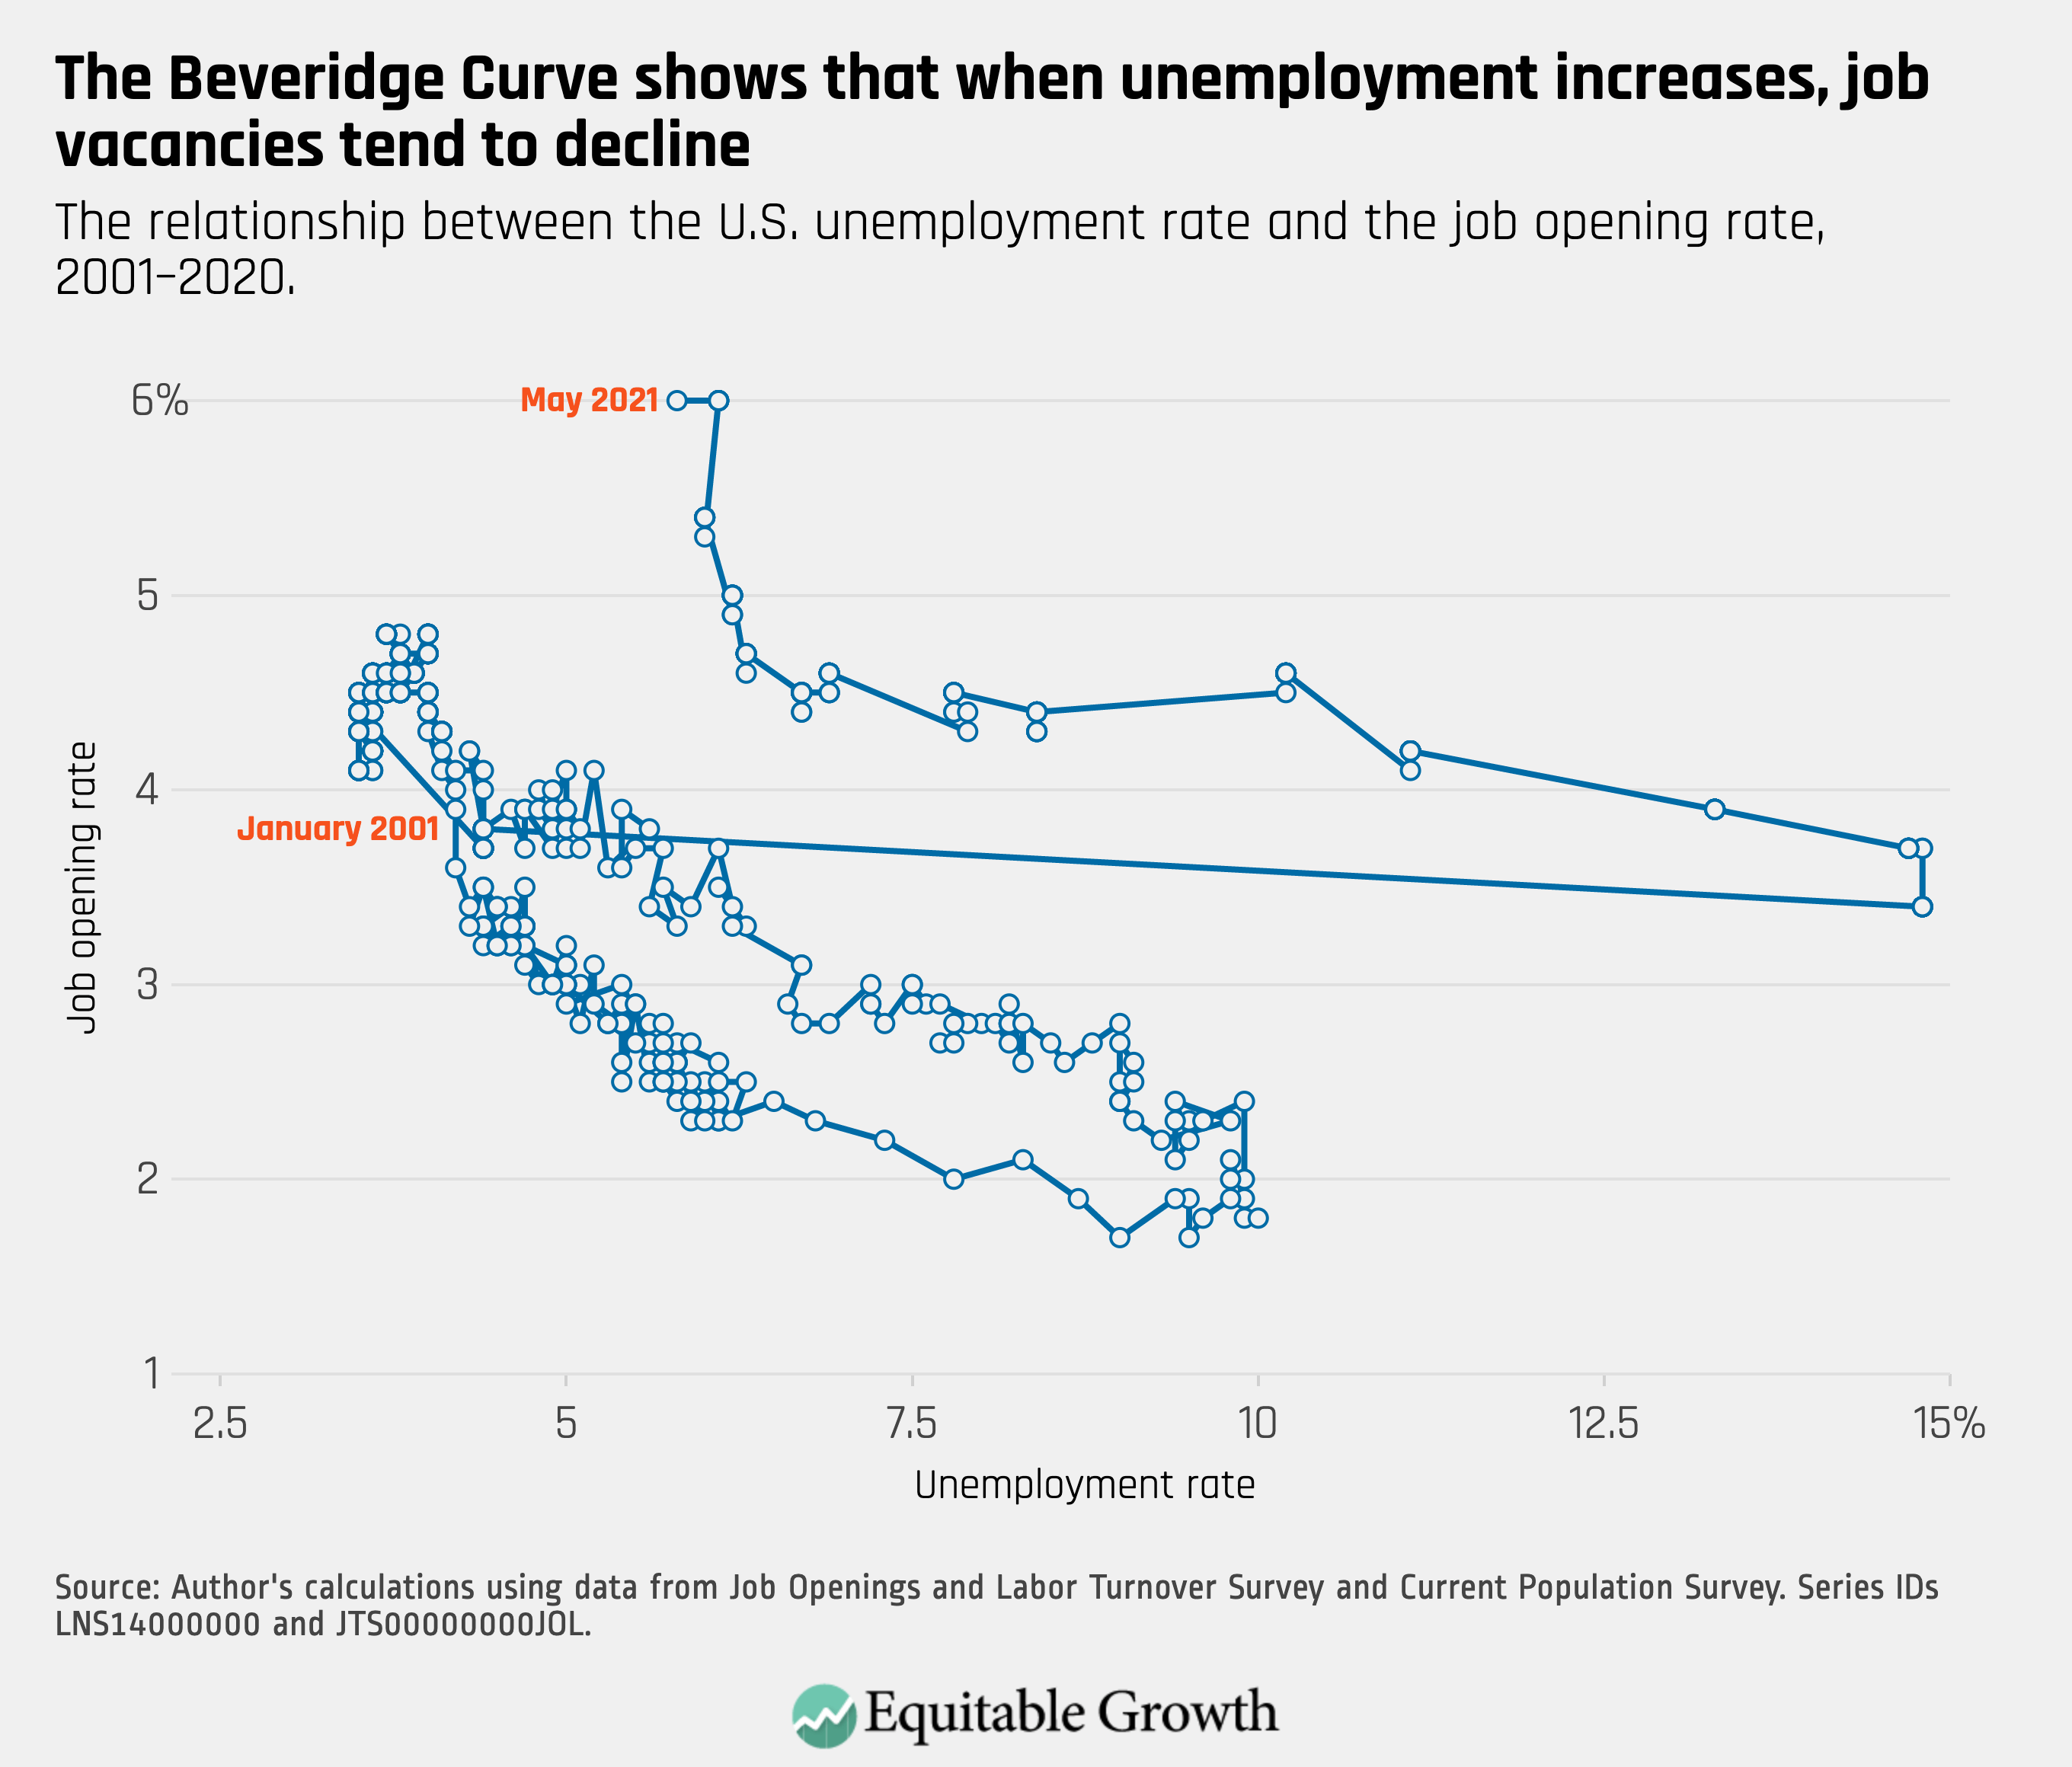
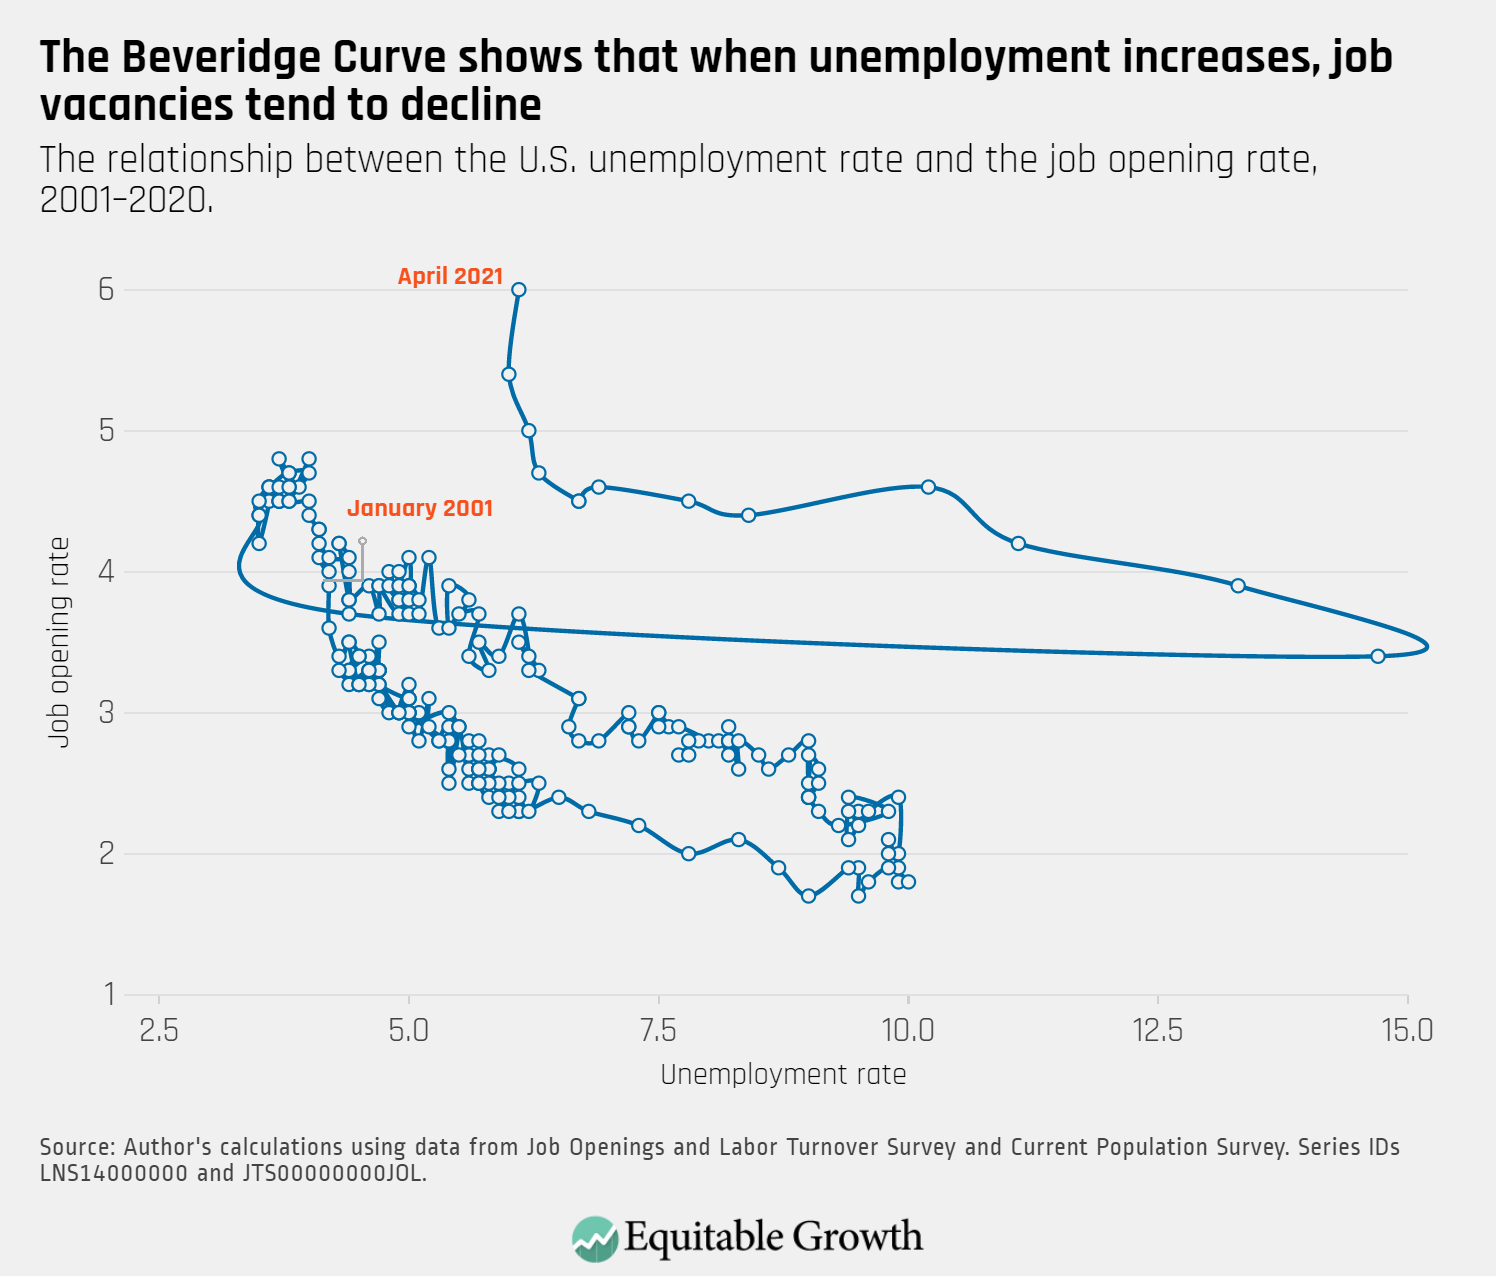
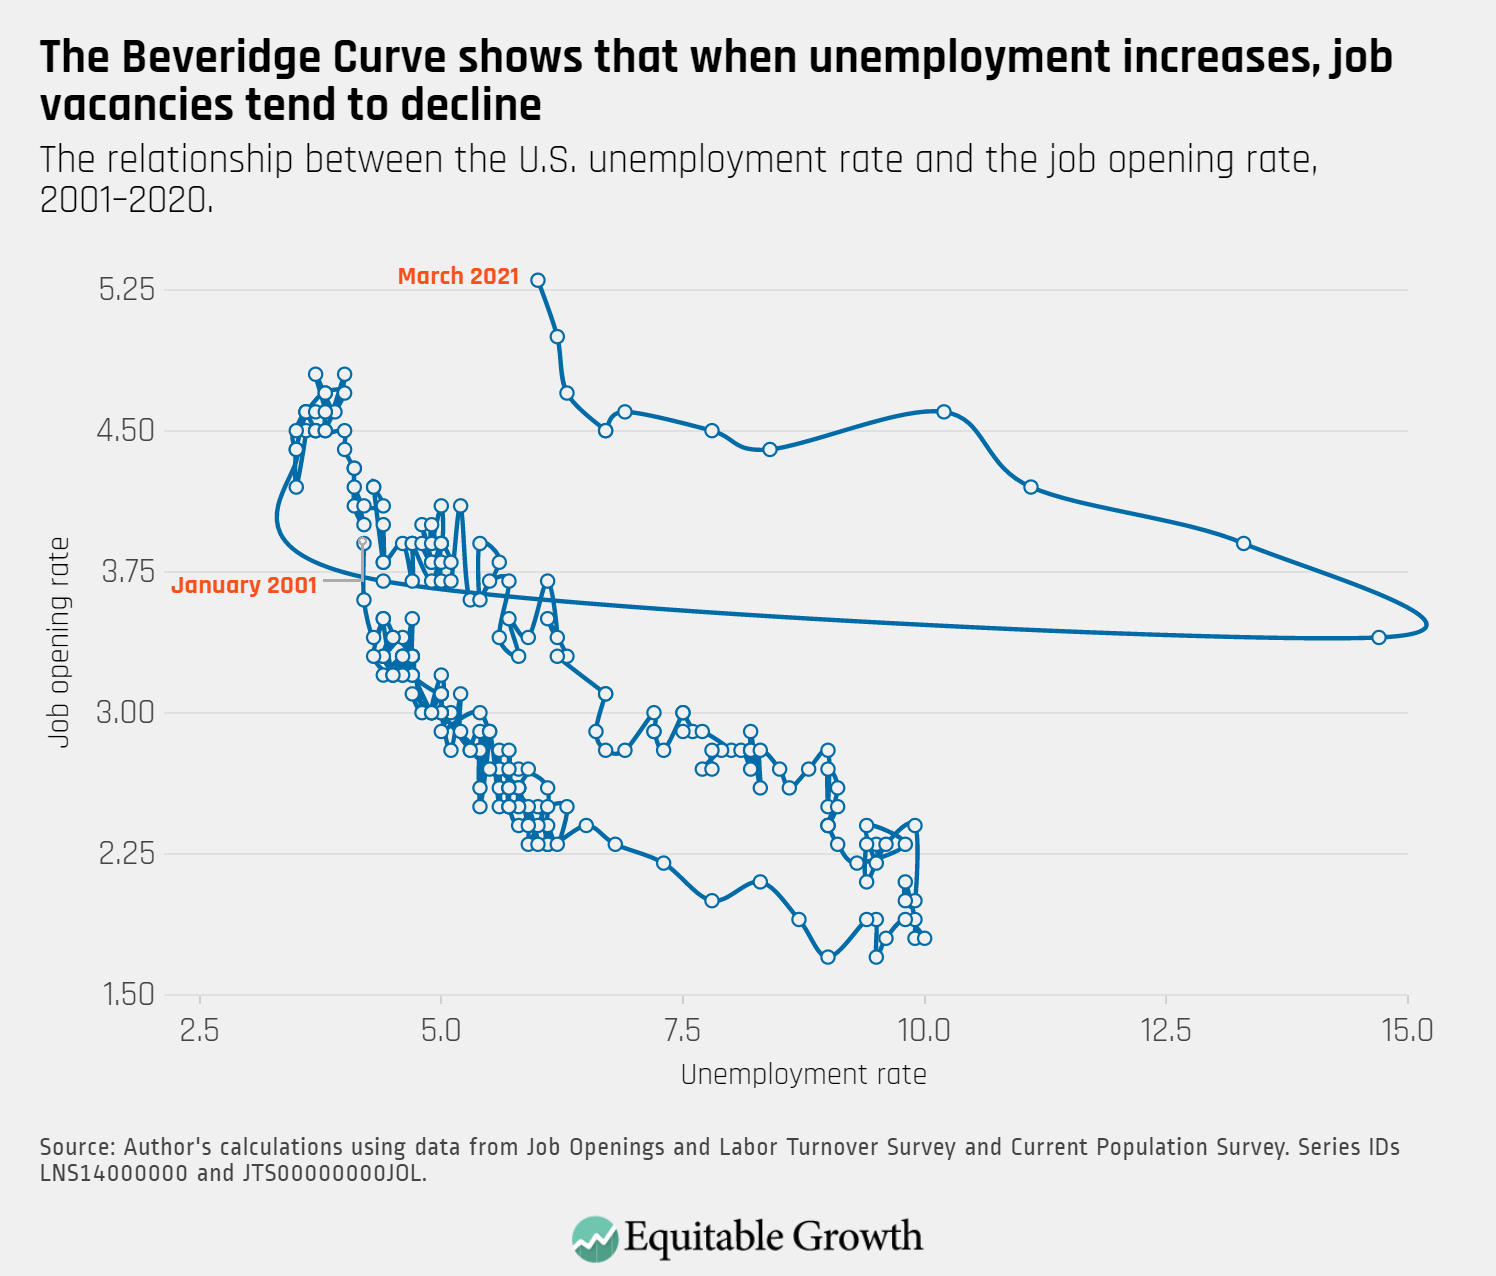
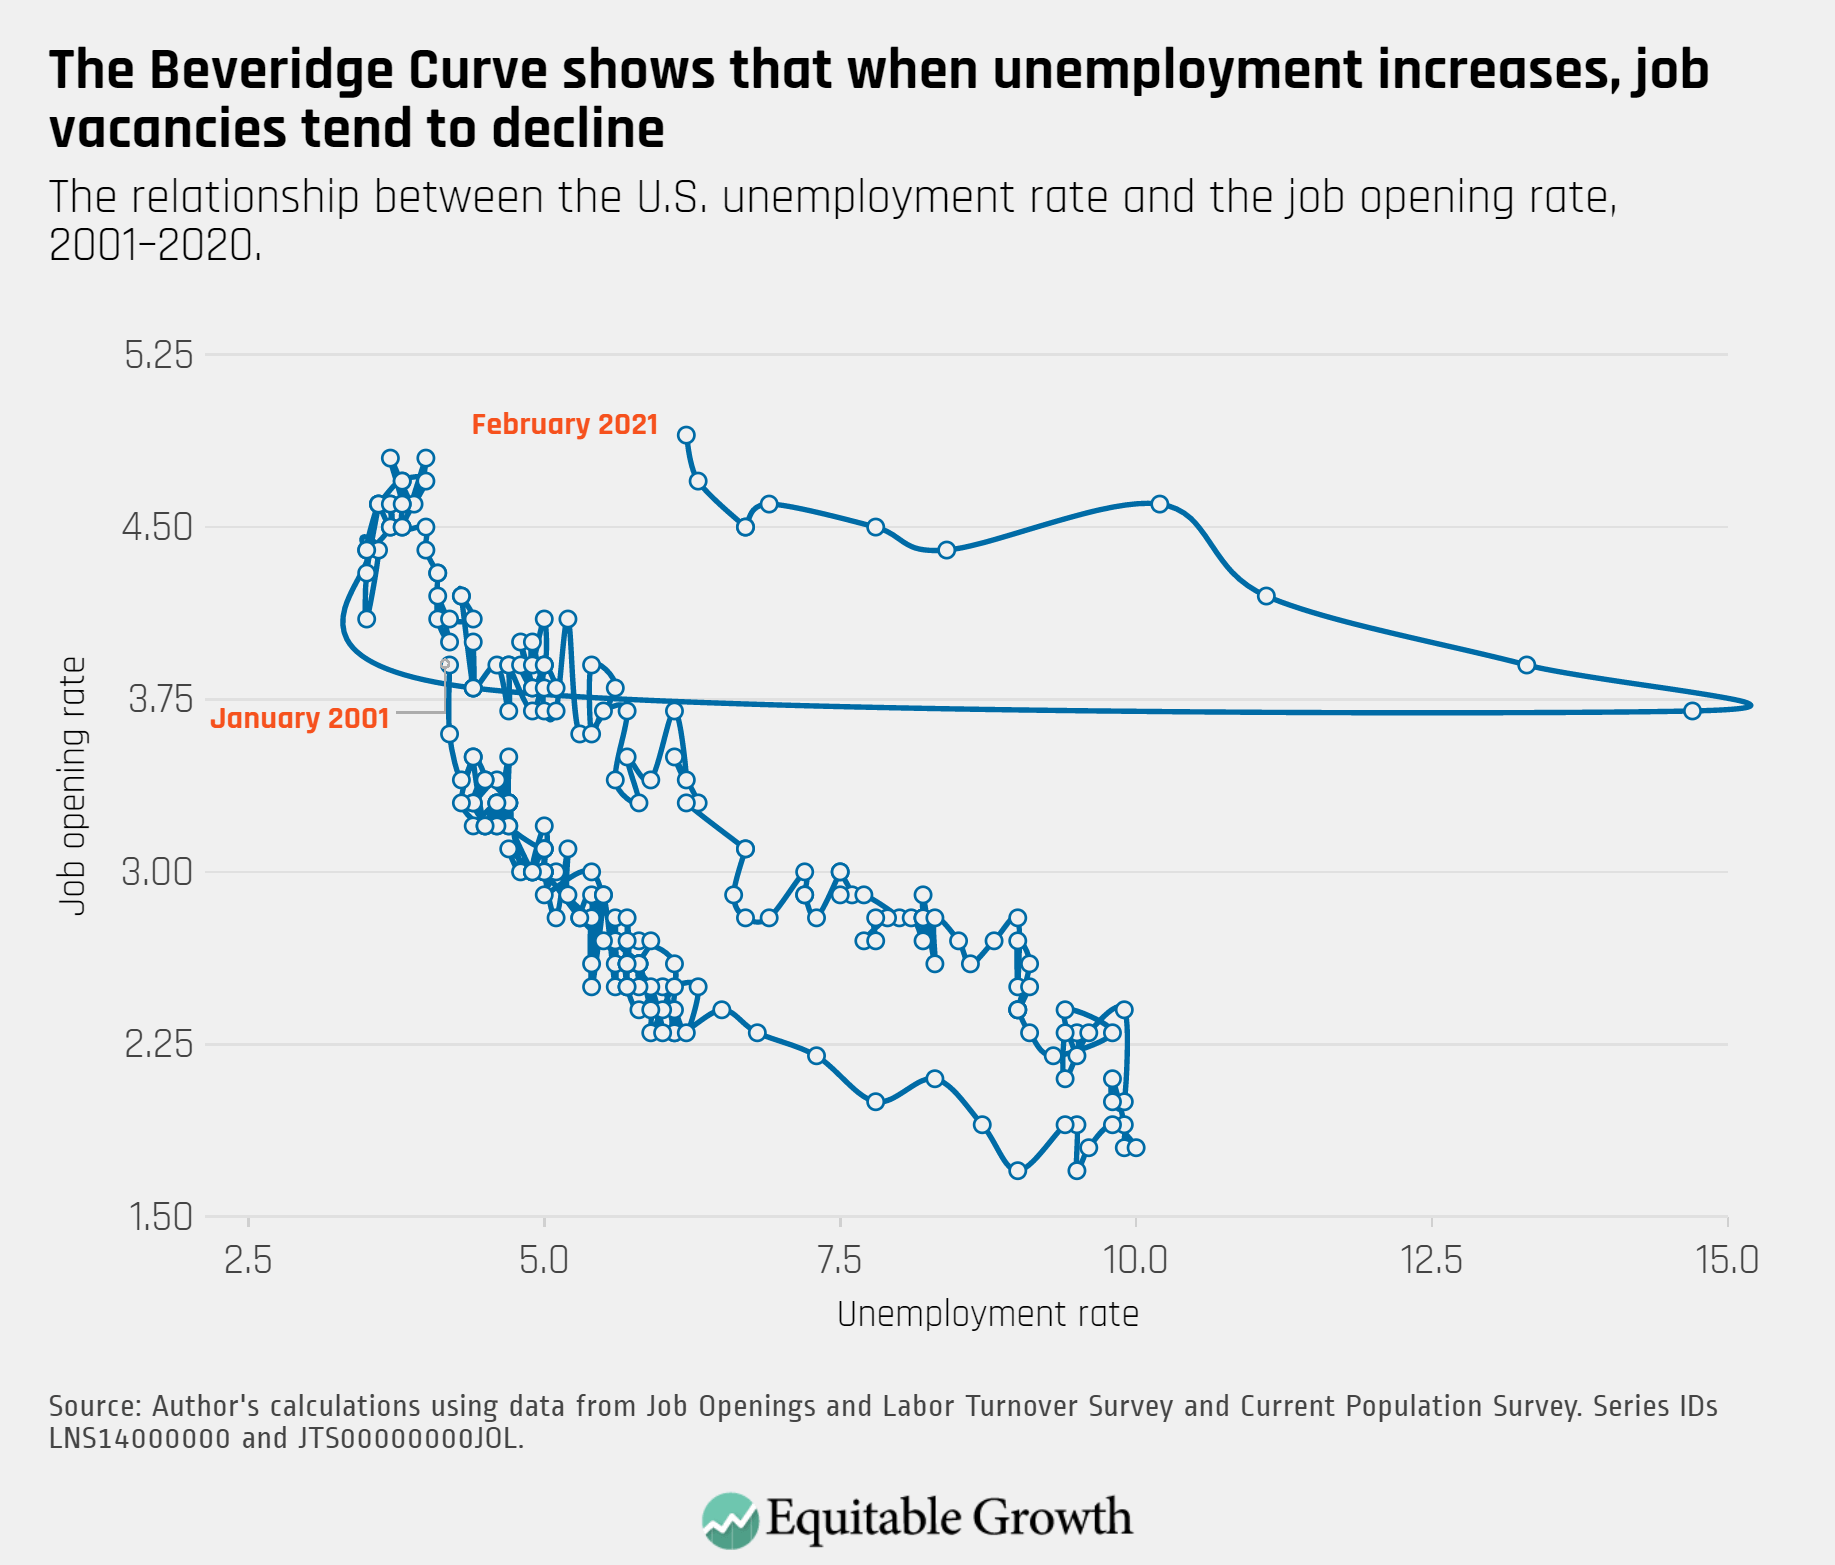
The Beveridge Curve remained in an atypical, elevated range in August, with declines in both the unemployment rate and the job openings rate.

The relationship between the U.S. unemployment rate and the job openings rate, 2001-2021.

JOLTS Day Graphs: July 2021 Edition

Every month the U.S. Bureau of Labor Statistics releases data on hiring, firing, and other labor market flows from the Job Openings and Labor Turnover Survey, better known as JOLTS. Today, the BLS released the latest data for July 2021. This report doesn’t get as much attention as the monthly Employment Situation Report, but it contains useful information about the state of the U.S. labor market. Below are a few key graphs using data from the report.

The quits rate remained relatively steady at 2.7 percent as 4 million workers quit their jobs in July, while the job openings rate increased to 6.9 percent.

Quits as a percent of total U.S. employment, 2001–2021

The vacancy yield declined in July as job openings reached a series high of 10.9 million while hires, at 6.7 million, were little changed.

U.S. total nonfarm hires per total nonfarm job openings, 2001–2021

The quits rate remained elevated in July, and increased in areas such as state and local government education, construction, and wholesale trade.

Quits by selected major U.S. industry, indexed to job openings in February 2020

The ratio of unemployed worker per job opening fell to below 0.8 in July, similar to the low levels previously seen immediately before the coronavirus recession.

U.S. unemployed workers per total nonfarm job opening, 2001–2021.

The Beveridge Curve continues to be in an atypical range, compared to previous business cycles, remaining elevated in July as the unemployment rate fell while the job openings rate increased.

The relationship between the U.S. unemployment rate and the job opening rate, 2001–2021

JOLTS Day Graphs: June 2021 Edition

Every month the U.S. Bureau of Labor Statistics releases data on hiring, firing, and other labor market flows from the Job Openings and Labor Turnover Survey, better known as JOLTS. Today, the BLS released the latest data for June 2021. This report doesn’t get as much attention as the monthly Employment Situation Report, but it contains useful information about the state of the U.S. labor market. Below are a few key graphs using data from the report.

The quits rate rose to 2.7 percent in June as 3.9 million workers quit their jobs.

Quits as a percent of total U.S. employment, 2001-2021. Recessions are shaded.

The vacancy yield increased slightly in June but remained low, as job openings reached a series high of 10.1 million and hires rose to 6.7 million.

U.S. total nonfarm hires per total nonfarm job openings, 2001-2021. Recessions are shaded.

The job openings rate increased to 6.5 percent in June, with job openings remaining particularly elevated for the manufacturing industry and for leisure and hospitality, but low for the financial activities sector.

Job openings by selected major U.S. industry, indexed to job openings in February 2020

The ratio of unemployed workers to job openings decreased to 0.9 in June, approaching pre-coronavirus recession levels.

U.S. unemployed workers per total nonfarm job opening, 2001-2020. Recessions are shaded.

With a slight increase in the unemployment rate and the job openings rate rising to a series high, the Beveridge Curve continues to move in atypical territory, compared to previous business cycles.

The relationship between the U.S. unemployment rate and the job openings rate, 2001-2020

JOLTS Day Graphs: May 2021 Edition

Every month the U.S. Bureau of Labor Statistics releases data on hiring, firing, and other labor market flows from the Job Openings and Labor Turnover Survey, better known as JOLTS. Today, the BLS released the latest data for May 2021. This report doesn’t get as much attention as the monthly Employment Situation Report, but it contains useful information about the state of the U.S. labor market. Below are a few key graphs using data from the report.

The quits rate declined to 2.5 percent as nearly 3.6 million workers quit their jobs in May, down from a series high in April.

Quits as a percent of total U.S. employment, 2001-2021. Recessions are shaded.

The vacancy yield declined slightly, remaining extremely low as job openings and hires stayed relatively constant in May.

U.S. total nonfarm hires per total nonfarm job openings, 2001-2021. Recessions are shaded.

The ratio of unemployed-worker-per-job-opening was 1.01 in May, approaching its level of less than 1.0 prior to the coronavirus recession. 

U.S. unemployed workers per total nonfarm job opening, 2001-2020. Recessions are shaded.

The Beveridge Curve continues to be in an atypical range compared to previous business cycles, as the unemployment rate declined slightly but job openings remained elevated.

The relationship between the U.S. unemployment rate and the job opening rate, 2001-2020

JOLTS Day Graphs: April 2021 Edition

Every month the U.S. Bureau of Labor Statistics releases data on hiring, firing, and other labor market flows from the Job Openings and Labor Turnover Survey, better known as JOLTS. Today, the BLS released the latest data for April 2021. This report doesn’t get as much attention as the monthly Employment Situation Report, but it contains useful information about the state of the U.S. labor market. Below are a few key graphs using data from the report.

The quits rate reached a series high of 2.7 percent as nearly 4 million workers quit their jobs in April.

Quits as a percent of total U.S. employment, 2001-2021. Recessions are shaded.

As job openings reached a series high of 9.3 million and hires stayed constant, the vacancy yield declined in April.

U.S. total nonfarm hires per total nonfarm job openings, 2001-2021. Recessions are shaded.

The ratio of unemployed-worker-per-job-opening was 1.06 in April, approaching its level of less than 1.0 prior to the recession. 

U.S. unemployed workers per total nonfarm job opening, 2001-2020. Recessions are shaded.

The Beveridge Curve moved sharply upwards with the historic level of job openings and continued to be in unprecedented territory compared to previous business cycles.

The relationship between the U.S. unemployment rate and the job opening rate, 2001-2020

Equitable Growth’s Jobs Day Graphs: May 2021 Report Edition

On June 4, the U.S. Bureau of Labor Statistics released new data on the U.S. labor market during the month of May. Below are five graphs compiled by Equitable Growth staff highlighting important trends in the data.

The prime-age employment-to-population ratio increased slightly in May from 76.9 percent to 77.1 percent as the labor market added 559,000 jobs.

Share of 25- to -54-year-olds who are employed, 2007, 2021. Recessions are shaded.

Unemployment rates seem to have fallen for all racial and ethnic groups, but remain significantly higher for Black workers at 9.1 percent and Latinx workers at 7.3 percent.

U.S. unemployment rate by race, 2000-2021. Recessions are shaded.

Women’s employment rate increased 0.3 percentage points to 53.1 percent while men’s employment rate increased 0.1 percentage point to 63.4 percent.

Share of the U.S. population that is employed, by gender, 2007-2021. Recessions are shaded.

An increasing proportion of unemployed workers reentered the labor force, while the unemployment rate declined to 5.8 percent in May.

Percent of all unemployed workers in the United States by reason for unemployment, 2019-2021

Fewer unemployed workers have been out of employment for more than 15 weeks, led by a decline in unemployed workers without jobs for 27 weeks or more.

Percent of all unemployed U.S. workers by length of time unemployed, 2019-2021

JOLTS Day Graphs: March 2021 Edition

Every month the U.S. Bureau of Labor Statistics releases data on hiring, firing, and other labor market flows from the Job Openings and Labor Turnover Survey, better known as JOLTS. Today, the BLS released the latest data for March 2021. This report doesn’t get as much attention as the monthly Employment Situation Report, but it contains useful information about the state of the U.S. labor market. Below are a few key graphs using data from the report.

The quits rate remained unchanged at 2.4 percent in March, even as the job openings rate increased to 5.3 percent.

Quits as a percent of total U.S. employment, 2001-2021. Recessions are shaded.

Job openings reached a series high, yet hires were little changed as the vacancy yield declined in March.

U.S. total nonfarm hires per total nonfarm job openings, 2001-2021. Recessions are shaded.

There were 1.2 unemployed workers for every job opening in March as unemployment decreased.

U.S. unemployed workers per total nonfarm job opening, 2001-2020. Recessions are shaded.

With a slight decrease in the unemployment rate and the job openings rate reaching a series high, the Beveridge Curve continues to move in atypical territory, reflecting the unique nature of this downturn.

The relationship between the U.S. unemployment rate and the job opening rate, 2001-2020.

Equitable Growth’s Jobs Day Graphs: April 2021 Report Edition

On May 7, the U.S. Bureau of Labor Statistics released new data on the U.S. labor market during the month of April. Below are five graphs compiled by Equitable Growth staff highlighting important trends in the data.

With fewer jobs added than expected in April, prime-age employment increased only slightly to 76.9 percent from 76.8 percent in March.

Share of 25- to 54-year-olds who are employed, 2007-2021. Recessions are shaded.

Unemployment rates were little changed among most racial and ethnic groups and remain persistently high for Black and Latinx workers.

U.S. unemployment rate by race, 2000-2001. Recessions are shaded.

After stark declines in employment rates for both women and men amid the pandemic, men made small gains in April with no change to women’s employment rate.

Share of the U.S. population that is employed, by gender, 2007-2021. Recessions are shaded.

The unemployment rate for workers with less than a high school degree increased to 9.3 percent in April from 8.2 percent in March, while labor force participation also declined for this group of workers.

Unemployment rate by U.S. educational attainment, 2019-2020. Recessions are shaded.

The proportion of unemployed workers who were out of work for fewer than 5 weeks increased in April, offsetting the recent trend of increasing long-term unemployment.

Percent of all unemployed U.S. workers by length of time unemployed, 2019-2021.

As the unemployment rate was little changed in April, an increasing proportion of those out of work were on temporary layoff, left their job, or were new entrants to the labor force.

Percent of all unemployed workers in the United States by reason for unemployment 2019-2020

JOLTS Day Graphs: February 2021 Edition

Every month the U.S. Bureau of Labor Statistics releases data on hiring, firing, and other labor market flows from the Job Openings and Labor Turnover Survey, better known as JOLTS. Today, the BLS released the latest data for February 2021. This report doesn’t get as much attention as the monthly Employment Situation Report, but it contains useful information about the state of the U.S. labor market. Below are a few key graphs using data from the report.

The quits rate remained near it’s pre-pandemic level at 2.3 percent in February.

Quits as a percent of total U.S. employment 2001-2021. Recessions are shaded.

The vacancy yield for hires per job openings was 0.78 in February as the labor market continued to recover.

U.S. total nonfarm hires per total nonfarm job openings, 2001-2020. Recessions are shaded.

The job openings rate continued to increase to 4.9 percent while unemployment continued to decline to 6.2 percent, further decreasing the ratio of unemployed-worker-to-job-opening in February.

U.S. unemployed workers per total nonfarm job opening, 2001-2020. Recessions are shaded.

The Beveridge Curve moved upwards as job openings increased in February to levels typically seen at lower levels of unemployment.

The relationship between the U.S. unemployment rate and the job opening rate, 2001-2020.

Equitable Growth’s Jobs Day Graphs: March 2021 Report Edition

On April 2, the U.S. Bureau of Labor Statistics released new data on the U.S. labor market during the month of March. Below are five graphs compiled by Equitable Growth staff highlighting important trends in the data.

As the U.S. labor market added 916,000 jobs, the prime-age employment-to-population ratio increased 0.3 percentage points in March.

Share of 25- to 54-year-olds who are employed, 2000-2021. Recessions are shaded.

With the recovery continuing in sectors where Latinx employment is high, the Latinx unemployment rate decreased to 7.9 percent in March from 8.5 percent in February.

U.S. unemployment rate by race, 2000-2001. Recessions are shaded.

Employment growth in March was led by leisure and hospitality and education services as in-person activity was able to resume alongside a notable increase in construction.

Employment by major U.S. industry, indexed to average industry employment in 2007. Recessions are shaded.

Top-line unemployment, also known as U-3, and a broader measure of labor underutilization, known as U-6, fell in tandem in March.

U-3 and U-6 U.S. unemployment rates. Recessions are shaded.

As unemployment declined in March, fewer unemployed workers were temporarily laid off and more were reentering the labor force to look for work.

Percent of all unemployed U.S. workers by reason for unemployment, 2019-2020