JOLTS Day Graphs: May 2021 Edition

Every month the U.S. Bureau of Labor Statistics releases data on hiring, firing, and other labor market flows from the Job Openings and Labor Turnover Survey, better known as JOLTS. Today, the BLS released the latest data for May 2021. This report doesn’t get as much attention as the monthly Employment Situation Report, but it contains useful information about the state of the U.S. labor market. Below are a few key graphs using data from the report.

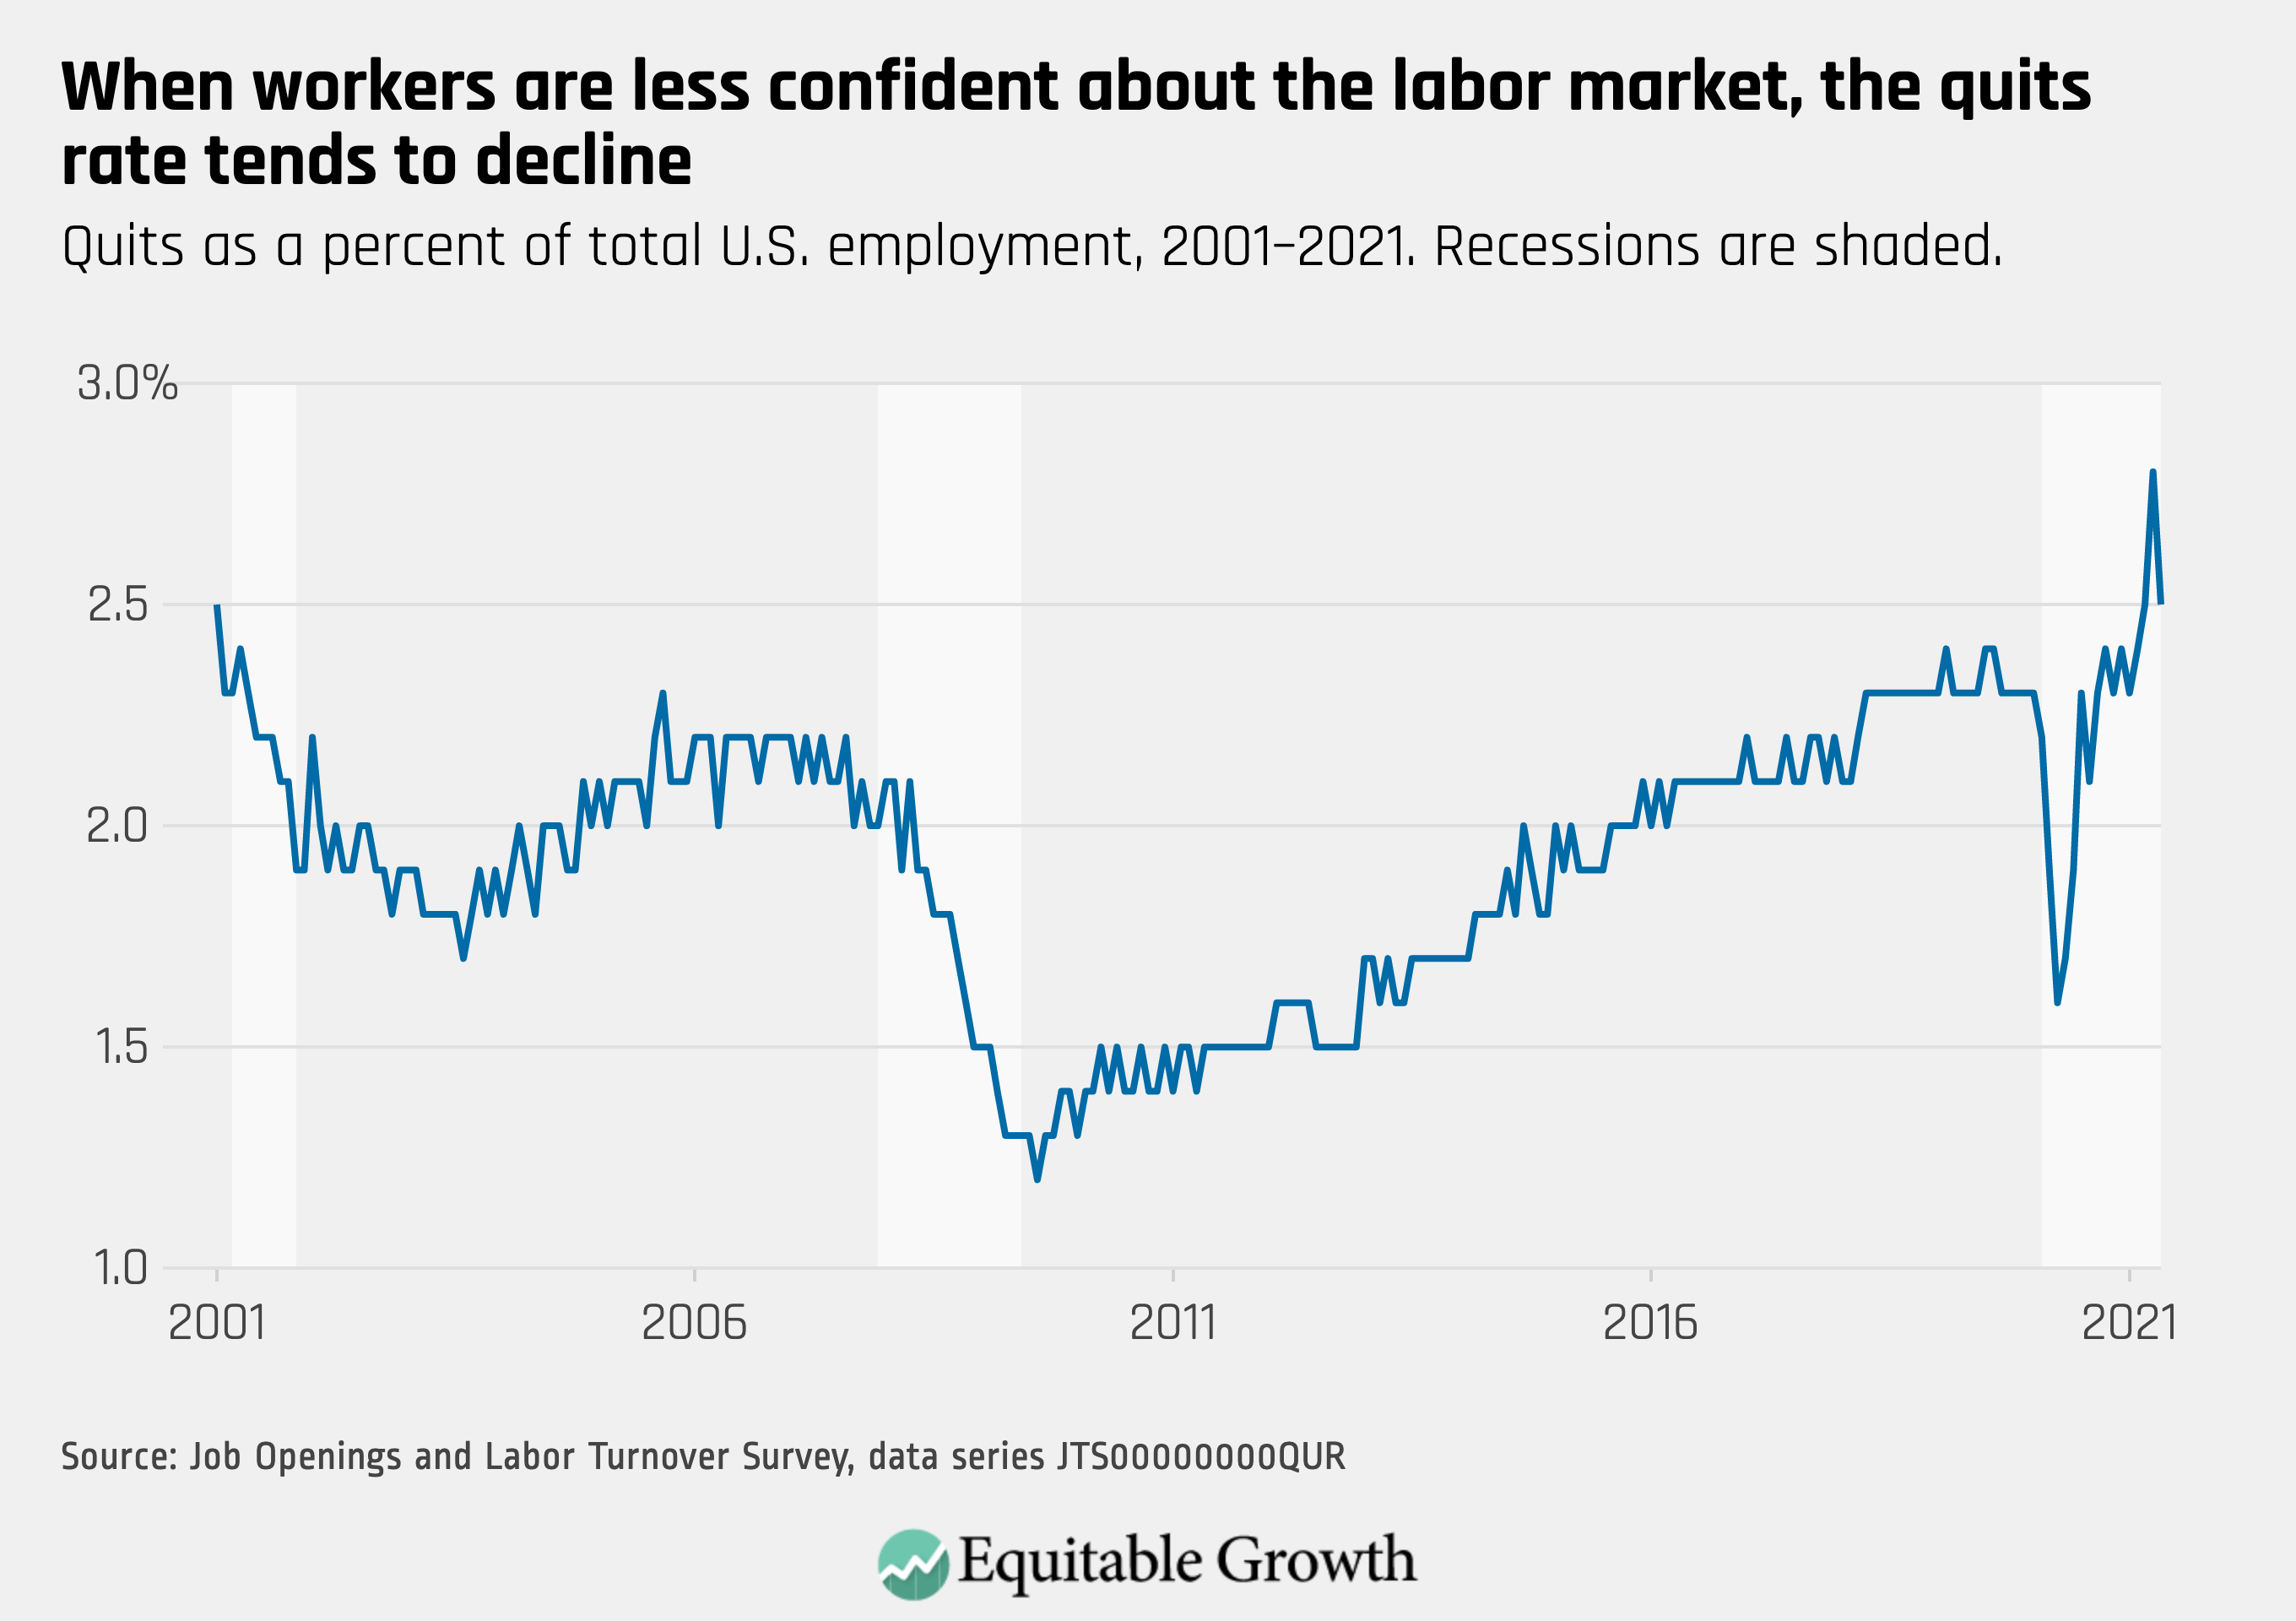
The quits rate declined to 2.5 percent as nearly 3.6 million workers quit their jobs in May, down from a series high in April.

Quits as a percent of total U.S. employment, 2001-2021. Recessions are shaded.

The vacancy yield declined slightly, remaining extremely low as job openings and hires stayed relatively constant in May.

U.S. total nonfarm hires per total nonfarm job openings, 2001-2021. Recessions are shaded.

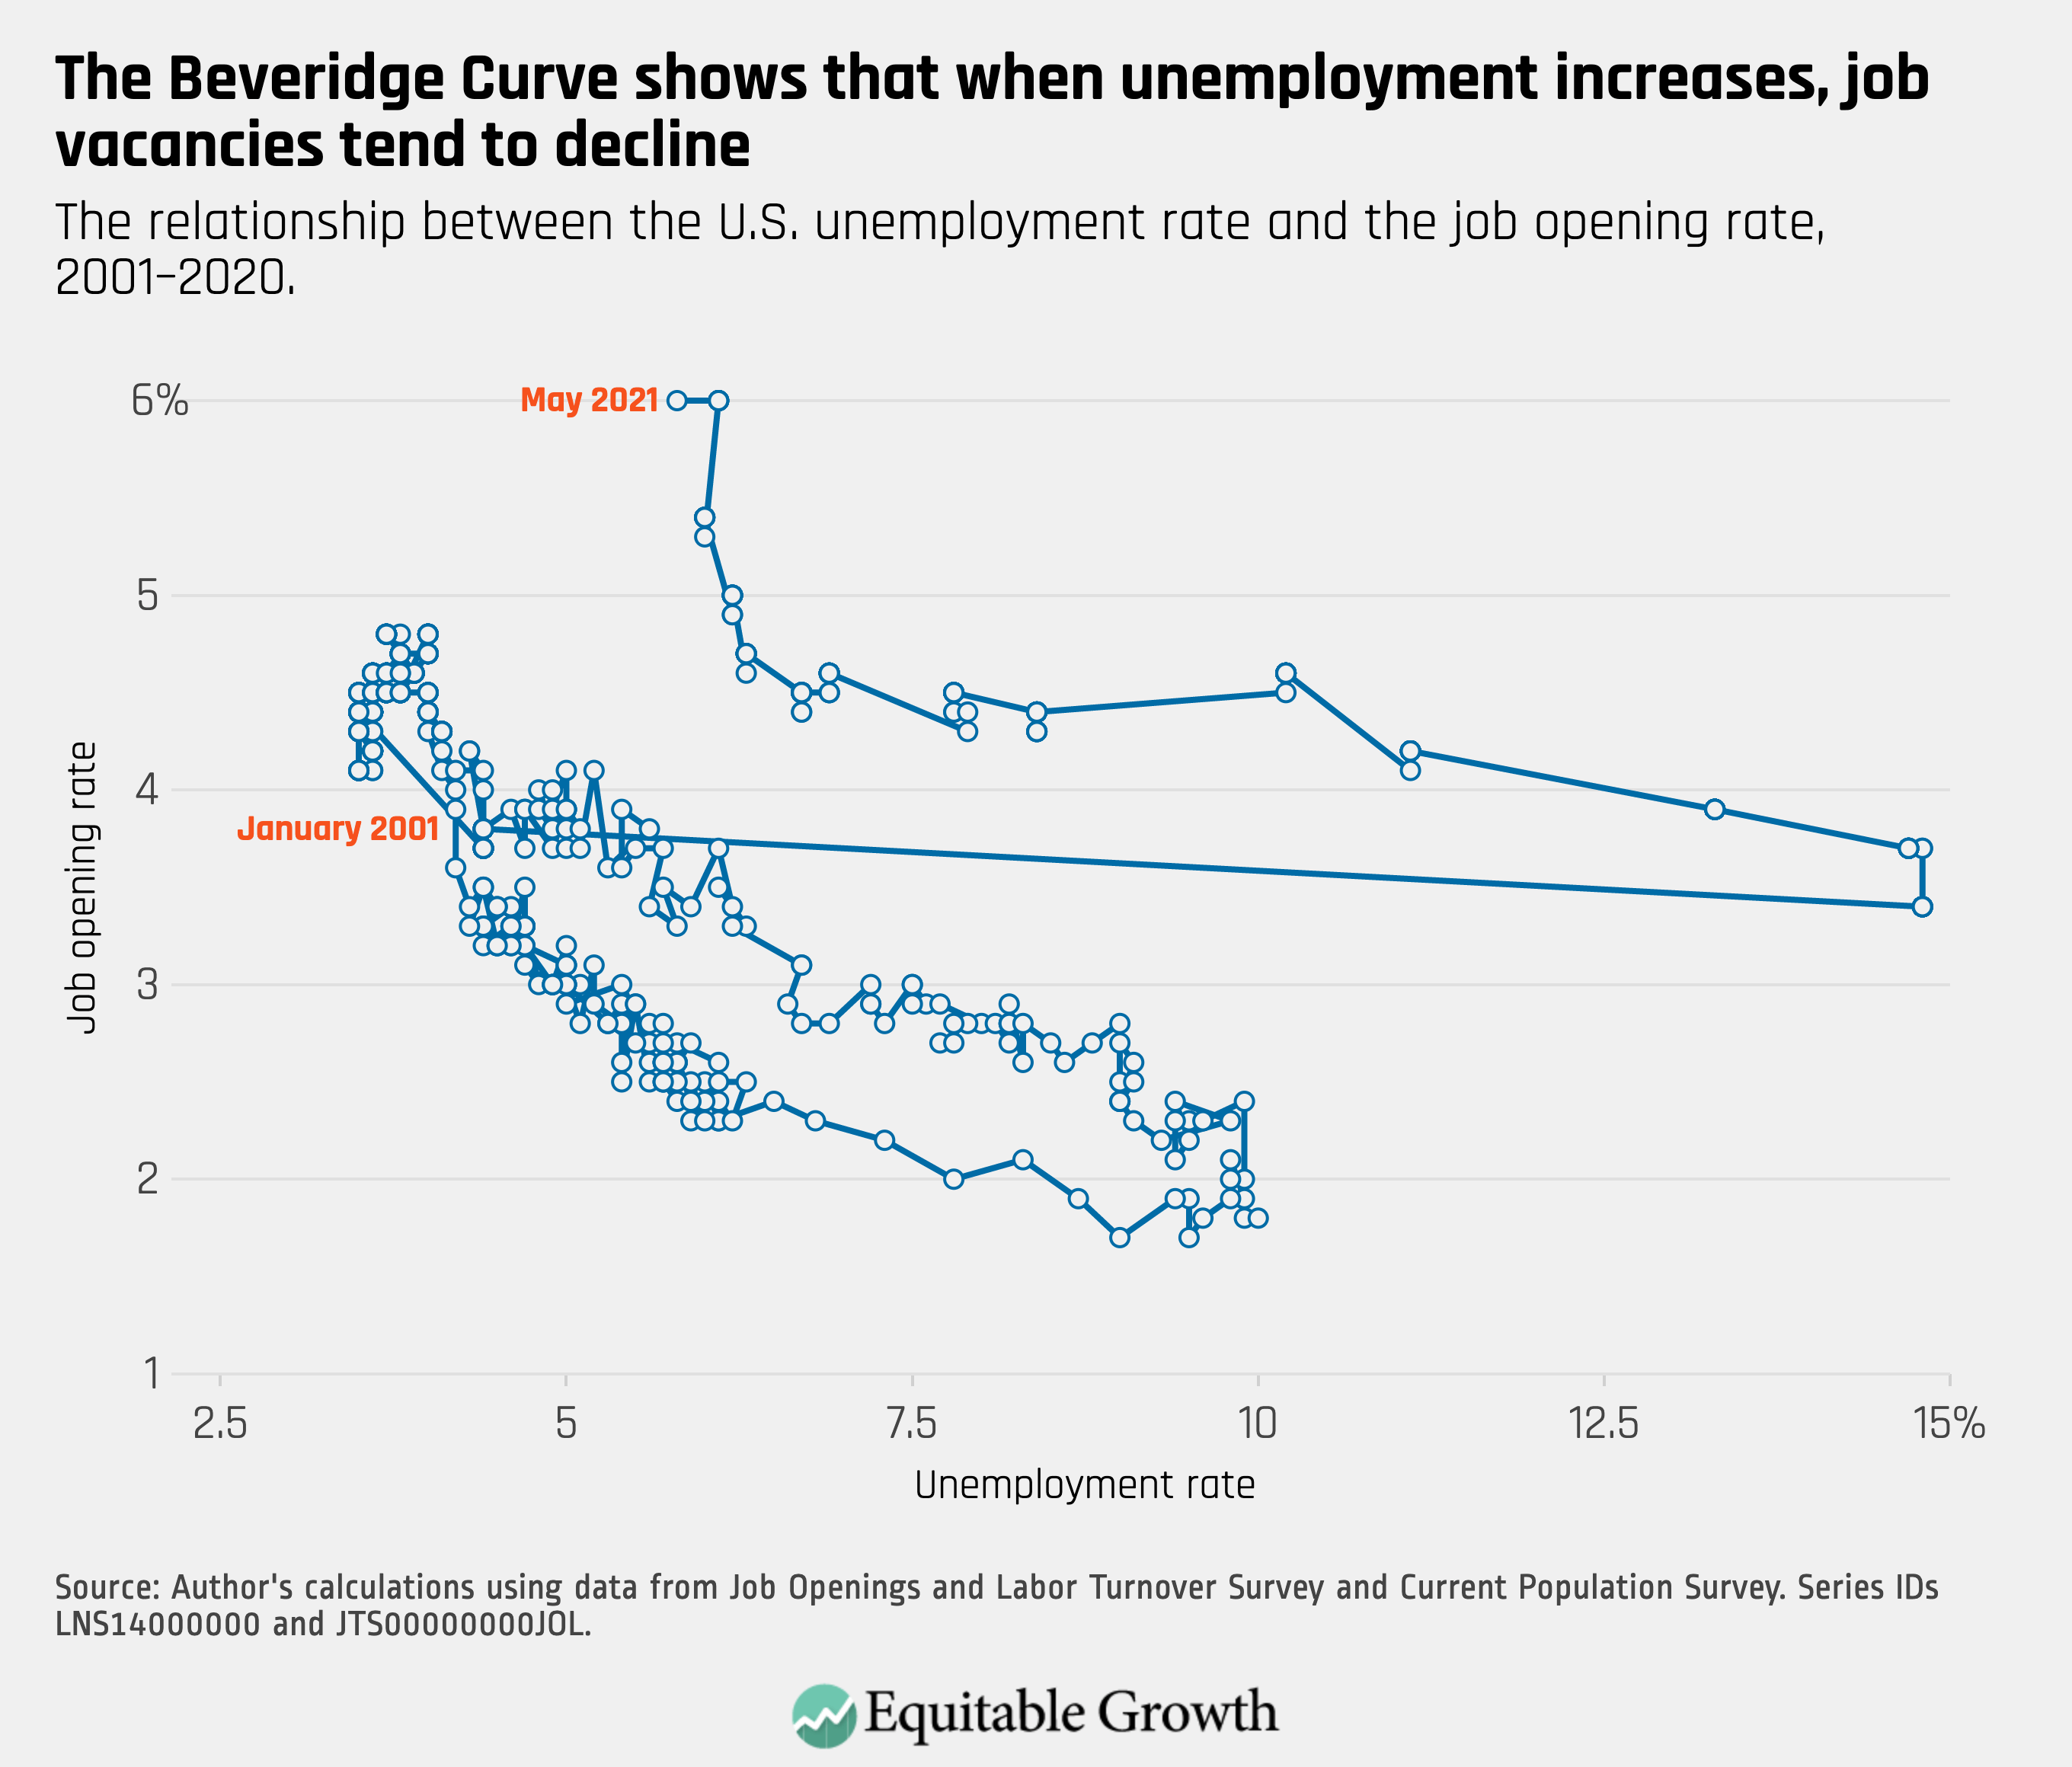
The ratio of unemployed-worker-per-job-opening was 1.01 in May, approaching its level of less than 1.0 prior to the coronavirus recession. 

U.S. unemployed workers per total nonfarm job opening, 2001-2020. Recessions are shaded.

The Beveridge Curve continues to be in an atypical range compared to previous business cycles, as the unemployment rate declined slightly but job openings remained elevated.

The relationship between the U.S. unemployment rate and the job opening rate, 2001-2020
Connect with us!

Explore the Equitable Growth network of experts around the country and get answers to today's most pressing questions!

Get in Touch