Equitable Growth’s Jobs Day Graphs: March 2021 Report Edition
On April 2, the U.S. Bureau of Labor Statistics released new data on the U.S. labor market during the month of March. Below are five graphs compiled by Equitable Growth staff highlighting important trends in the data.
As the U.S. labor market added 916,000 jobs, the prime-age employment-to-population ratio increased 0.3 percentage points in March.

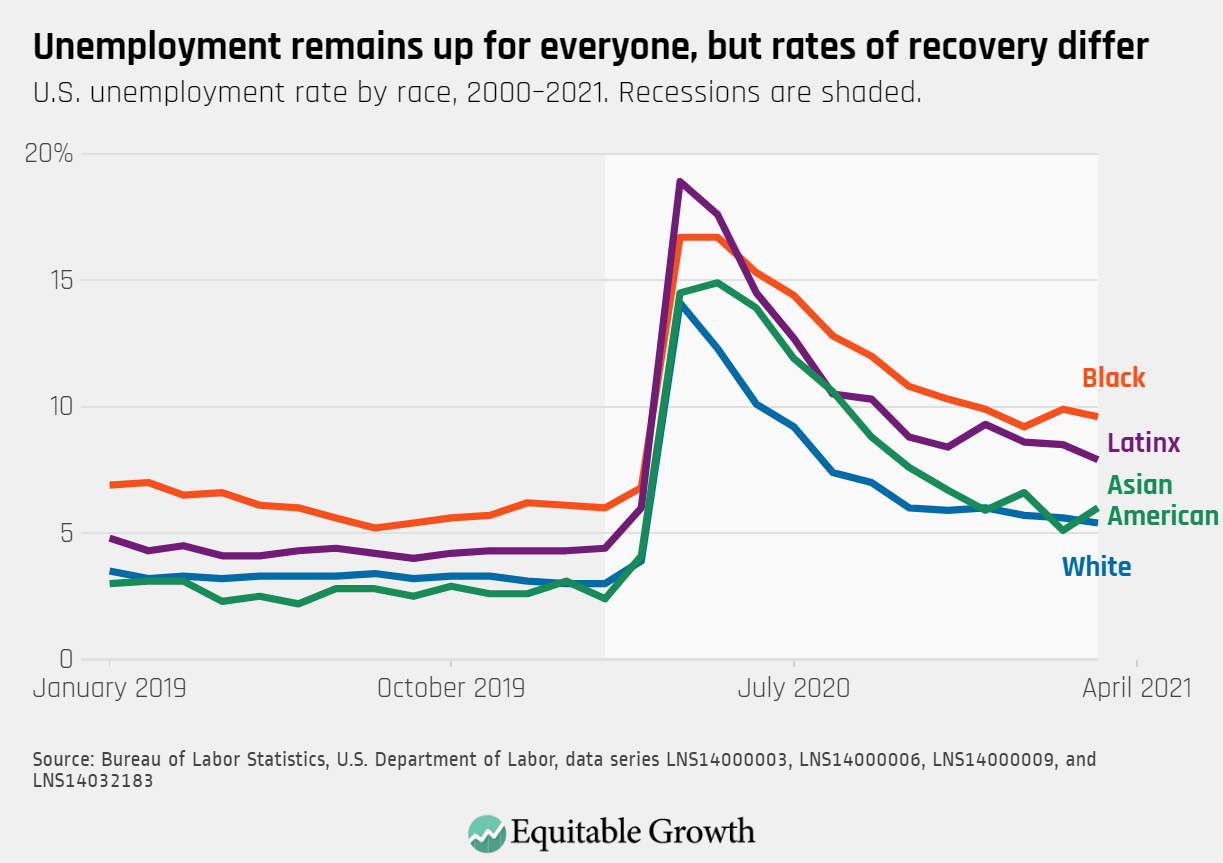
With the recovery continuing in sectors where Latinx employment is high, the Latinx unemployment rate decreased to 7.9 percent in March from 8.5 percent in February.
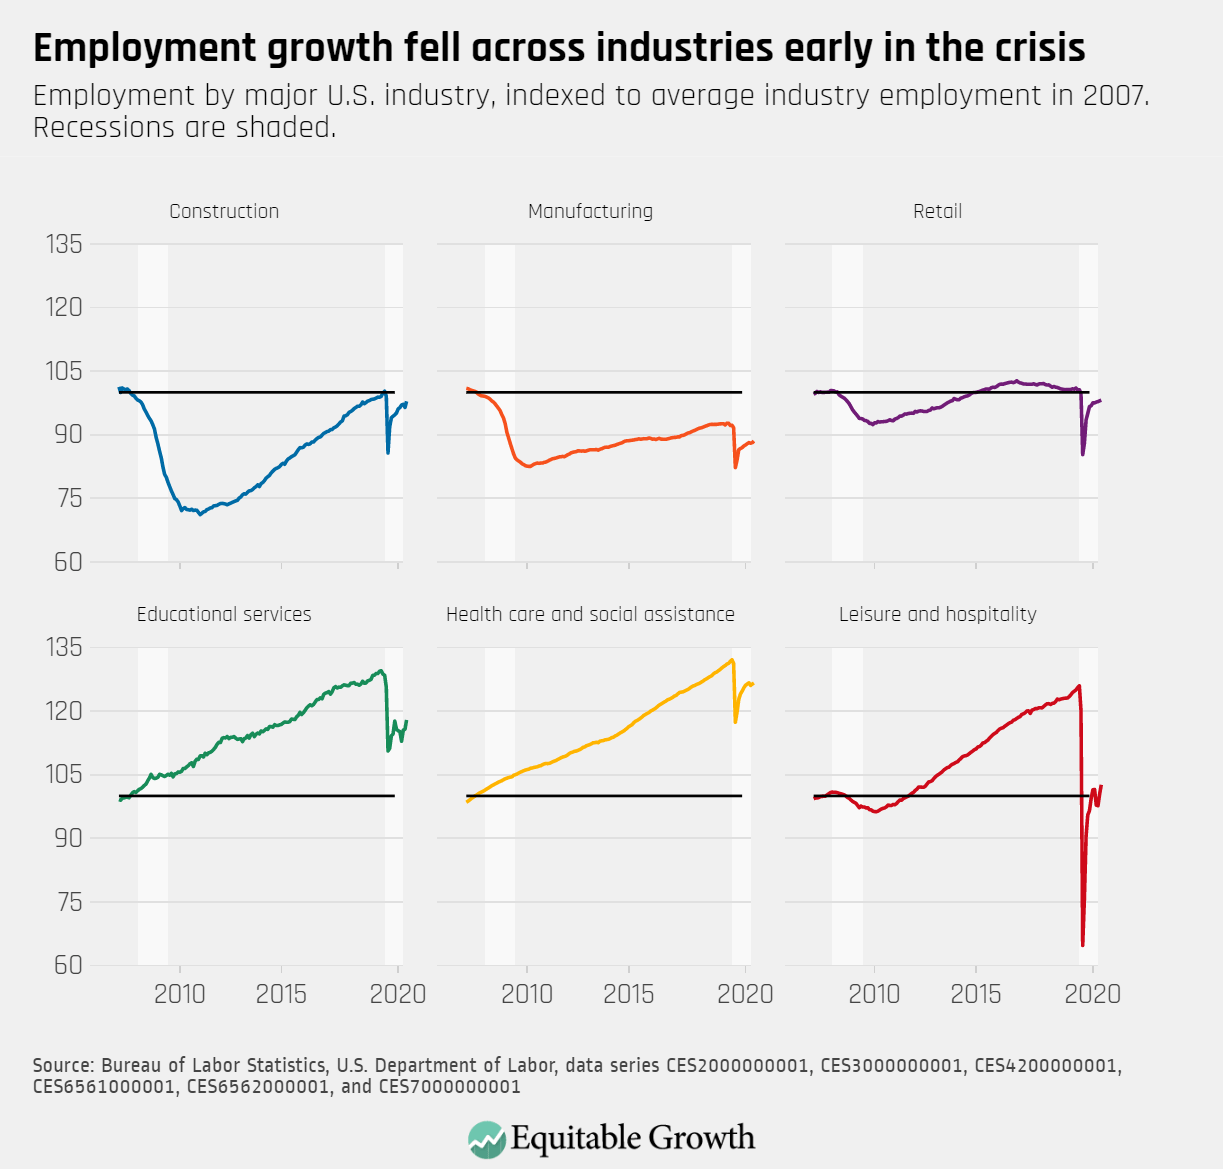
Employment growth in March was led by leisure and hospitality and education services as in-person activity was able to resume alongside a notable increase in construction.
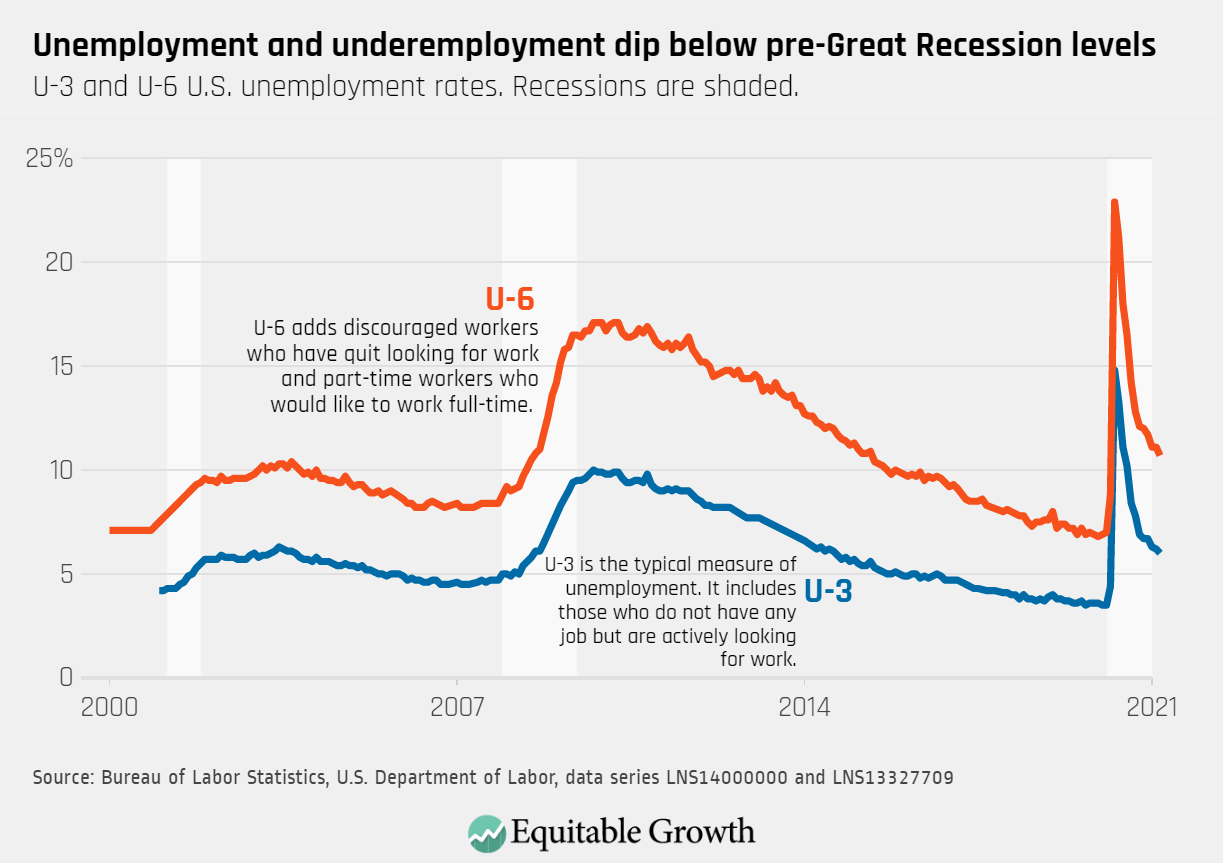
Top-line unemployment, also known as U-3, and a broader measure of labor underutilization, known as U-6, fell in tandem in March.
As unemployment declined in March, fewer unemployed workers were temporarily laid off and more were reentering the labor force to look for work.
