Equitable Growth’s Jobs Day Graphs: April 2021 Report Edition
On May 7, the U.S. Bureau of Labor Statistics released new data on the U.S. labor market during the month of April. Below are five graphs compiled by Equitable Growth staff highlighting important trends in the data.
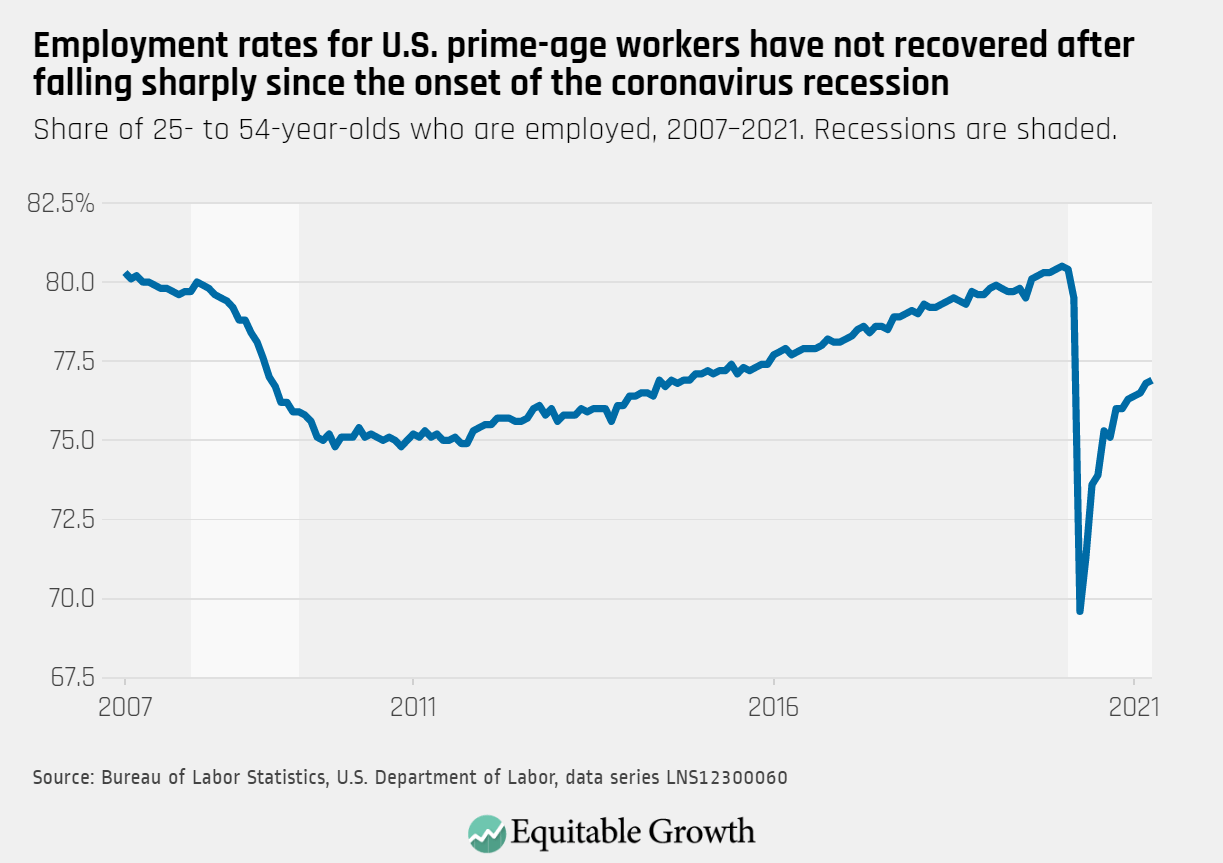
With fewer jobs added than expected in April, prime-age employment increased only slightly to 76.9 percent from 76.8 percent in March.
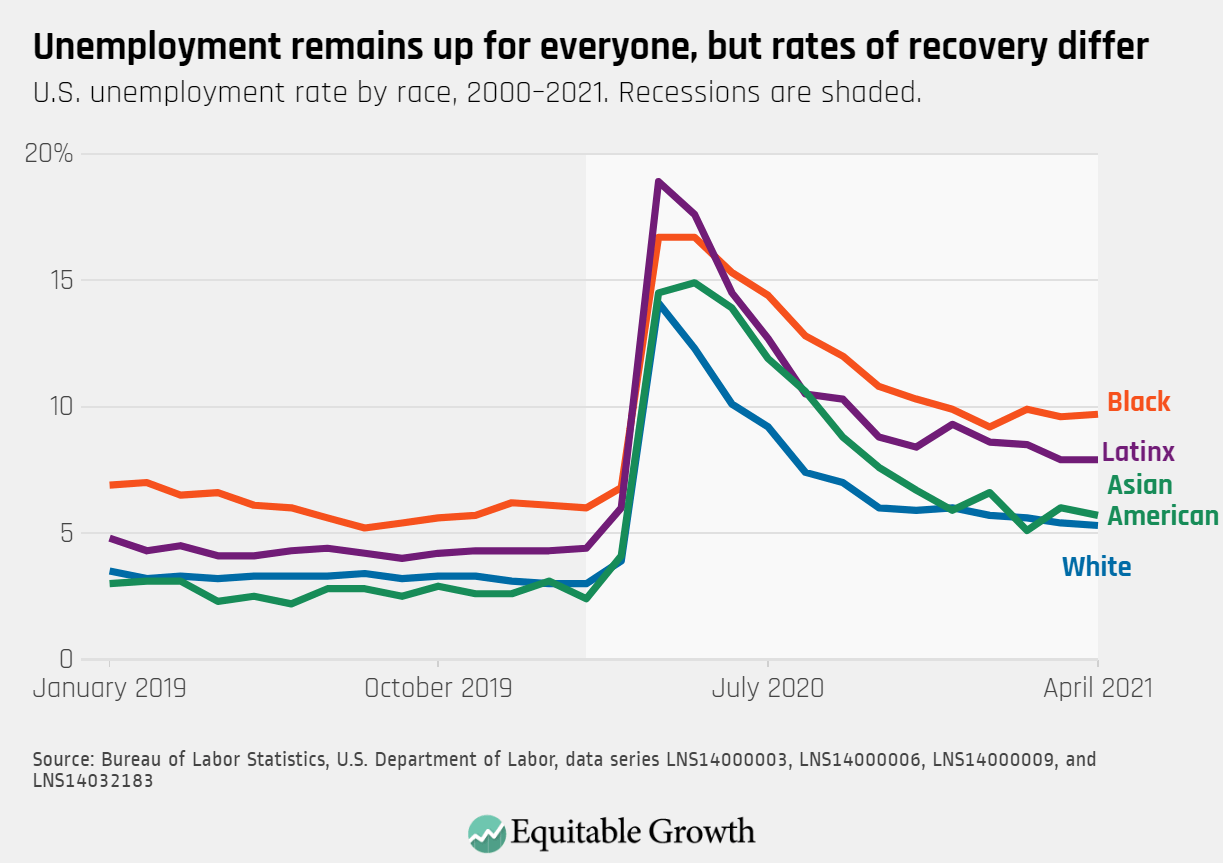
Unemployment rates were little changed among most racial and ethnic groups and remain persistently high for Black and Latinx workers.
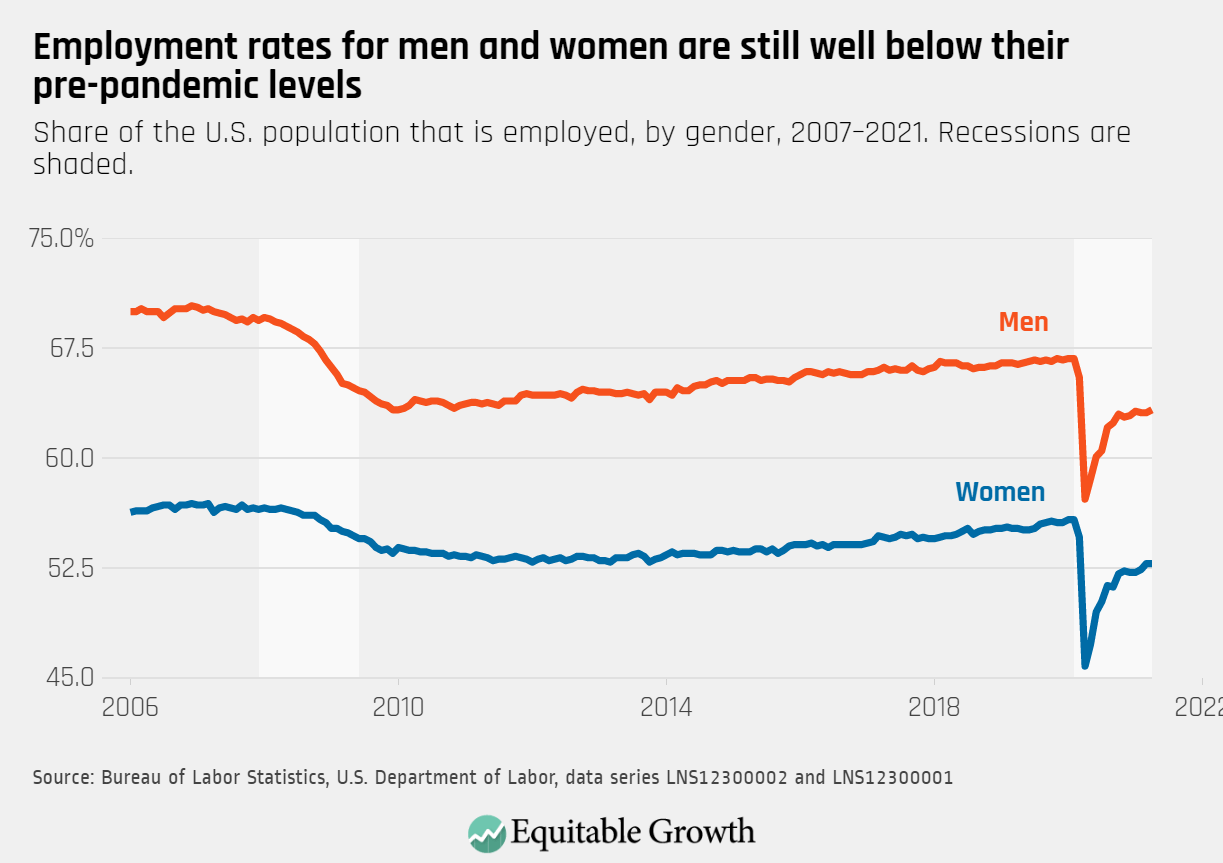
After stark declines in employment rates for both women and men amid the pandemic, men made small gains in April with no change to women’s employment rate.
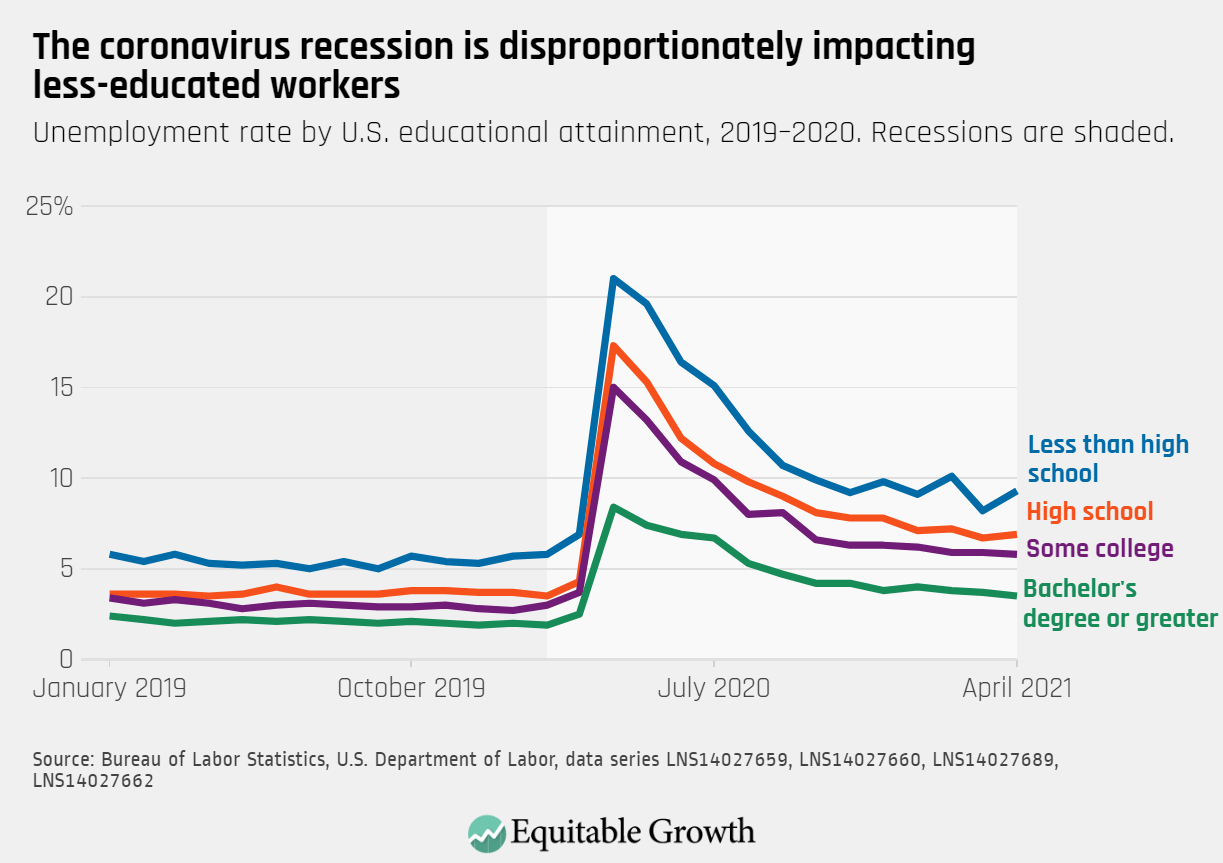
The unemployment rate for workers with less than a high school degree increased to 9.3 percent in April from 8.2 percent in March, while labor force participation also declined for this group of workers.
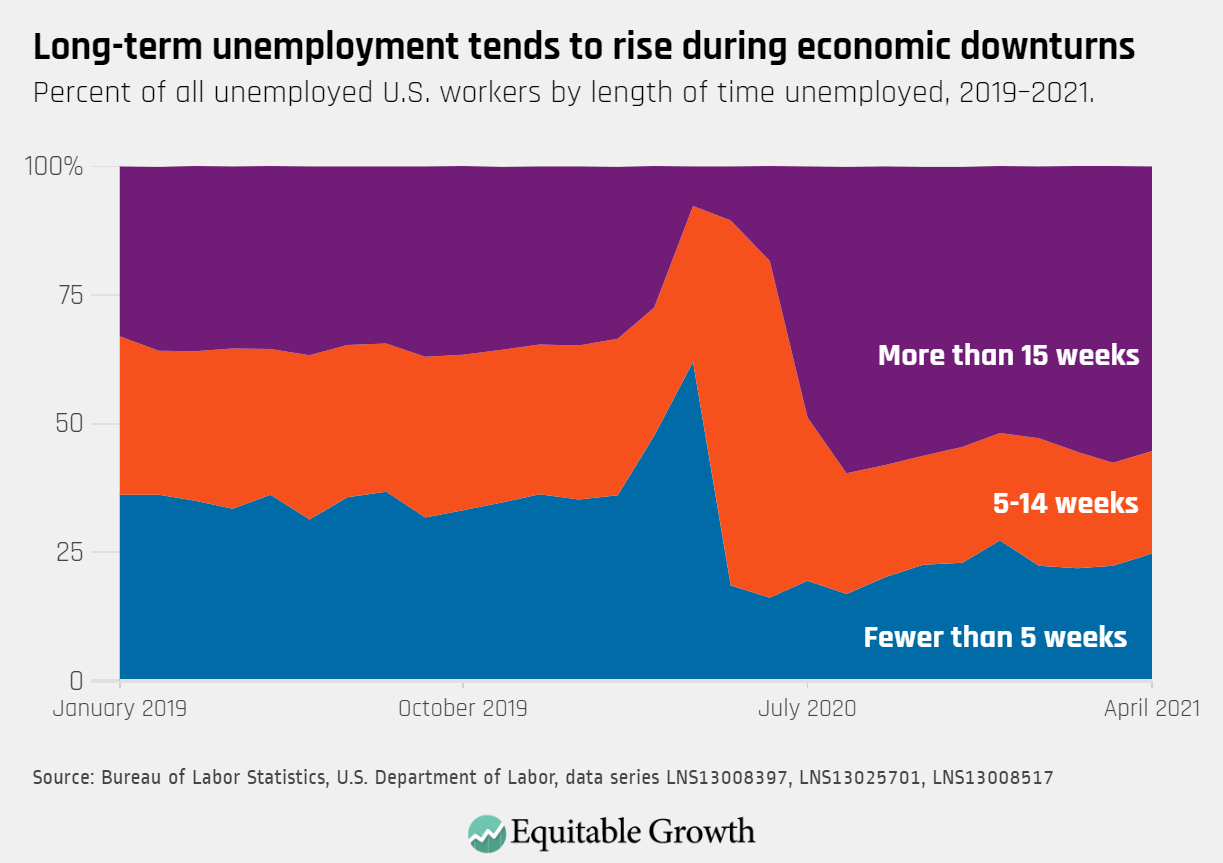
The proportion of unemployed workers who were out of work for fewer than 5 weeks increased in April, offsetting the recent trend of increasing long-term unemployment.
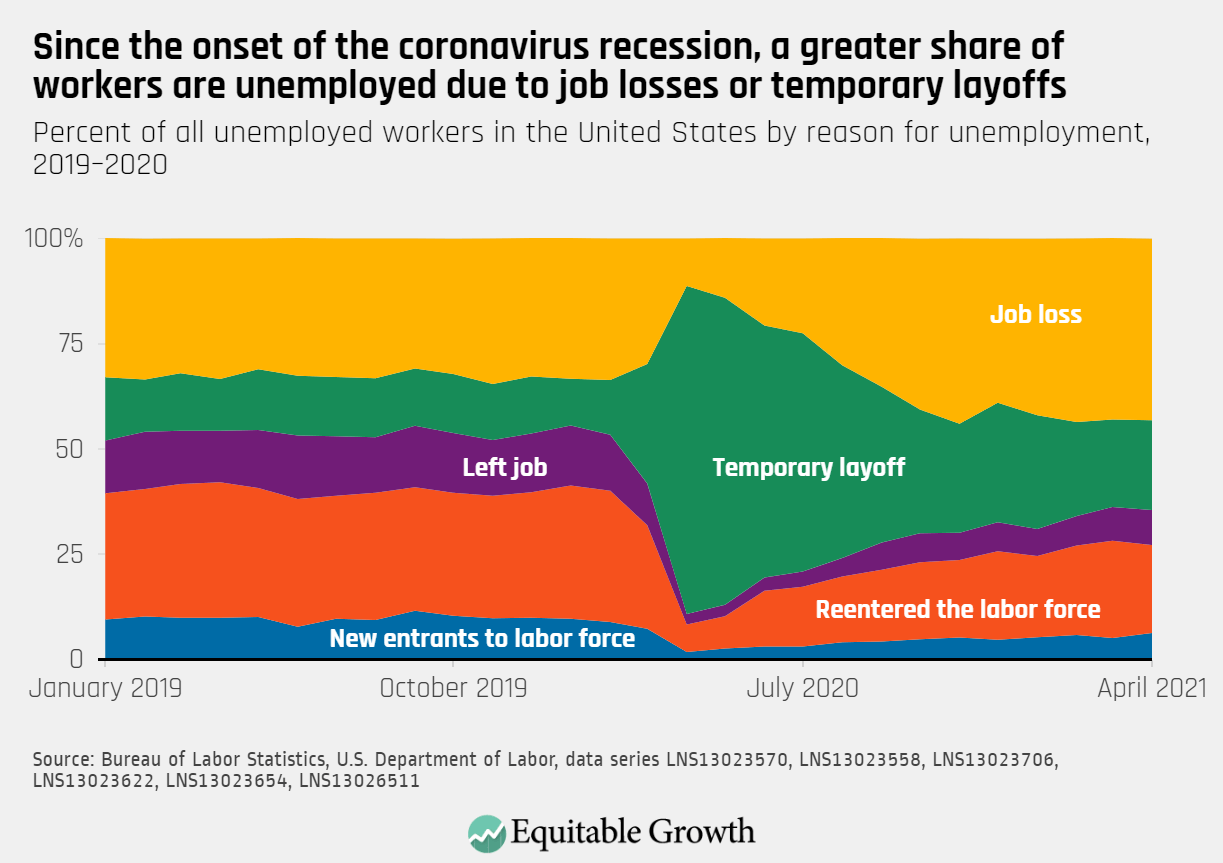
As the unemployment rate was little changed in April, an increasing proportion of those out of work were on temporary layoff, left their job, or were new entrants to the labor force.