JOLTS Day Graphs: January 2021 Edition

Every month the U.S. Bureau of Labor Statistics releases data on hiring, firing, and other labor market flows from the Job Openings and Labor Turnover Survey, better known as JOLTS. Today, the BLS released the latest data for January 2021. This report doesn’t get as much attention as the monthly Employment Situation Report, but it contains useful information about the state of the U.S. labor market. Below are a few key graphs using data from the report.

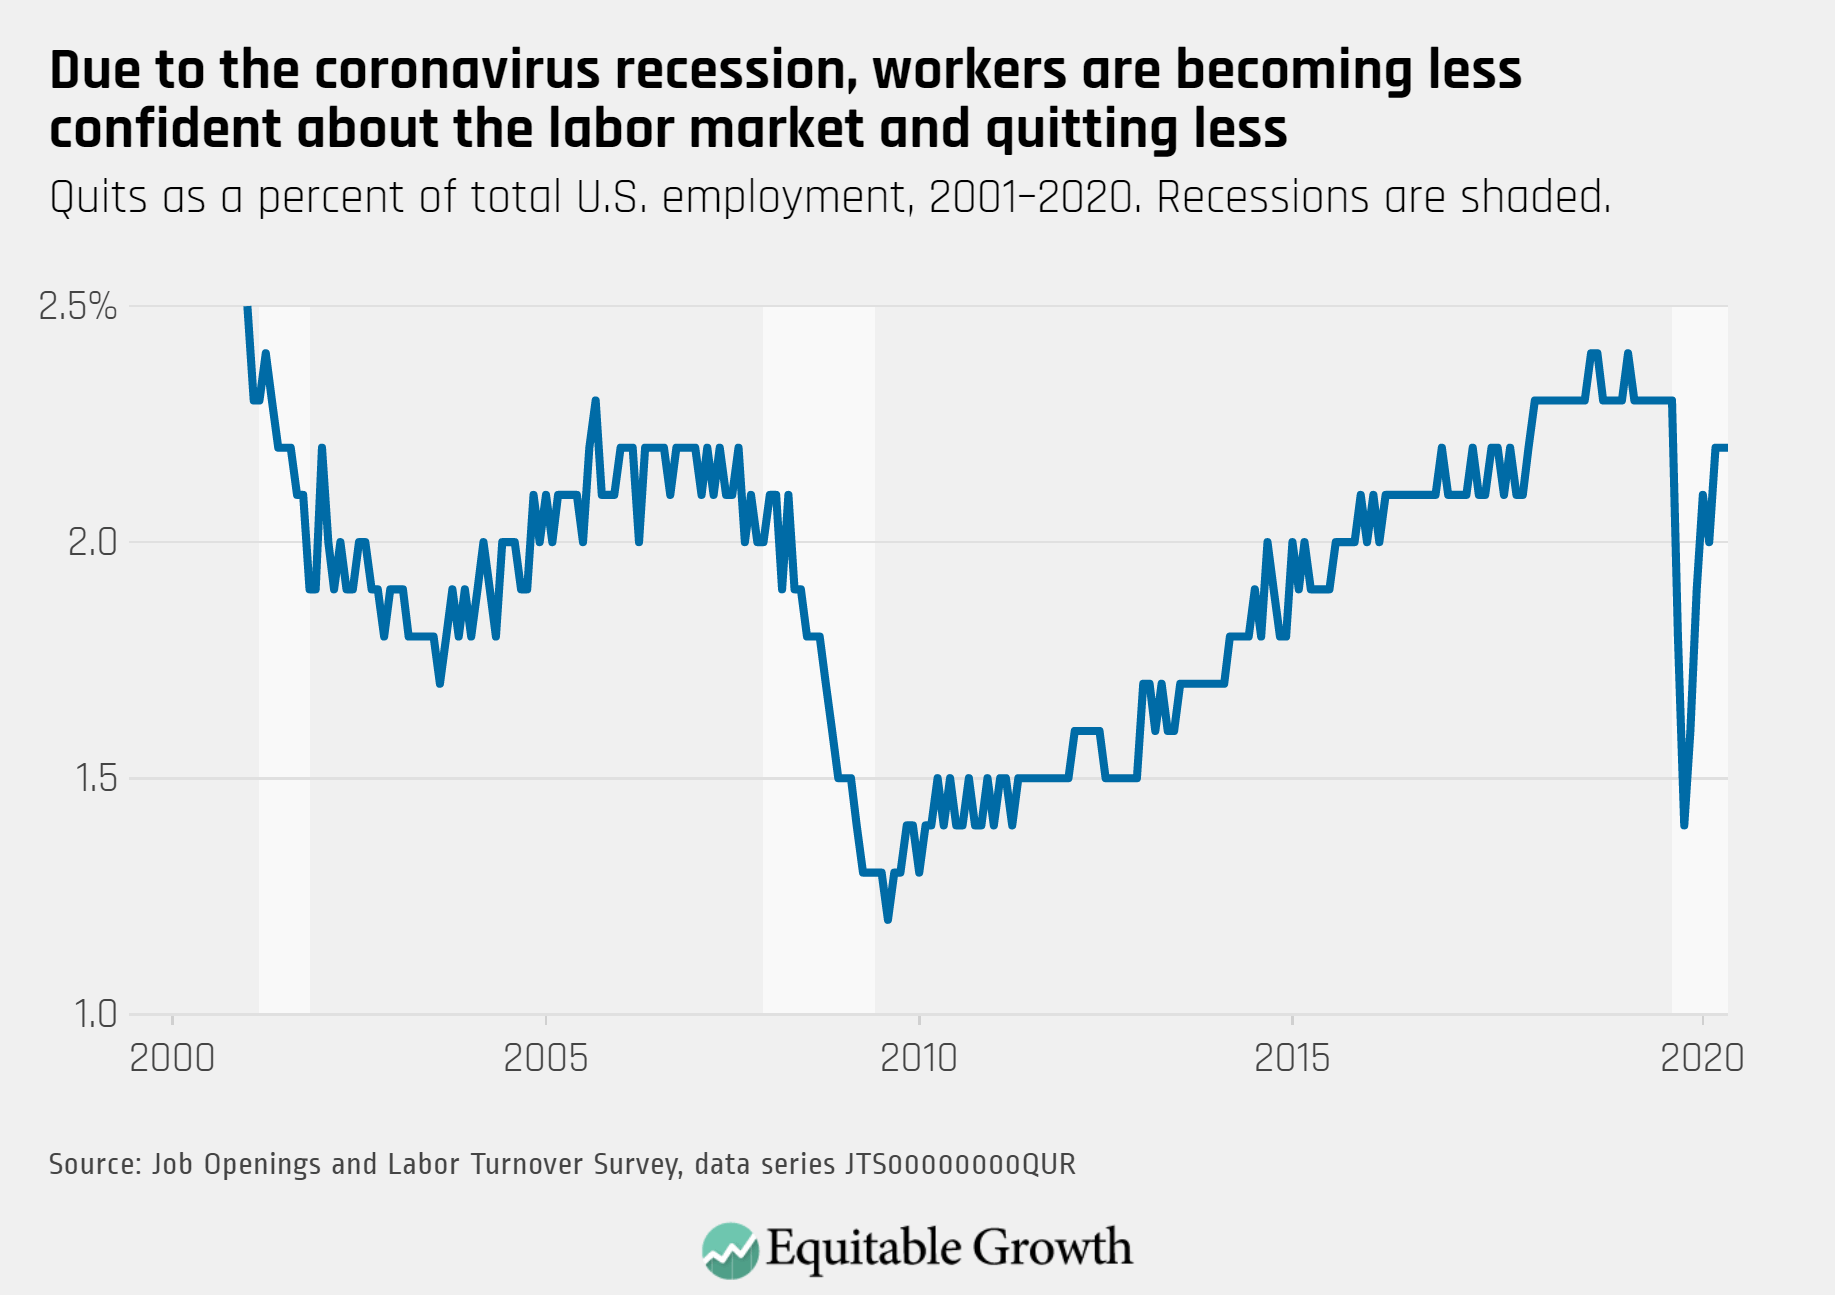
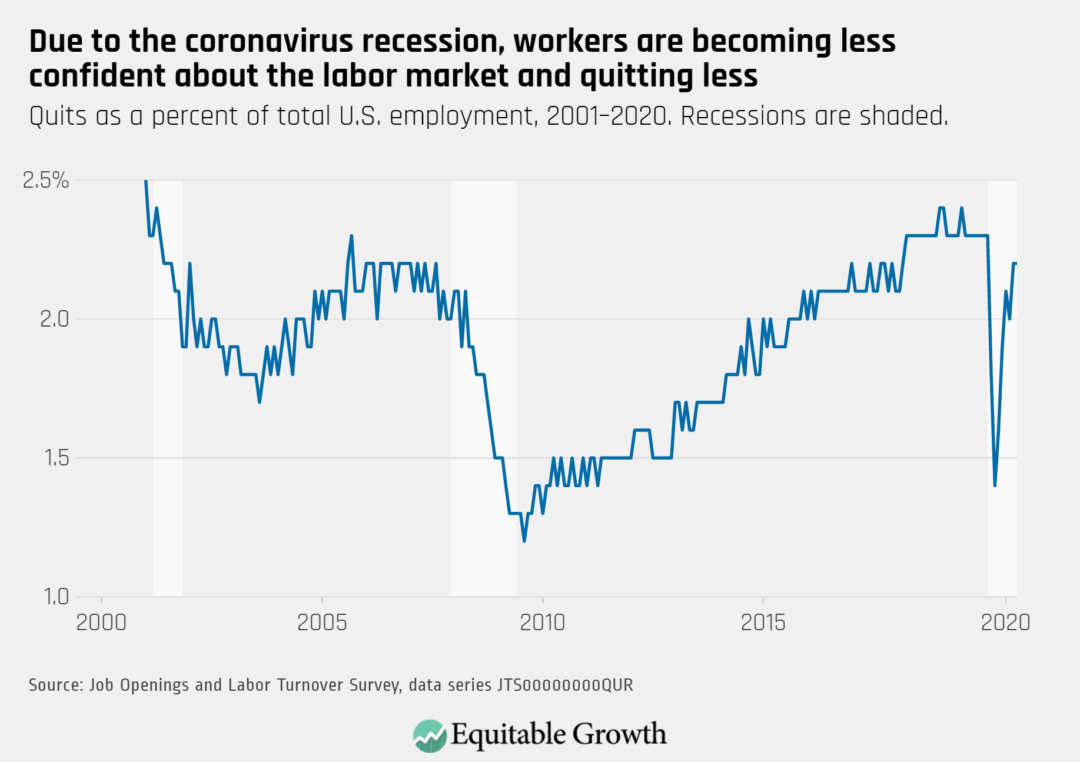
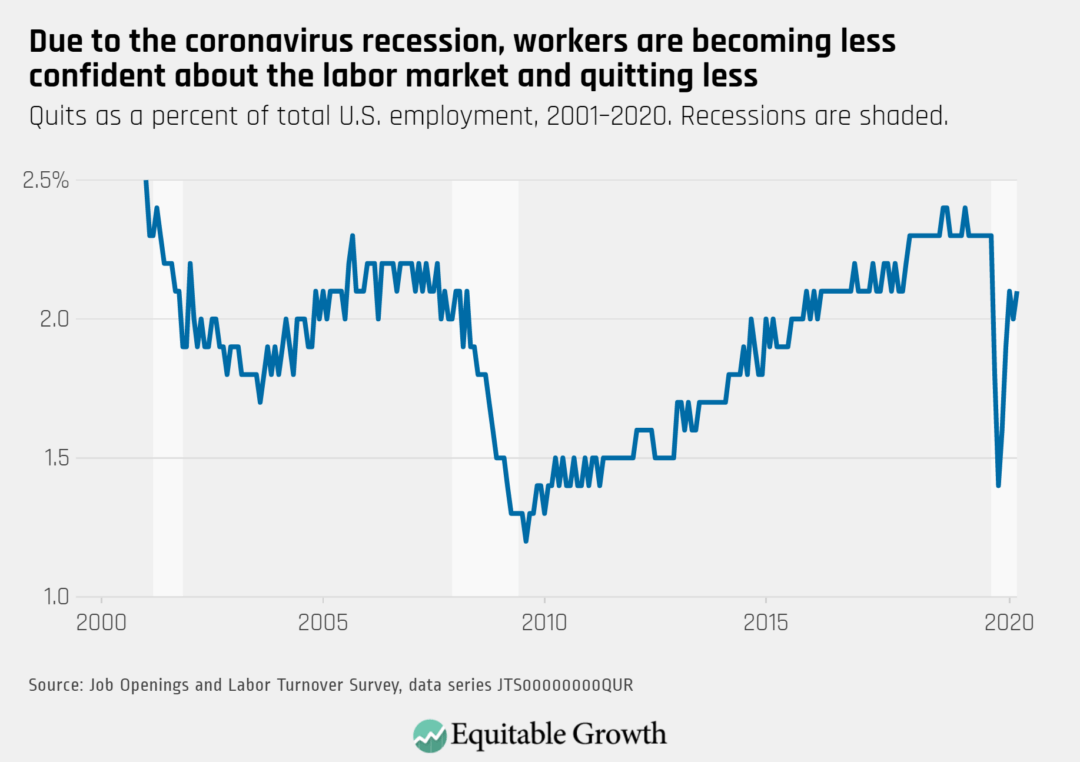
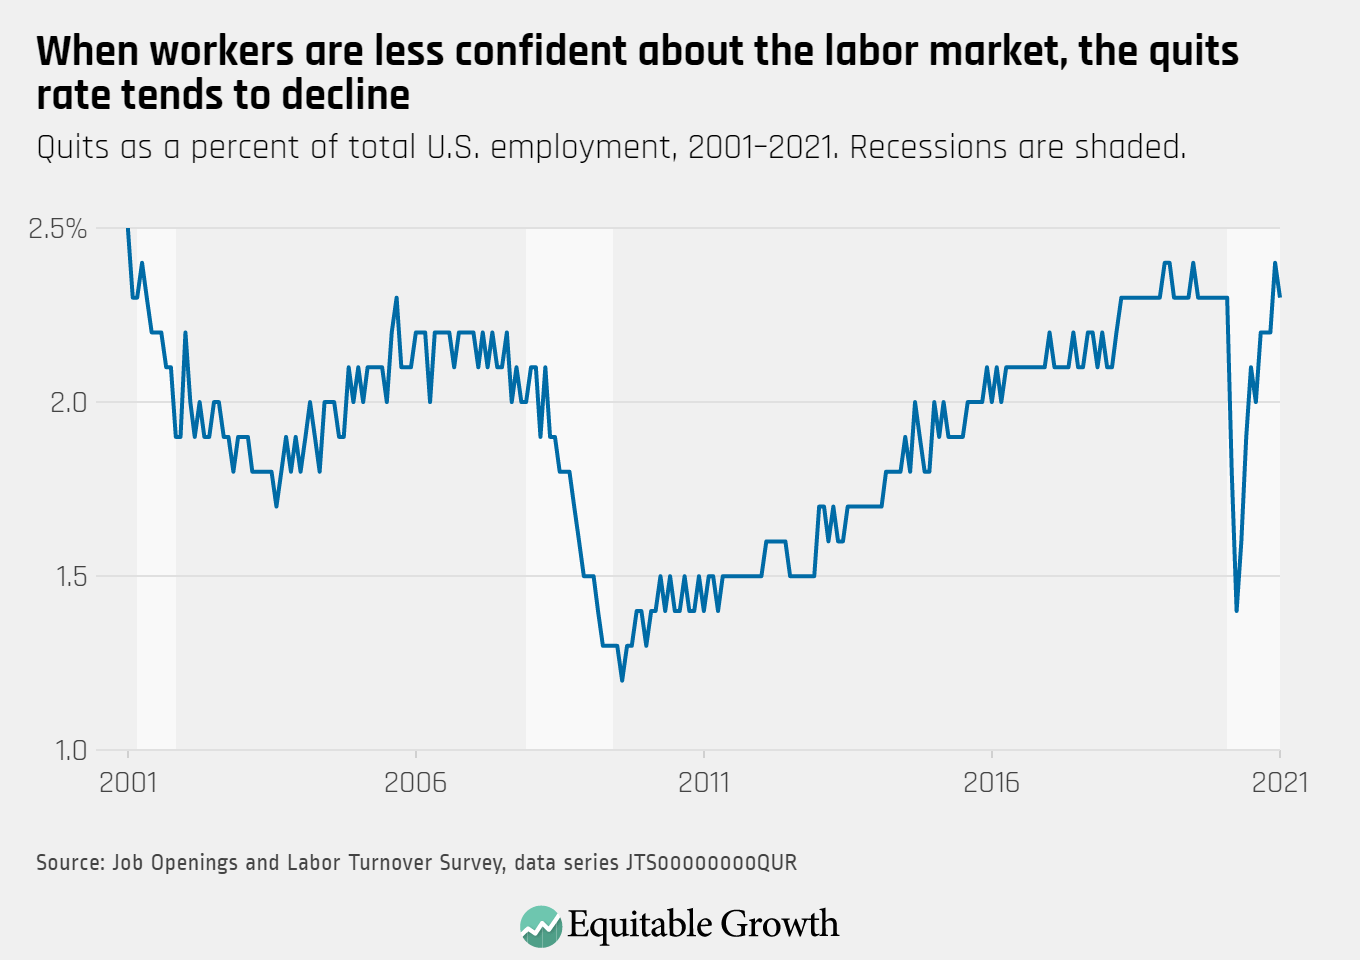
The quits rate declined slightly to 2.3 percent in January, but remains at pre-pandemic levels following the sharp recovery that began in the summer.

Quits as a percent of total U.S. employment, 2001–2021

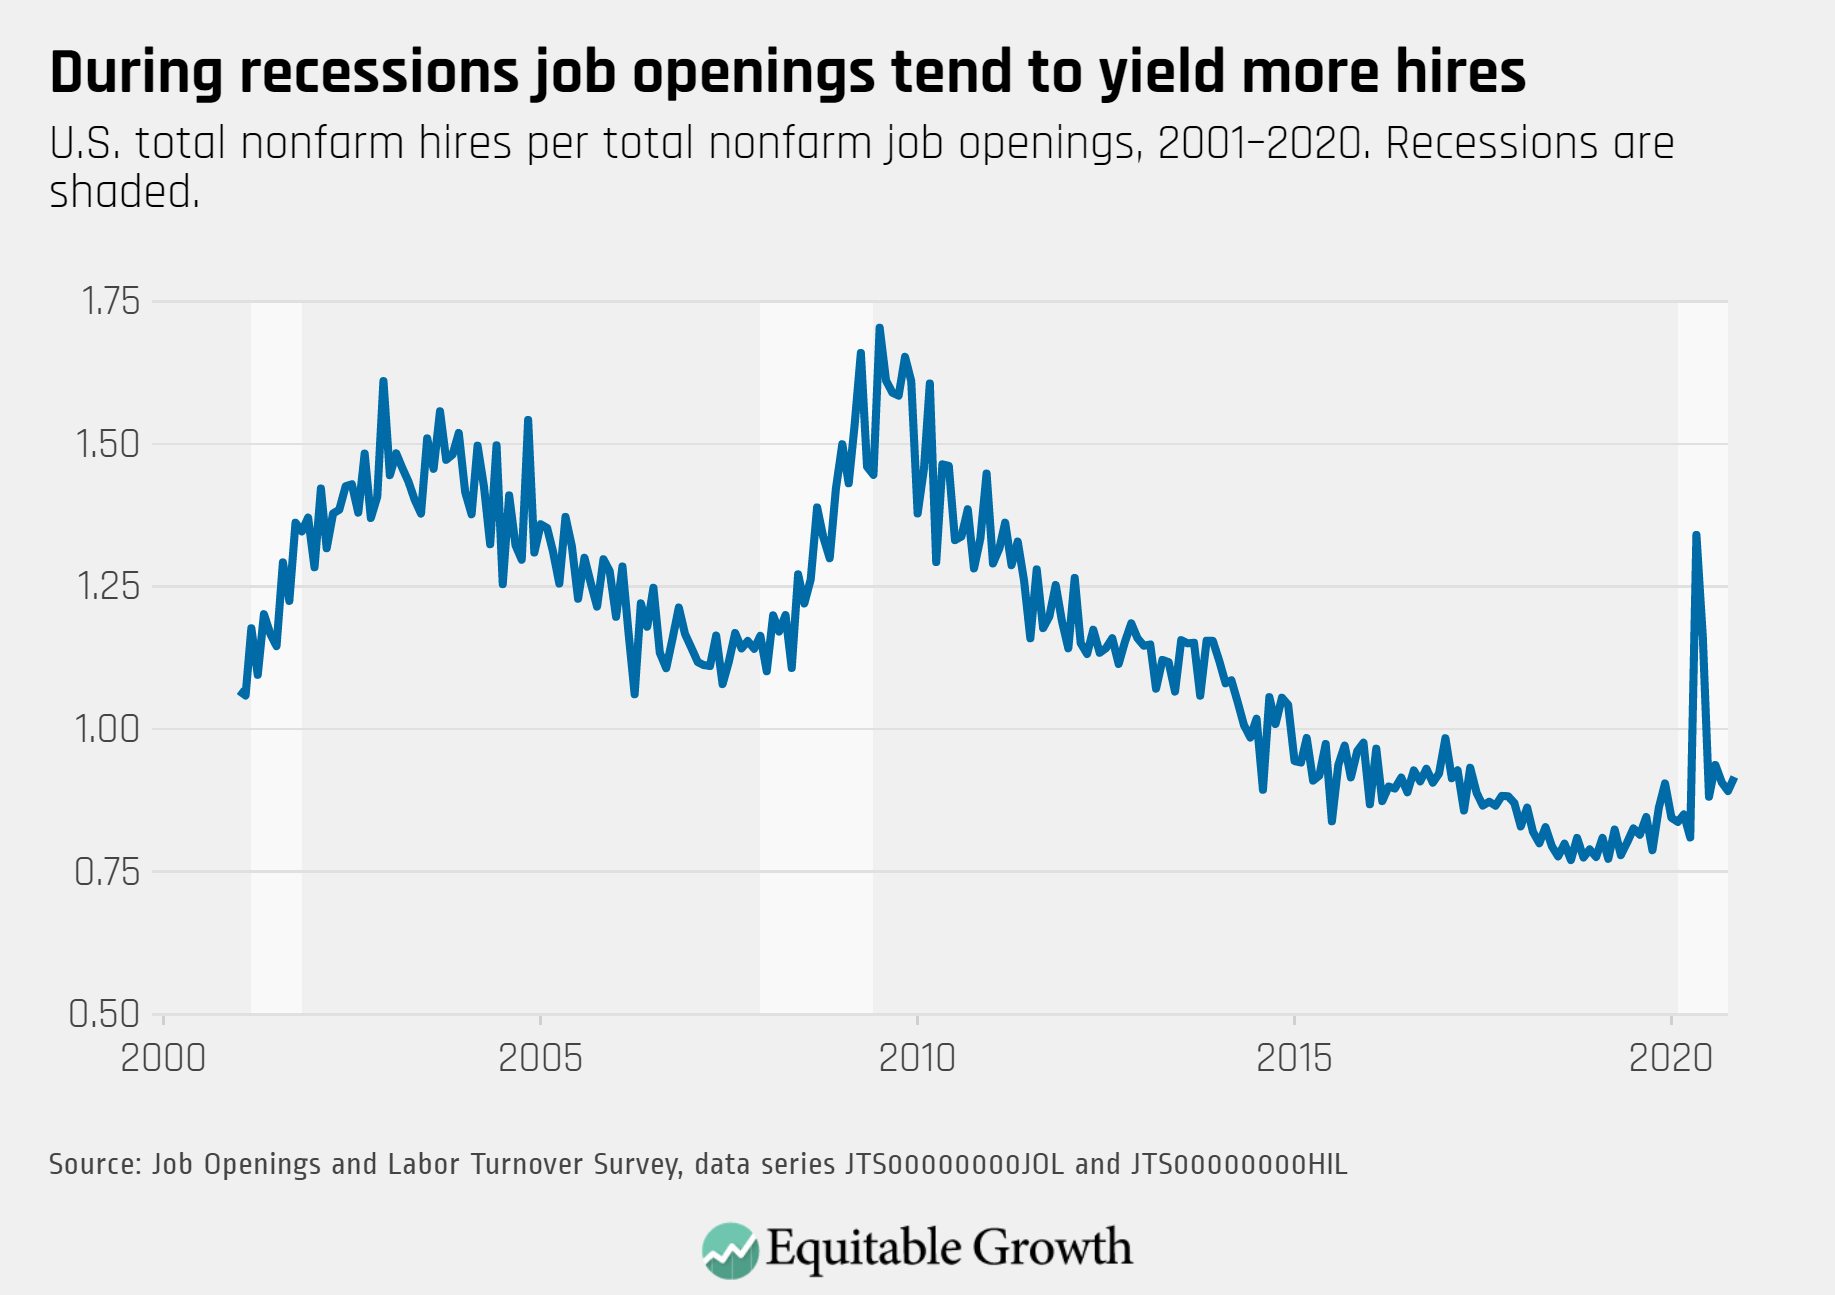
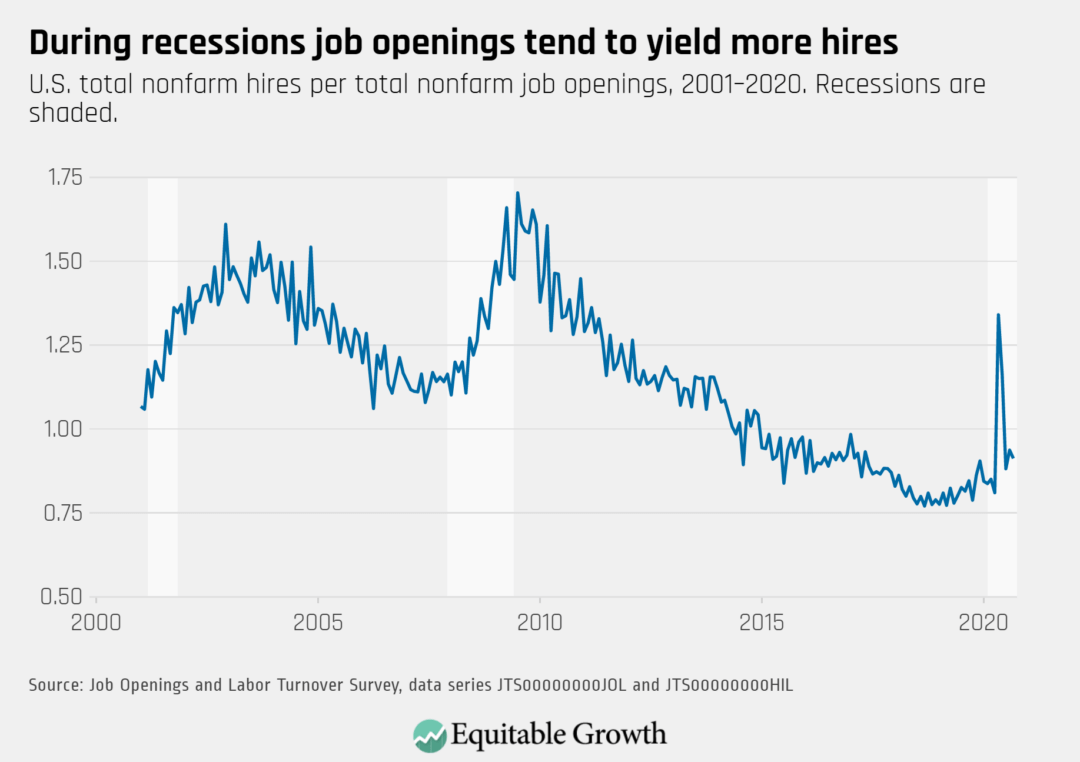
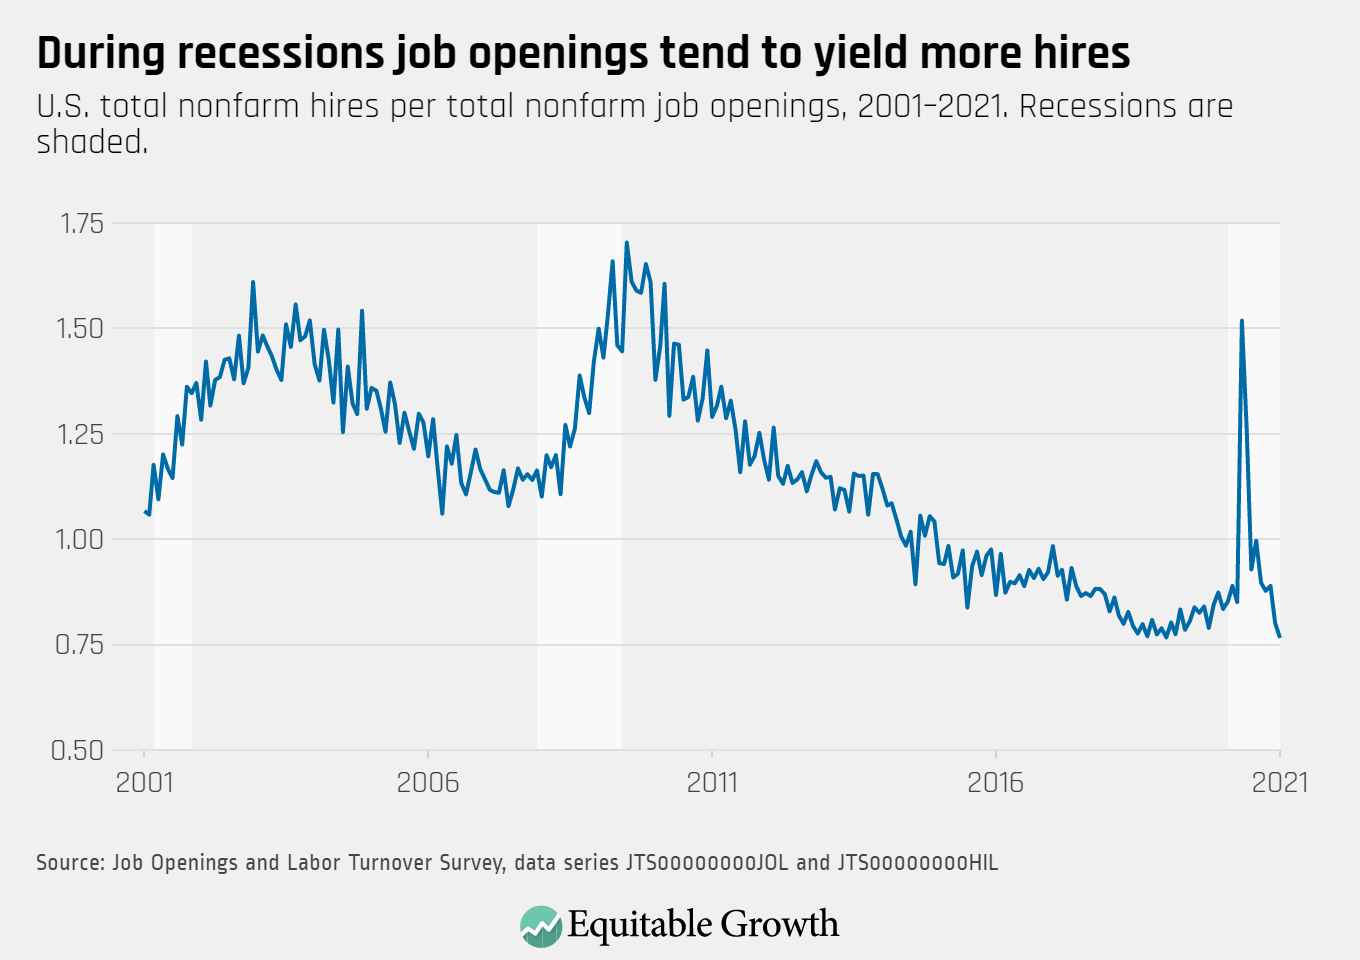
The job opening rate increased slightly while the hire rate decreased slightly in January, leading to a decrease in the vacancy yield for openings-to-hires.

U.S. total nonfarm hires per total nonfarm job openings, 2001–2021

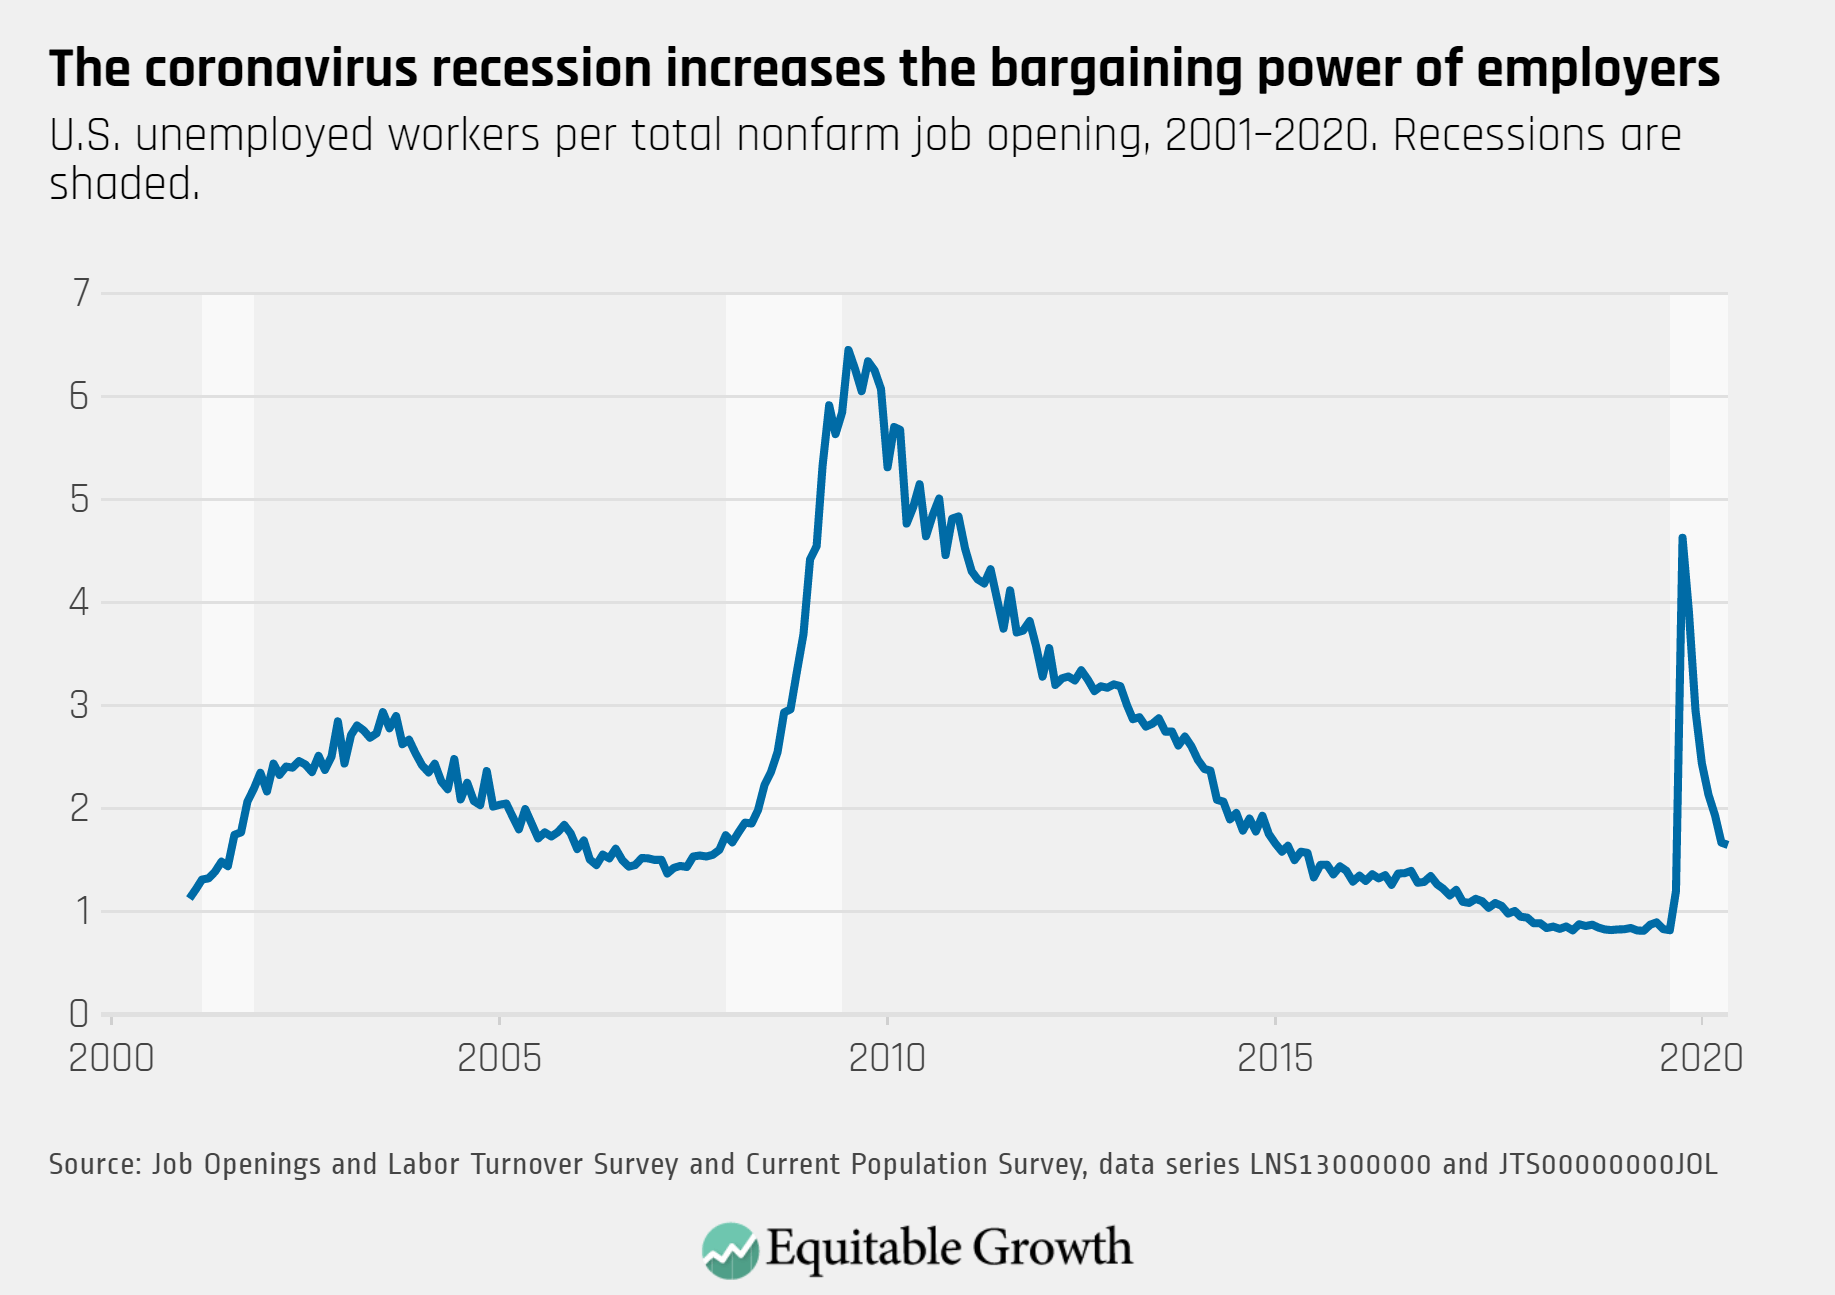
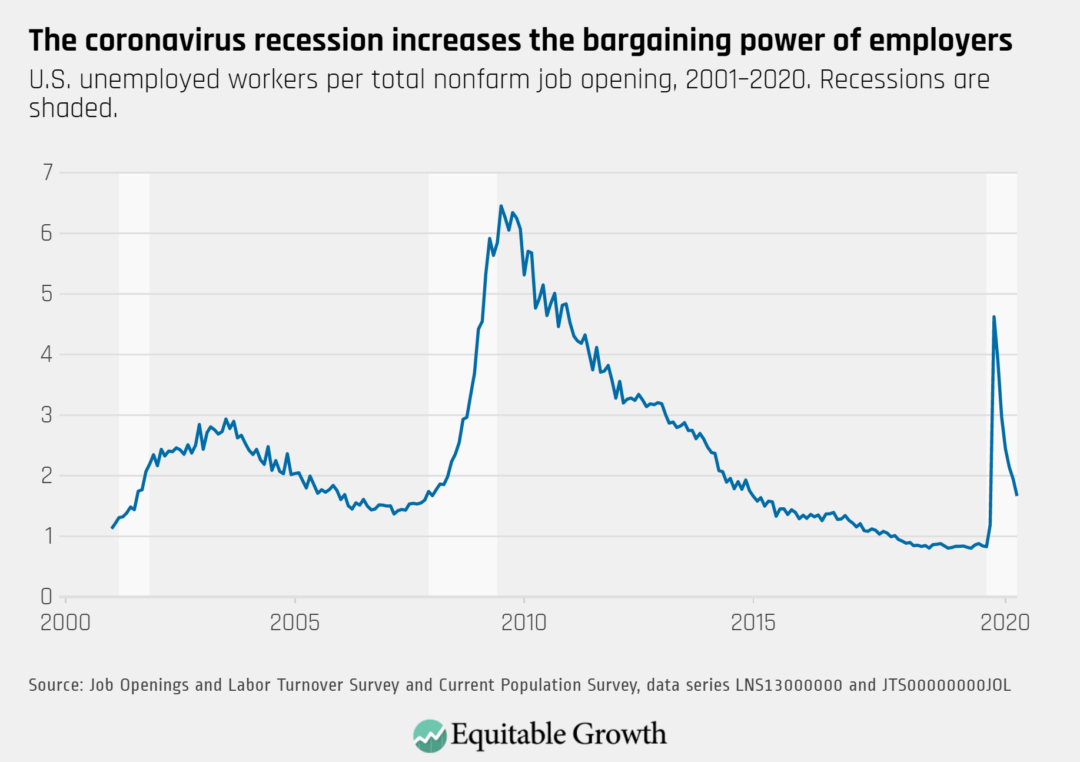
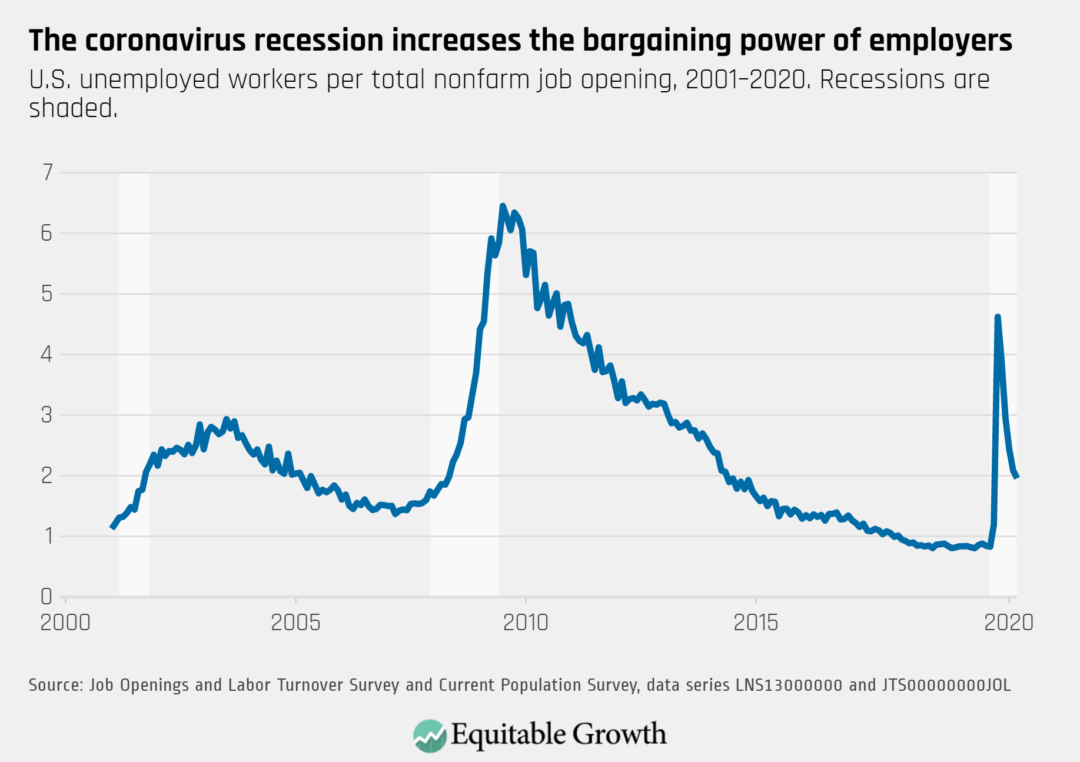
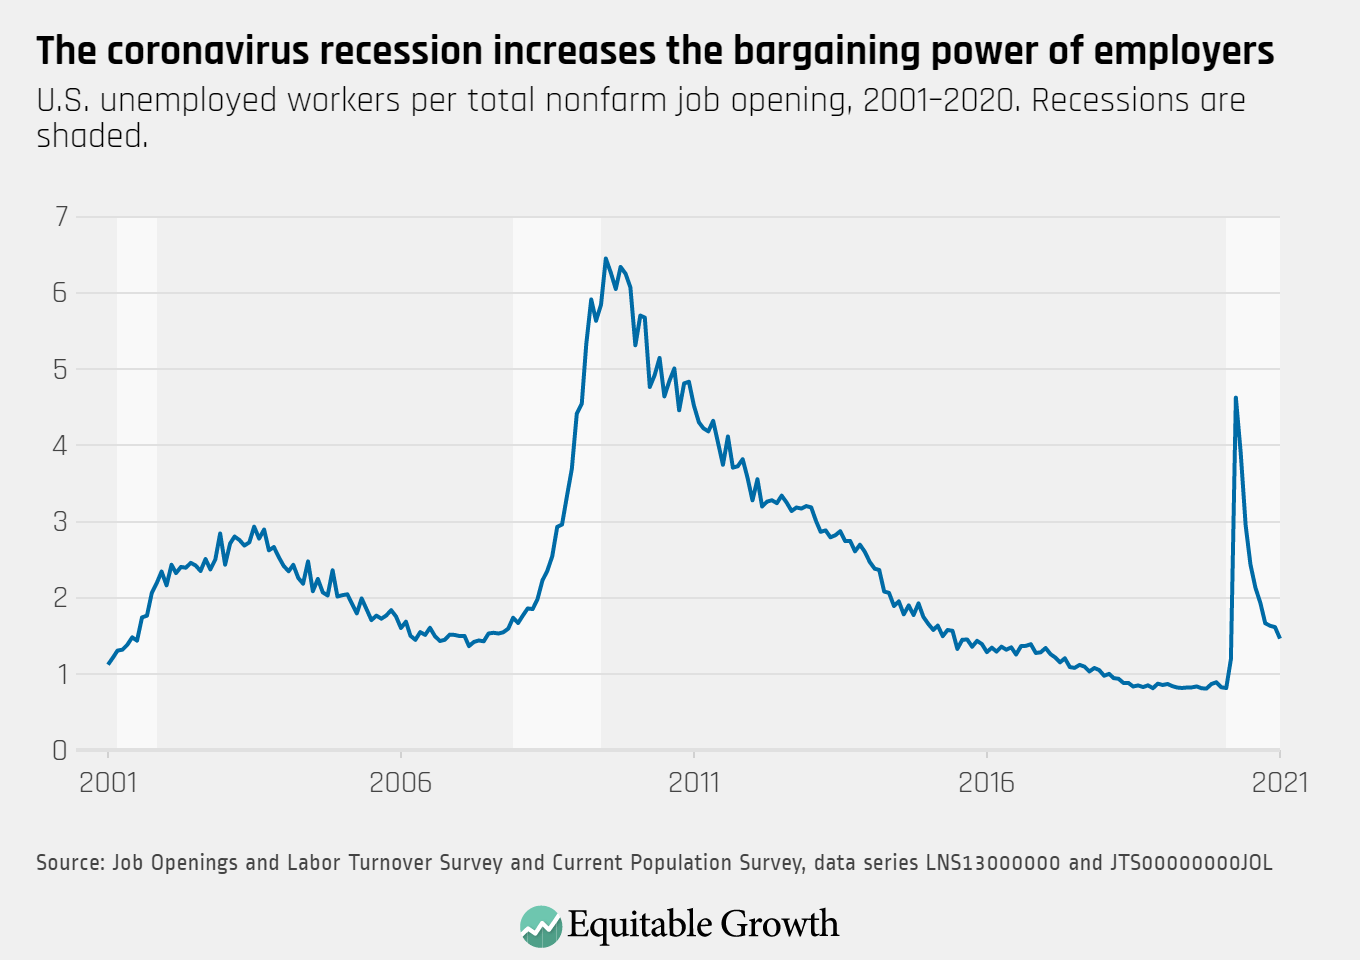
As unemployment declined and job openings increased, the ratio of unemployed-workers-to-job-opening went down slightly.

U.S. unemployed workers per total nonfarm job opening, 2001–2020

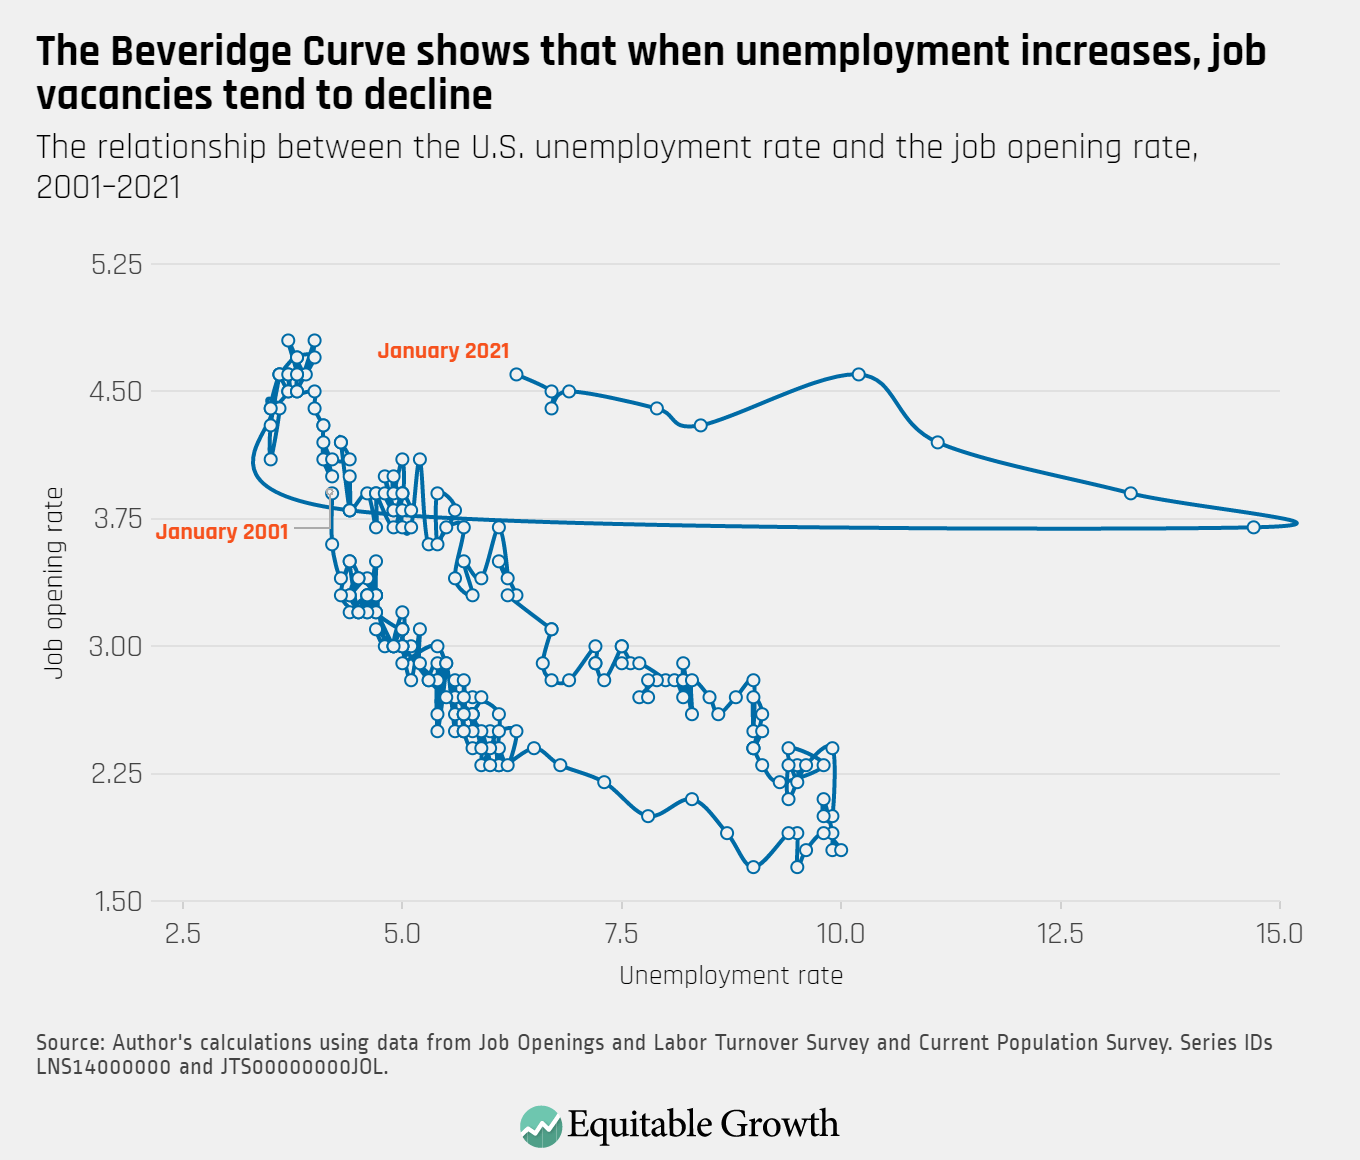
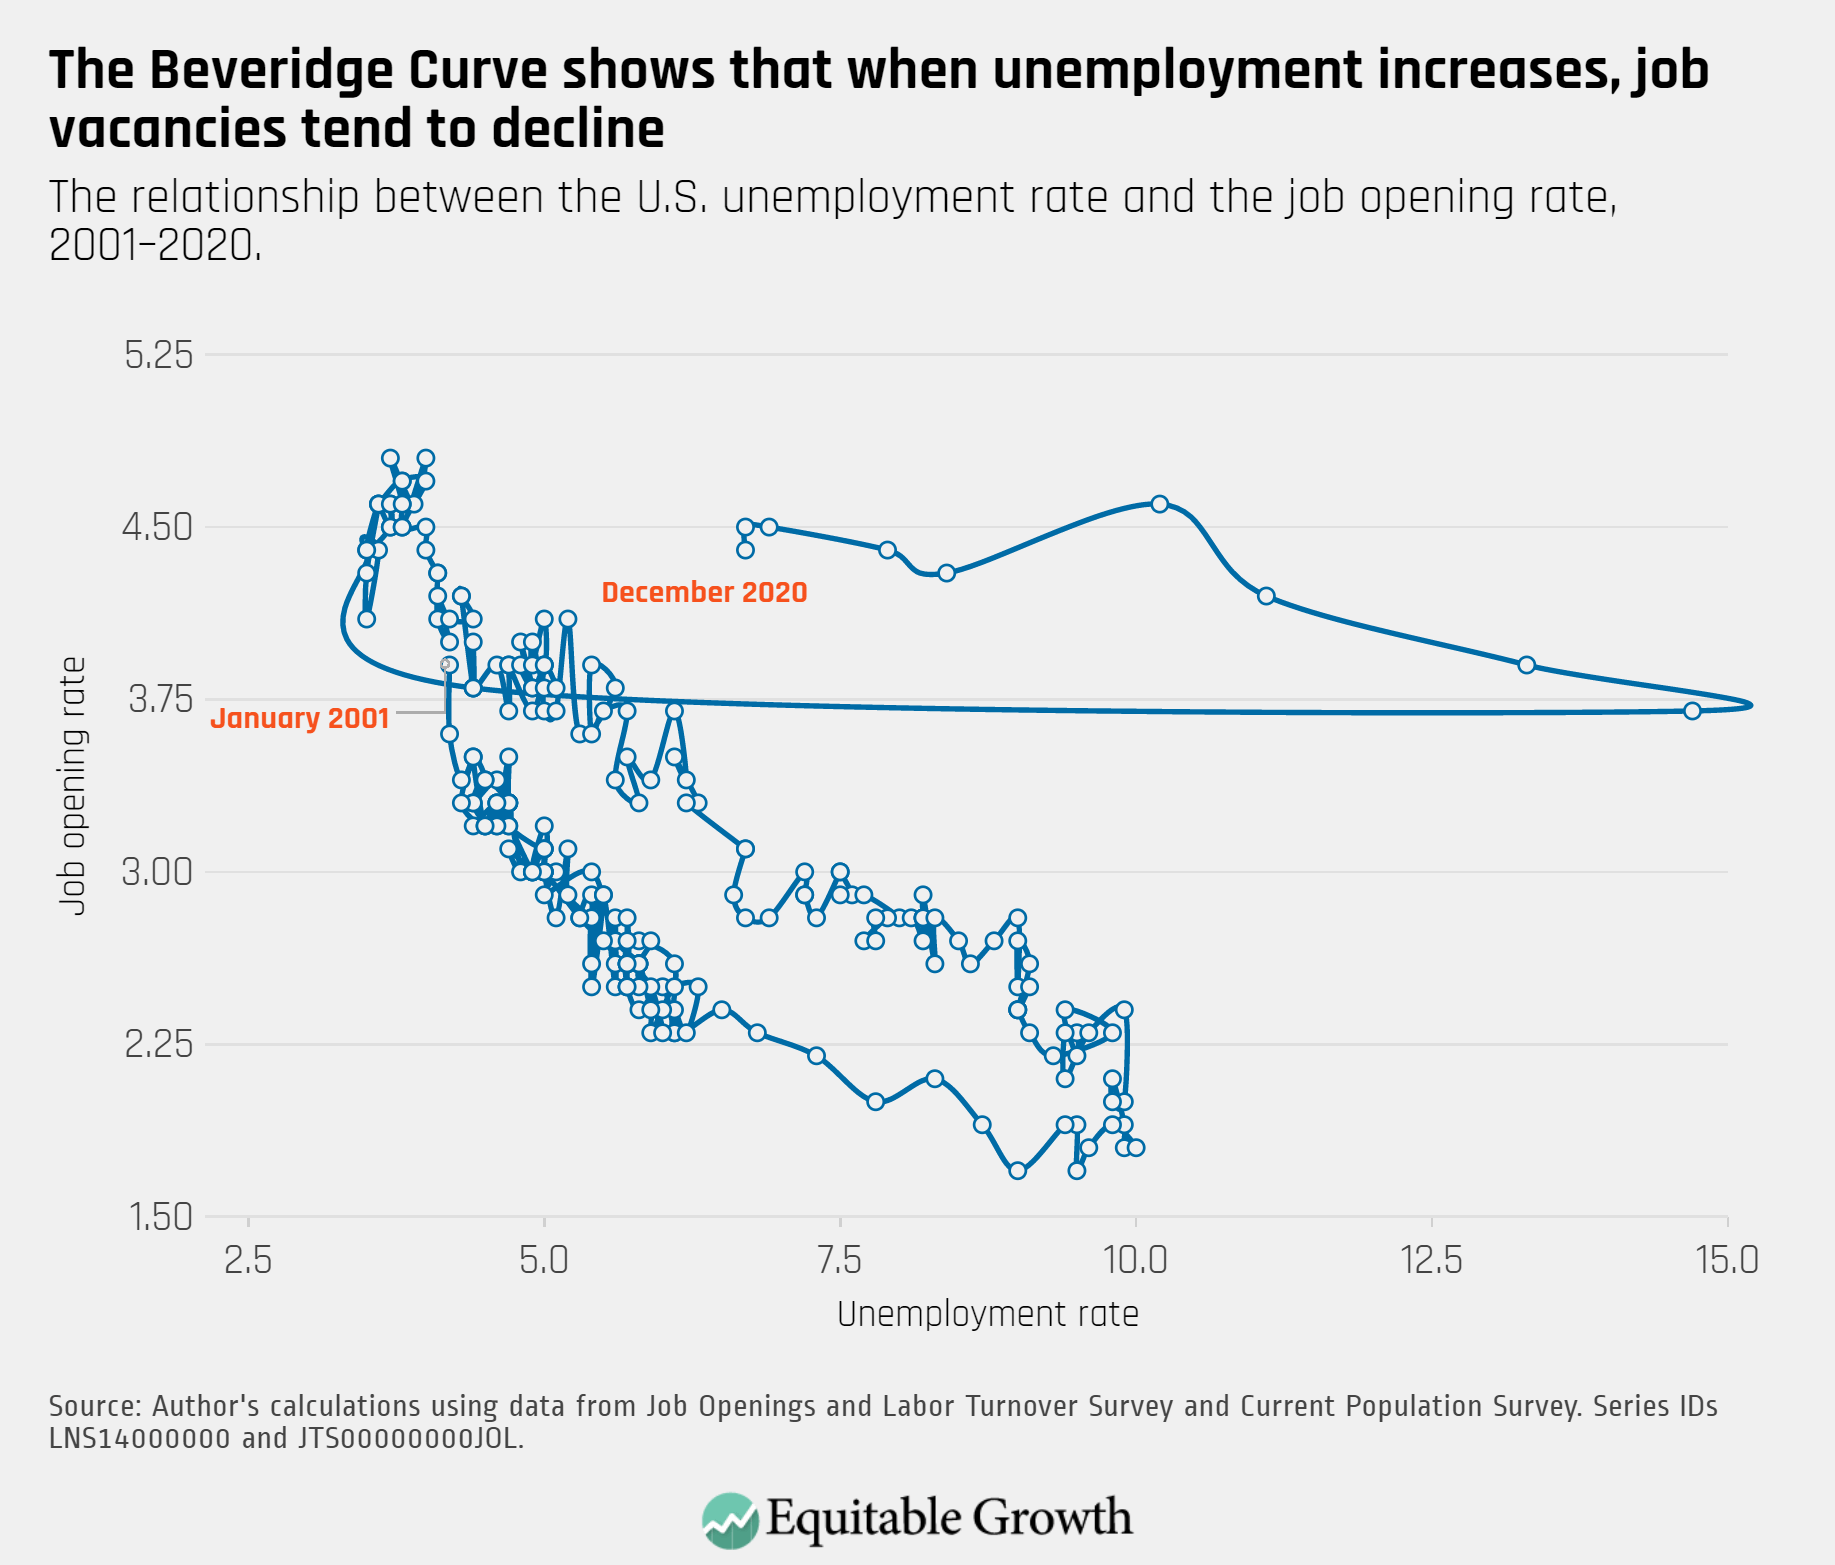
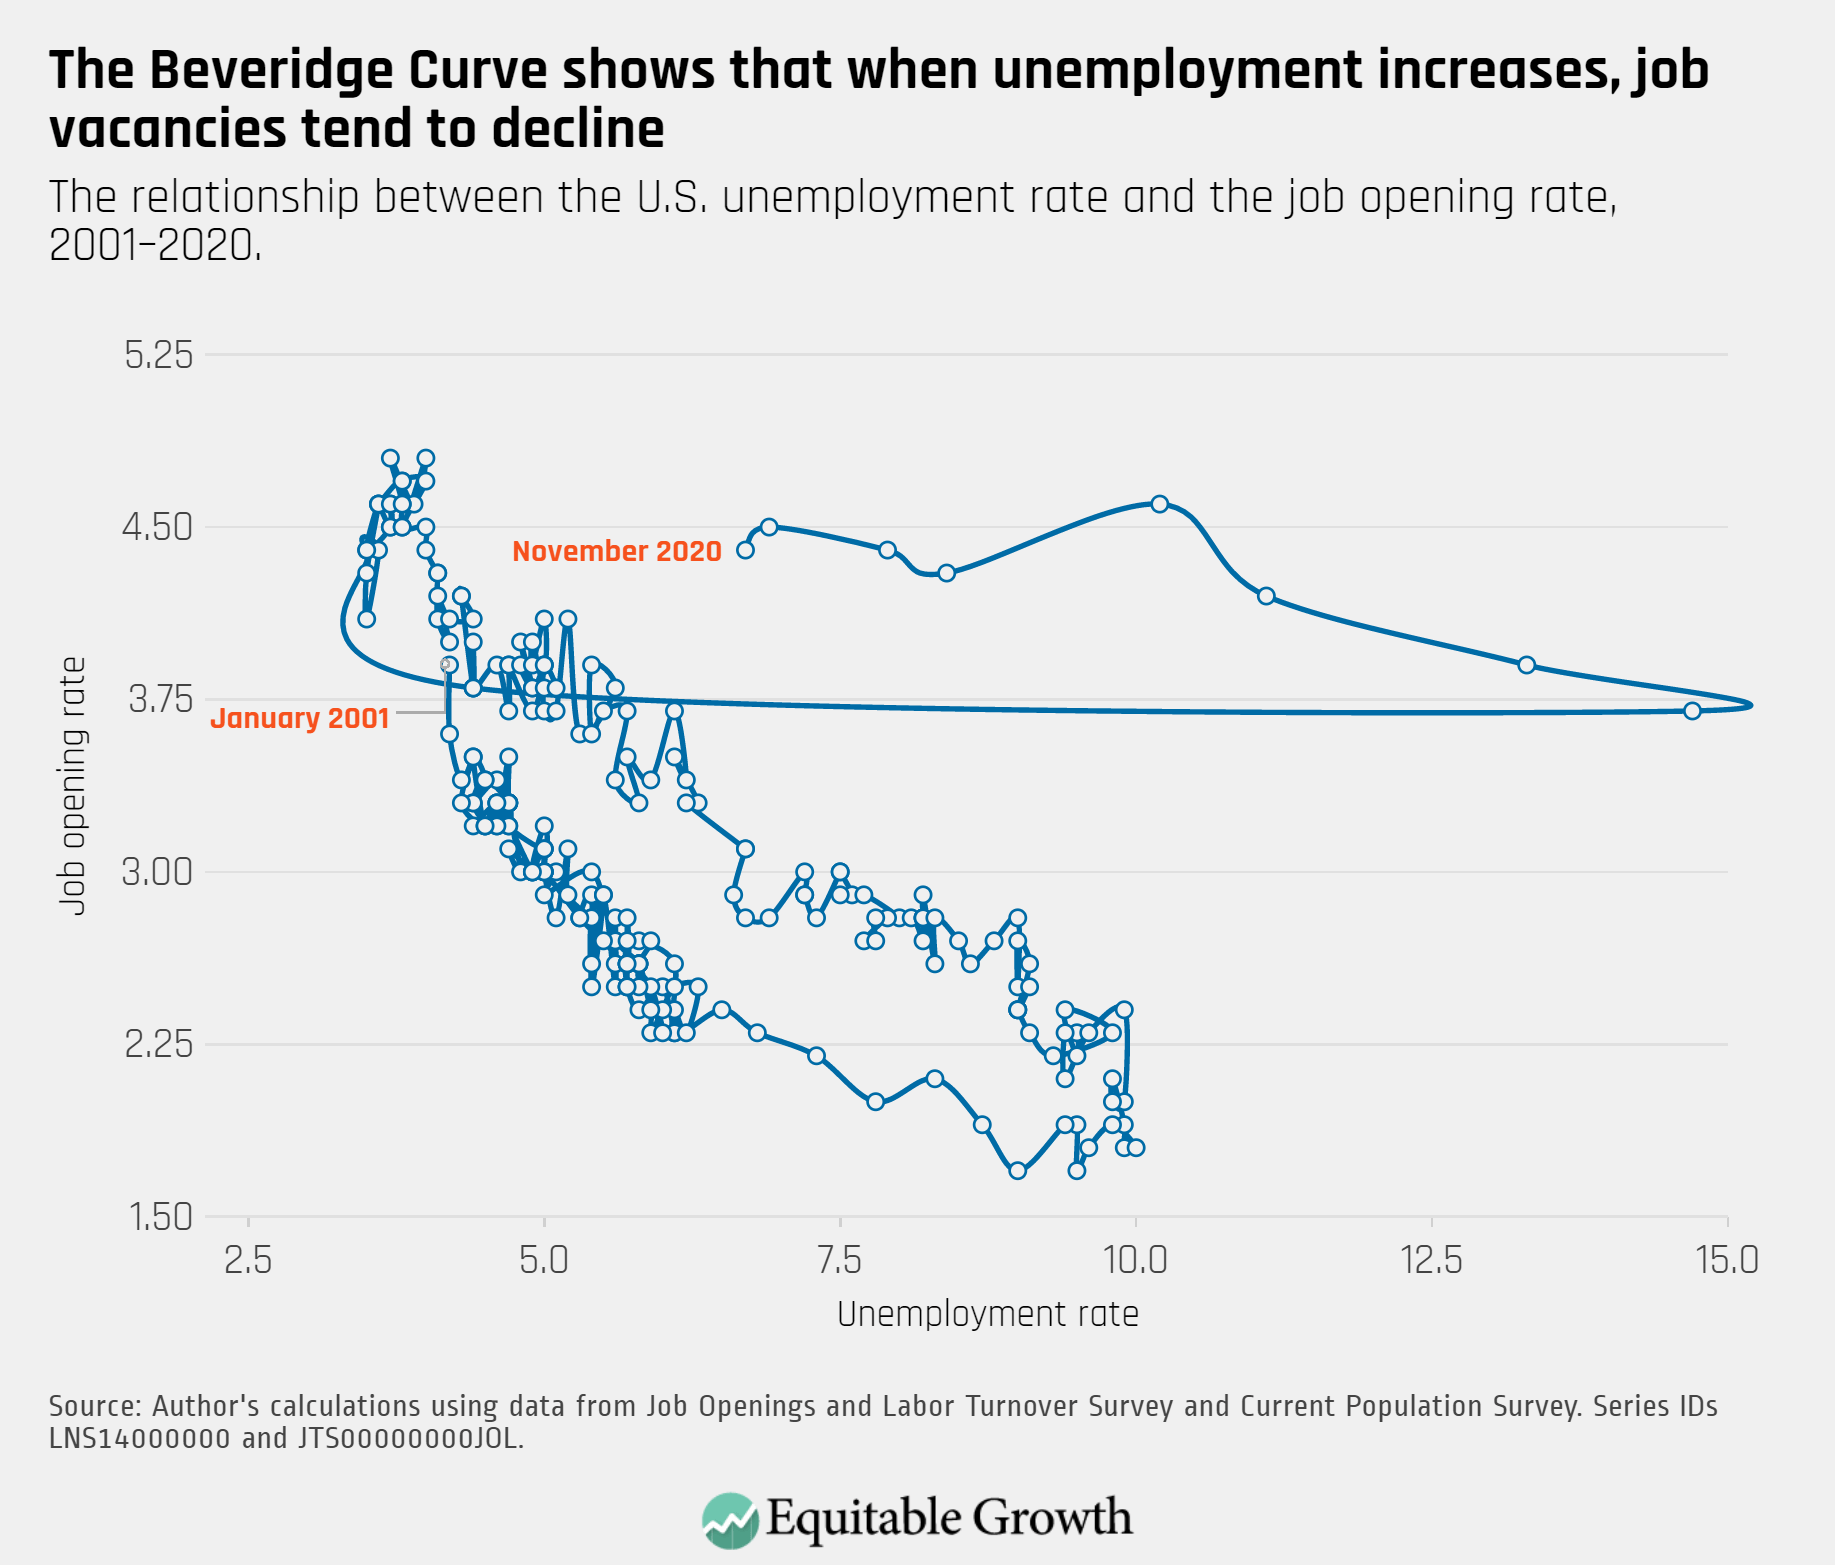
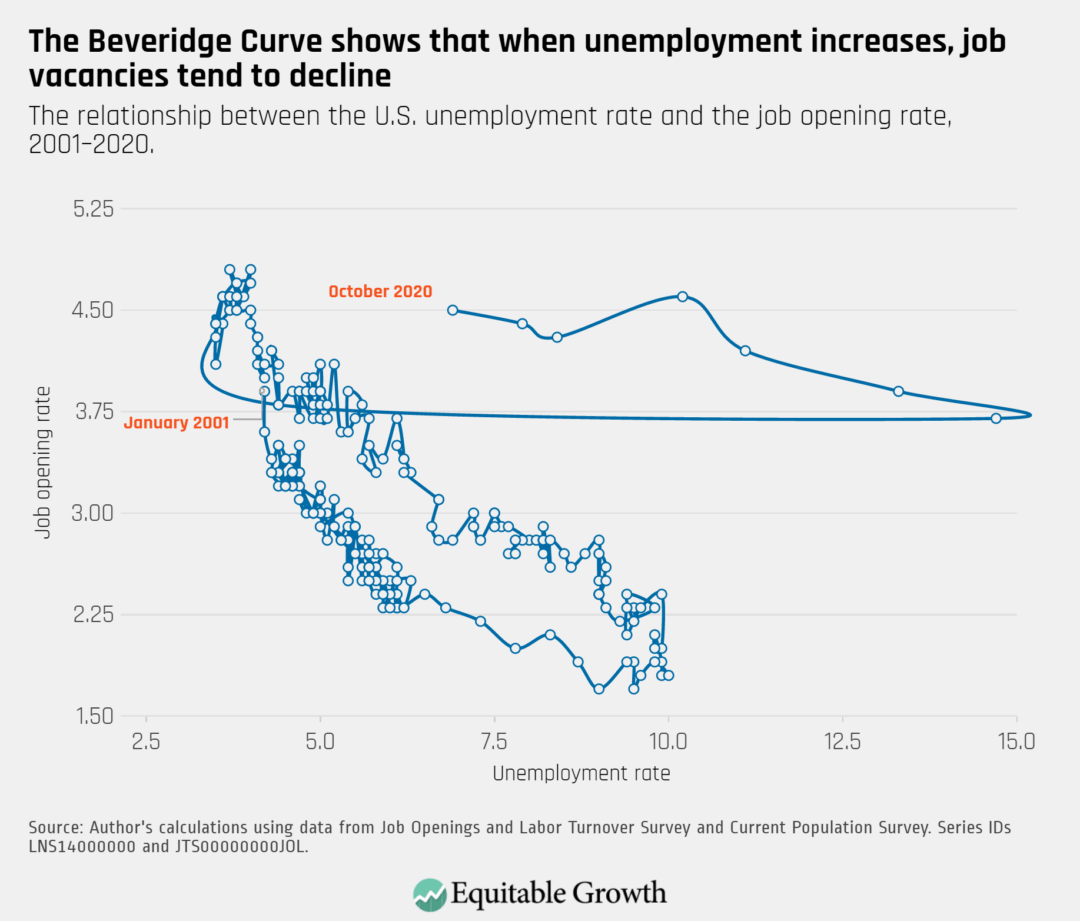
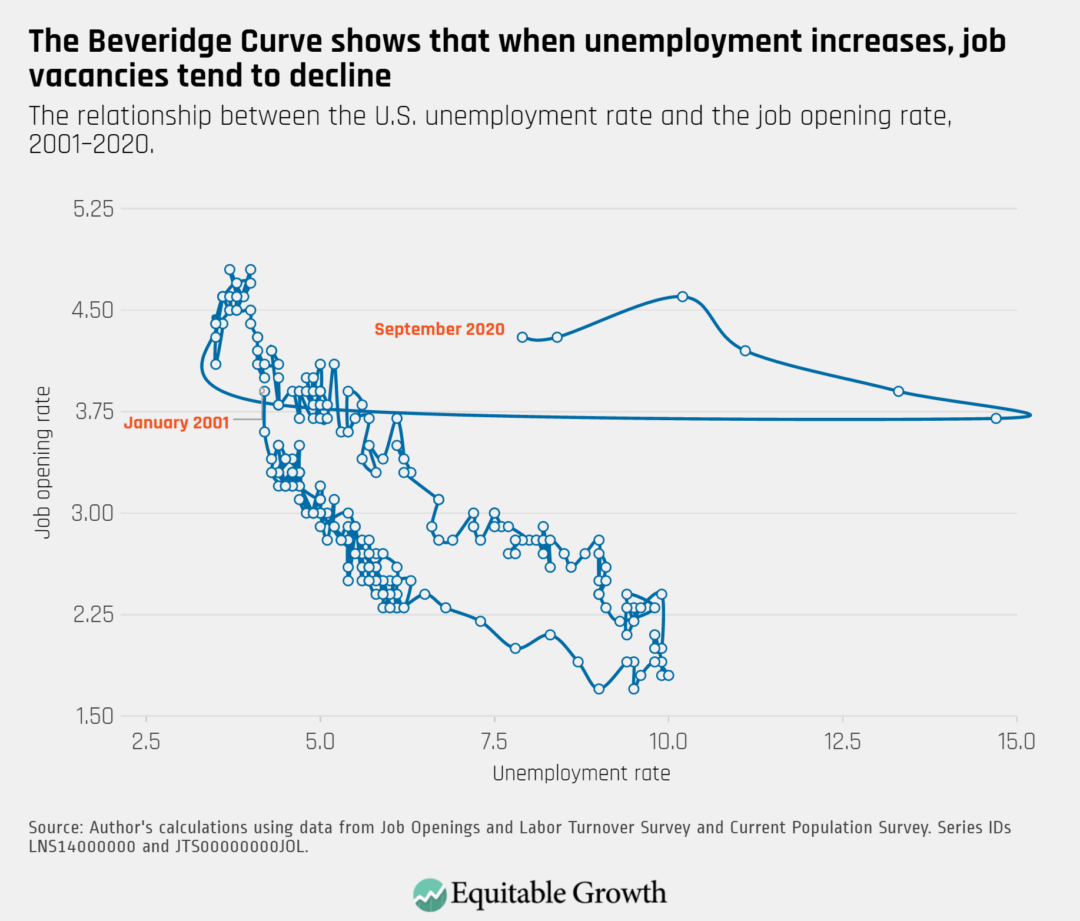
After being stalled for three months, the Beveridge Curve moved closer to typical territory as job openings recovered to their levels one year prior and the unemployment rate decreased partially from its pandemic high.

The relationship between the U.S. unemployment rate and the job opening rate, 2001–2021

Equitable Growth’s Jobs Day Graphs: February 2021 Report Edition

On March 5th, the U.S. Bureau of Labor Statistics released new data on the U.S. labor market during the month of February. Below are five graphs compiled by Equitable Growth staff highlighting important trends in the data.

The prime-age employment rate increased slightly from 76.4 percent to 76.5 percent in February, remaining well below pre-crisis levels as the recession continues.

Share of 25-54 year olds who are employed, 2000–2021

The unemployment rate remains highest for Black and Hispanic workers, while declining for Asian workers and showing little change for White workers.

U.S. unemployment rate by race, 2000–2021

Public-sector employment remains significantly below pre-crisis levels, and has seen little change since the beginning of the year. 

U.S. public- and private-sector employment indexed to average employment in 2007

The proportion of unemployed U.S. workers facing long-term unemployment continued to rise in February, as 55.6 percent of unemployed workers have now been out of work for more than 15 weeks.

Percent of all unemployed U.S. workers by length of time unemployed

The number of part-time workers who would prefer full-time work remained high in February, with involuntary part-time employment currently at 6.1 million jobs.

Percent increase in part-time employment compared to January 2018

JOLTS Day Graphs: December 2020 Edition

Every month the U.S. Bureau of Labor Statistics releases data on hiring, firing, and other labor market flows from the Job Openings and Labor Turnover Survey, better known as JOLTS. Today, the BLS released the latest data for December 2020. This report doesn’t get as much attention as the monthly Employment Situation Report, but it contains useful information about the state of the U.S. labor market. Below are a few key graphs using data from the report.

The quits rate increased slightly to 2.3 percent in December, with larger increases to the quits rate in leisure & hospitality and education & health services.

Quits as a percent of total U.S. employment, 2001–2020

Job openings were little changed but hires decreased in December, leading to a decline in the job vacancy yield.

U.S. total nonfarm hires per total nonfarm job openings, 2000–2020

With little change to unemployment and openings in December, the ratio of unemployed workers remained stable, although at an an elevated level compared to before the pandemic.

U.S. unemployed workers per total nonfarm job opening, 2001–2020

The Beveridge Curve has made little movement in the past three months, but remains in an atypical range during the pandemic-induced recession.

The relationship between the U.S. unemployment rate and the job opening rate, 2001–2020

Equitable Growth’s Jobs Day Graphs: January 2021 Report Edition

On February 5th, the U.S. Bureau of Labor Statistics released new data on the U.S. labor market during the month of January. Below are five graphs compiled by Equitable Growth staff highlighting important trends in the data.

The prime-age employment-to-population ratio increased only slightly to 76.4 percent in January, reflecting a slowdown of the pace of employment recovery since late fall

Share of 25-54 year olds who are employed 2000–2020

Unemployment declined for Black, Hispanic and White workers, but remains higher for Black and Hispanic workers, and unemployment increased for Asian American workers, reflecting persistent disparities in unemployment by race.

U.S. unemployment rate by race, 2000–2021

After a steep decline in December, the leisure and hospitality sector continued to decline in January. Employment growth in all industries remains below pre-pandemic levels as the recession continues.

Employment by major U.S. industry, indexed to average industry employment in 2007

As the recession continues, a higher proportion of unemployed U.S. workers face long-term unemployment.

Percent of all U.S. unemployed workers by length of time unemployed

Public-sector employment added a small amount of jobs in January, but remains significantly below pre-pandemic levels and risks further decline in absence of fiscal relief.

U.S. public- and private-sector employment indexed to average employment in 2007

JOLTS Day Graphs: November 2020 Edition

Every month the U.S. Bureau of Labor Statistics releases data on hiring, firing, and other labor market flows from the Job Openings and Labor Turnover Survey, better known as JOLTS. Today, the BLS released the latest data for November 2020. This report doesn’t get as much attention as the monthly Employment Situation Report, but it contains useful information about the state of the U.S. labor market. Below are a few key graphs using data from the report.

The quits rate has remained at 2.2 percent since September, but in November, it increased to 5.0 percent in accommodation and food services, where pay has declined and jobs are risky due to the pandemic.

Quits as a percent of total employment , 2001–2020

The vacancy yield was little changed in November as the hires rate stayed the same and the job openings rate declined slightly.

U.S. total nonfarm hires per total nonfarm job openings, 2001–2020

As the unemployment rate declined in November, the ratio of unemployed workers per job opening declined slightly to 1.64.

U.S. unemployed workers per total nonfarm job opening, 2001–2020

The Beveridge Curve moved little in November as the unemployment rate declined by 0.2 percentage points and the job openings rate declined by 0.1 percentage points.

The relationship between the U.S. unemployment rate and the job opening rate, 2001–2020

Equitable Growth’s Jobs Day Graphs: December 2020 Report Edition

On January 8th, the U.S. Bureau of Labor Statistics released new data on the U.S. labor market during the month of December. Below are five graphs compiled by Equitable Growth staff highlighting important trends in the data.

Despite an overall decrease in non-farm employment, the prime-age employment rate increased slightly from 76 percent to 76.3 percent.

Share of 25-54 year olds who are employed 2000–2020

The unemployment rate increased for Latinx workers in December as employment declined significantly in the leisure and hospitality industry where these workers are over-represented.

U.S. unemployment rate by race, 2000–2020

The unemployment rate was unchanged in December, but an increasing proportion of unemployed workers were on temporary layoff or new entrants to the labor market.

Percent of all unemployed workers in the United States by reason for unemployment, 2000–2020

As the pandemic surged in December, an increasing proportion of unemployed workers have been out of work for fewer than 5 weeks.

Percent of all unemployed workers by length of time unemployed

Public-sector employment continued to decline in December, led by decreases to non-education local government employment.

U.S. public- and private-sector employment indexed to average employment in 2007

JOLTS Day Graphs: October 2020 Edition

Every month the U.S. Bureau of Labor Statistics releases data on hiring, firing, and other labor market flows from the Job Openings and Labor Turnover Survey, better known as JOLTS. Today, the BLS released the latest data for October 2020. This report doesn’t get as much attention as the monthly Employment Situation Report, but it contains useful information about the state of the U.S. labor market. Below are a few key graphs using data from the report.

The quits rate was unchanged at 2.2% for October, nearly the same level as it was in October 2019, prior to the pandemic.

Quits as a percent of total U.S. employment , 2001–2020

With hires decreasing by 74,000 and job openings increasing by 160,000, the vacancy yield decreased slightly in October.

U.S. total nonfarm hires per total nonfarm job openings, 2001–2020

The ratio of unemployed workers to job openings continued to decrease as the unemployment rate declined and the openings rate increased slightly. But, at the same time, 4.2 million workers left the labor force in October.

U.S. unemployed workers per total nonfarm job opening, 2001–2020

The Beveridge Curve continued to move toward typical territory, but still reflects a distorted relationship between job openings and unemployment in the Coronavirus Recession.

The relationship between the U.S. unemployment rate and the job opening rate, 2001–2020

Equitable Growth’s Jobs Day Graphs: November 2020 Report Edition

On December 4, the U.S. Bureau of Labor Statistics released new data on the U.S. labor market during the month of November. Below are five graphs compiled by Equitable Growth staff highlighting important trends in the data.

Prime-age employment held steady at 76 percent showing no improvement in November, after a steep decline in the spring and only a partial recovery in the summer and fall.

Share of 25-54 year olds who are employed 2000–2020

The unemployment rate for Black workers remained in double digits at 10.3 percent, while the unemployment rate for White workers declined slightly to 5.9 percent due to workers dropping out of the labor force.

U.S. unemployment rate by race, 2000–2020

Part-time workers who would prefer full-time work saw no improvement in November as involuntary part-time employment remains 2.3 million above the February level.

Percent increase in part-time employment compared to January 2018

An increasing proportion of unemployed workers are permanent job-losers with those on temporary layoff, voluntarily leaving their job, and reentering the labor market all declining.

Percent of all unemployed workers in the United States by reason for unemployment, 2000–2020

Employment in government dropped for a third consecutive month, decreasing by nearly 100,000 jobs in November.

U.S. public- and private-sector employment indexed to average employment in 2007

JOLTS Day Graphs: September 2020 Edition

Every month the U.S. Bureau of Labor Statistics releases data on hiring, firing, and other labor market flows from the Job Openings and Labor Turnover Survey, better known as JOLTS. Today, the BLS released the latest data for September 2020. This report doesn’t get as much attention as the monthly Employment Situation Report, but it contains useful information about the state of the U.S. labor market. Below are a few key graphs using data from the report.

The quits rate increased slightly to 2.1 percent in September, signaling stalled prospects for workers. 

Quits as a percent of total U.S. employment, 2001-2020

The vacancy yield was essentially unchanged in September, as the rate of job openings stayed at 4.3 percent and the rate of hires remained at 4.1 percent. Hires decreased significantly in the federal government due to a drop in demand for 2020 Census workers, but hires also fell in retail and educational services.

U.S. total nonfarm hires per total nonfarm job openings, 2001–2021

Since job openings remained unchanged and unemployment declined, the ratio of unemployed-worker-per-opening dropped slightly to 1.95.

U.S. unemployed workers per total nonfarm job opening, 2001–2020.

The Beveridge Curve continues to move closer to typical territory in September as unemployment declined, but job openings did not increase in the tenuous recovery.

The relationship between the U.S. unemployment rate and the job opening rate, 2001–2020

Equitable Growth’s Jobs Day Graphs: October 2020 Report Edition

On November 6, the U.S. Bureau of Labor Statistics released new data on the U.S. labor market during the month of October. Below are five graphs compiled by Equitable Growth staff highlighting important trends in the data.

While the employment rate of prime-age workers continued to recover in October, reaching 76 percent compared to the pre-pandemic height of 80.5 percent, the pace of its improvement has decreased since the summer.

Share of 25-54 year olds who are employed 2000–2020

The unemployment rate fell to 6.9 percent for all workers, but was significantly higher for Black workers at 10.8 percent. The uncontrolled pandemic, occupational segregation, and labor market discrimination limit the ability of Black unemployment rates to recover and converge with other demographic groups.

U.S. unemployment rate by race, 2000-2020

Employment growth continues to improve across the private sector, but layoffs from the end of the 2020 Census and job losses in local and state government education offset employment recovery.

Employment by major industry, indexed to average industry employment in 2007

Unemployment rates continue to be significantly higher for workers with less than a college degree, who are less likely to be able to telework.

Unemployment rate by U.S. educational attainment, 2000–2020

Public-sector employment declined in October, due to 147,000 Census layoffs and 159,000 job losses in education, disproportionately impacting women workers who are overrepresented in the education sector.

U.S. public- and private-sector employment indexed to average employment in 2007