Equitable Growth’s Jobs Day Graphs: January 2021 Report Edition
On February 5th, the U.S. Bureau of Labor Statistics released new data on the U.S. labor market during the month of January. Below are five graphs compiled by Equitable Growth staff highlighting important trends in the data.
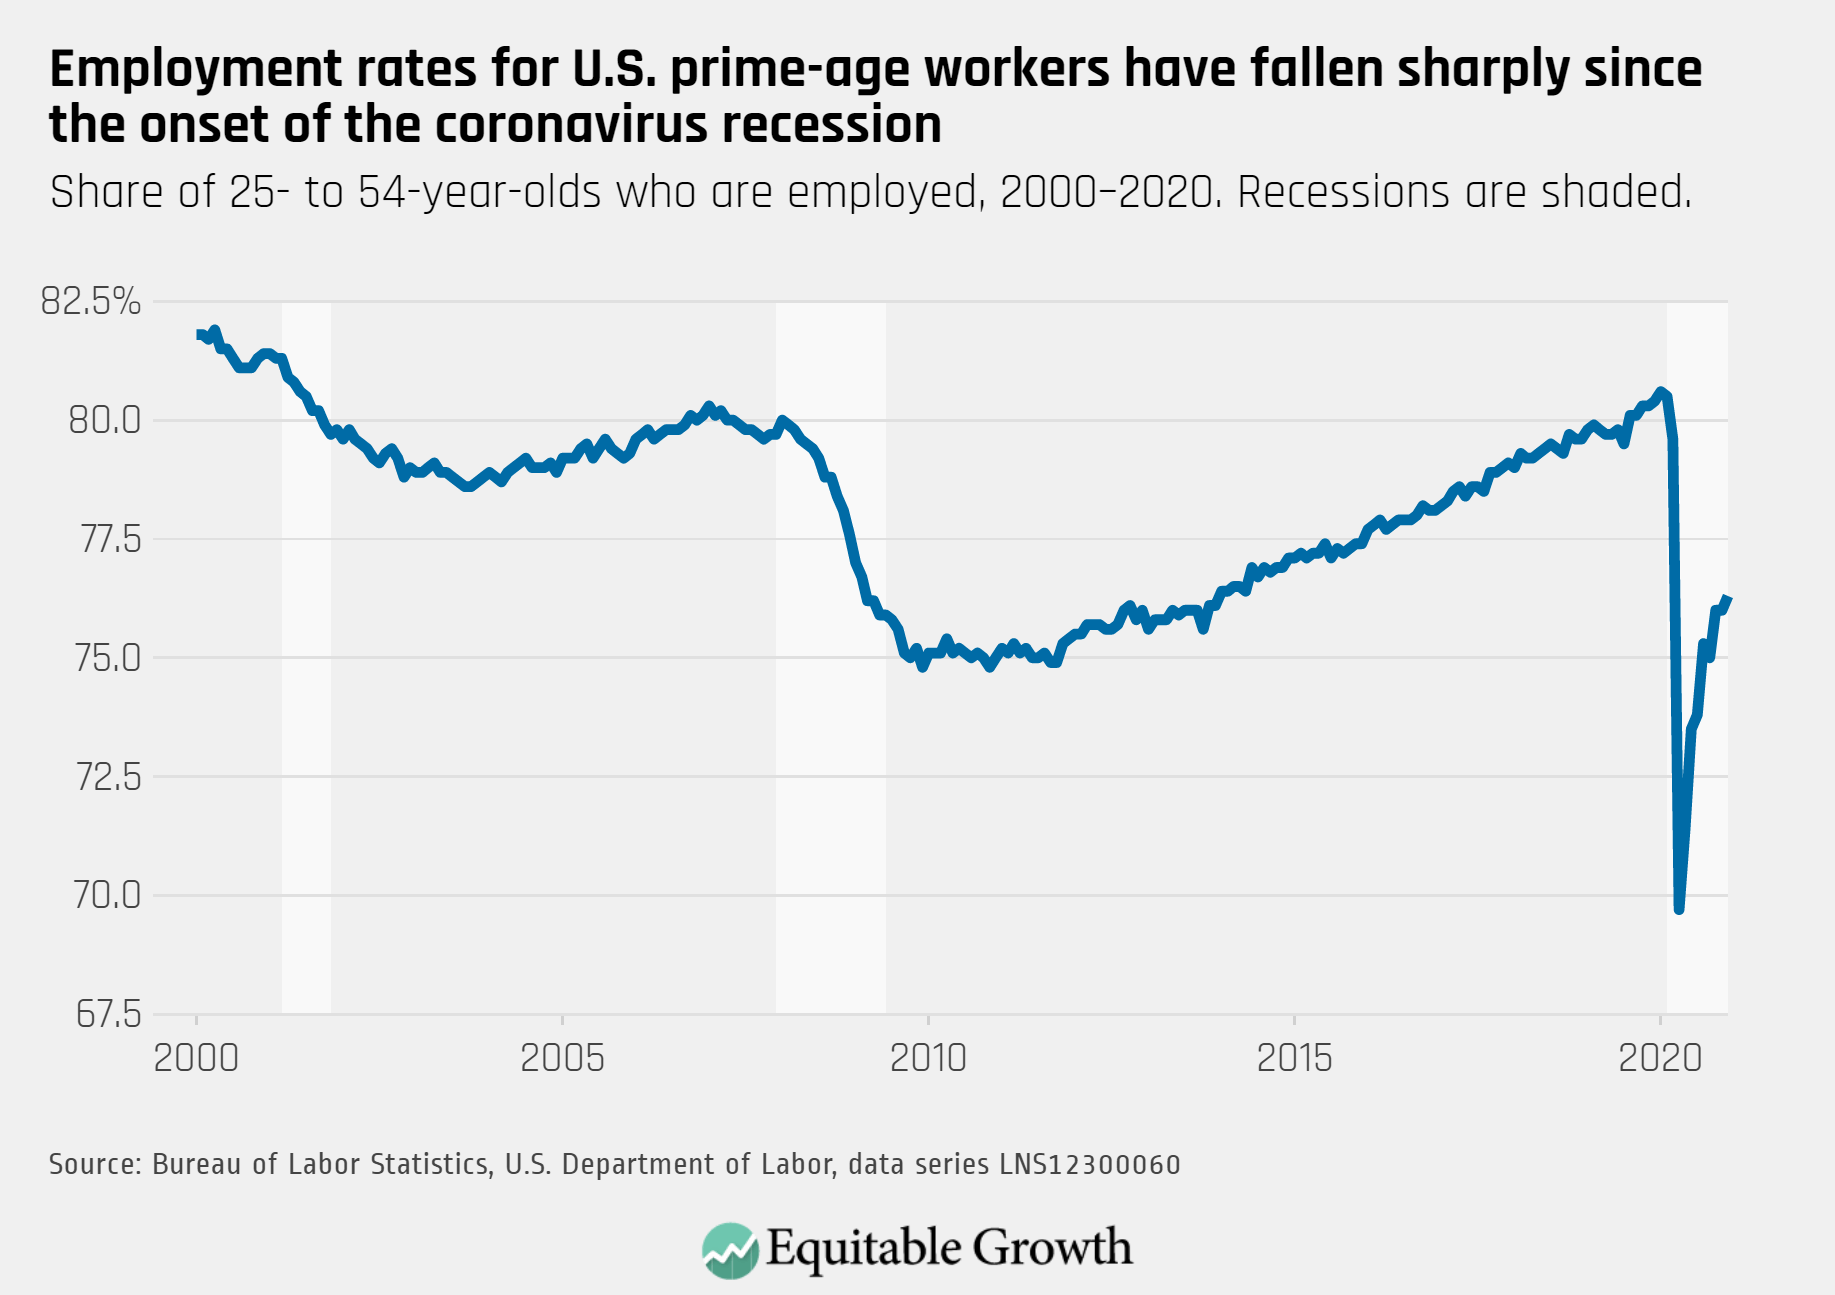
The prime-age employment-to-population ratio increased only slightly to 76.4 percent in January, reflecting a slowdown of the pace of employment recovery since late fall
Unemployment declined for Black, Hispanic and White workers, but remains higher for Black and Hispanic workers, and unemployment increased for Asian American workers, reflecting persistent disparities in unemployment by race.

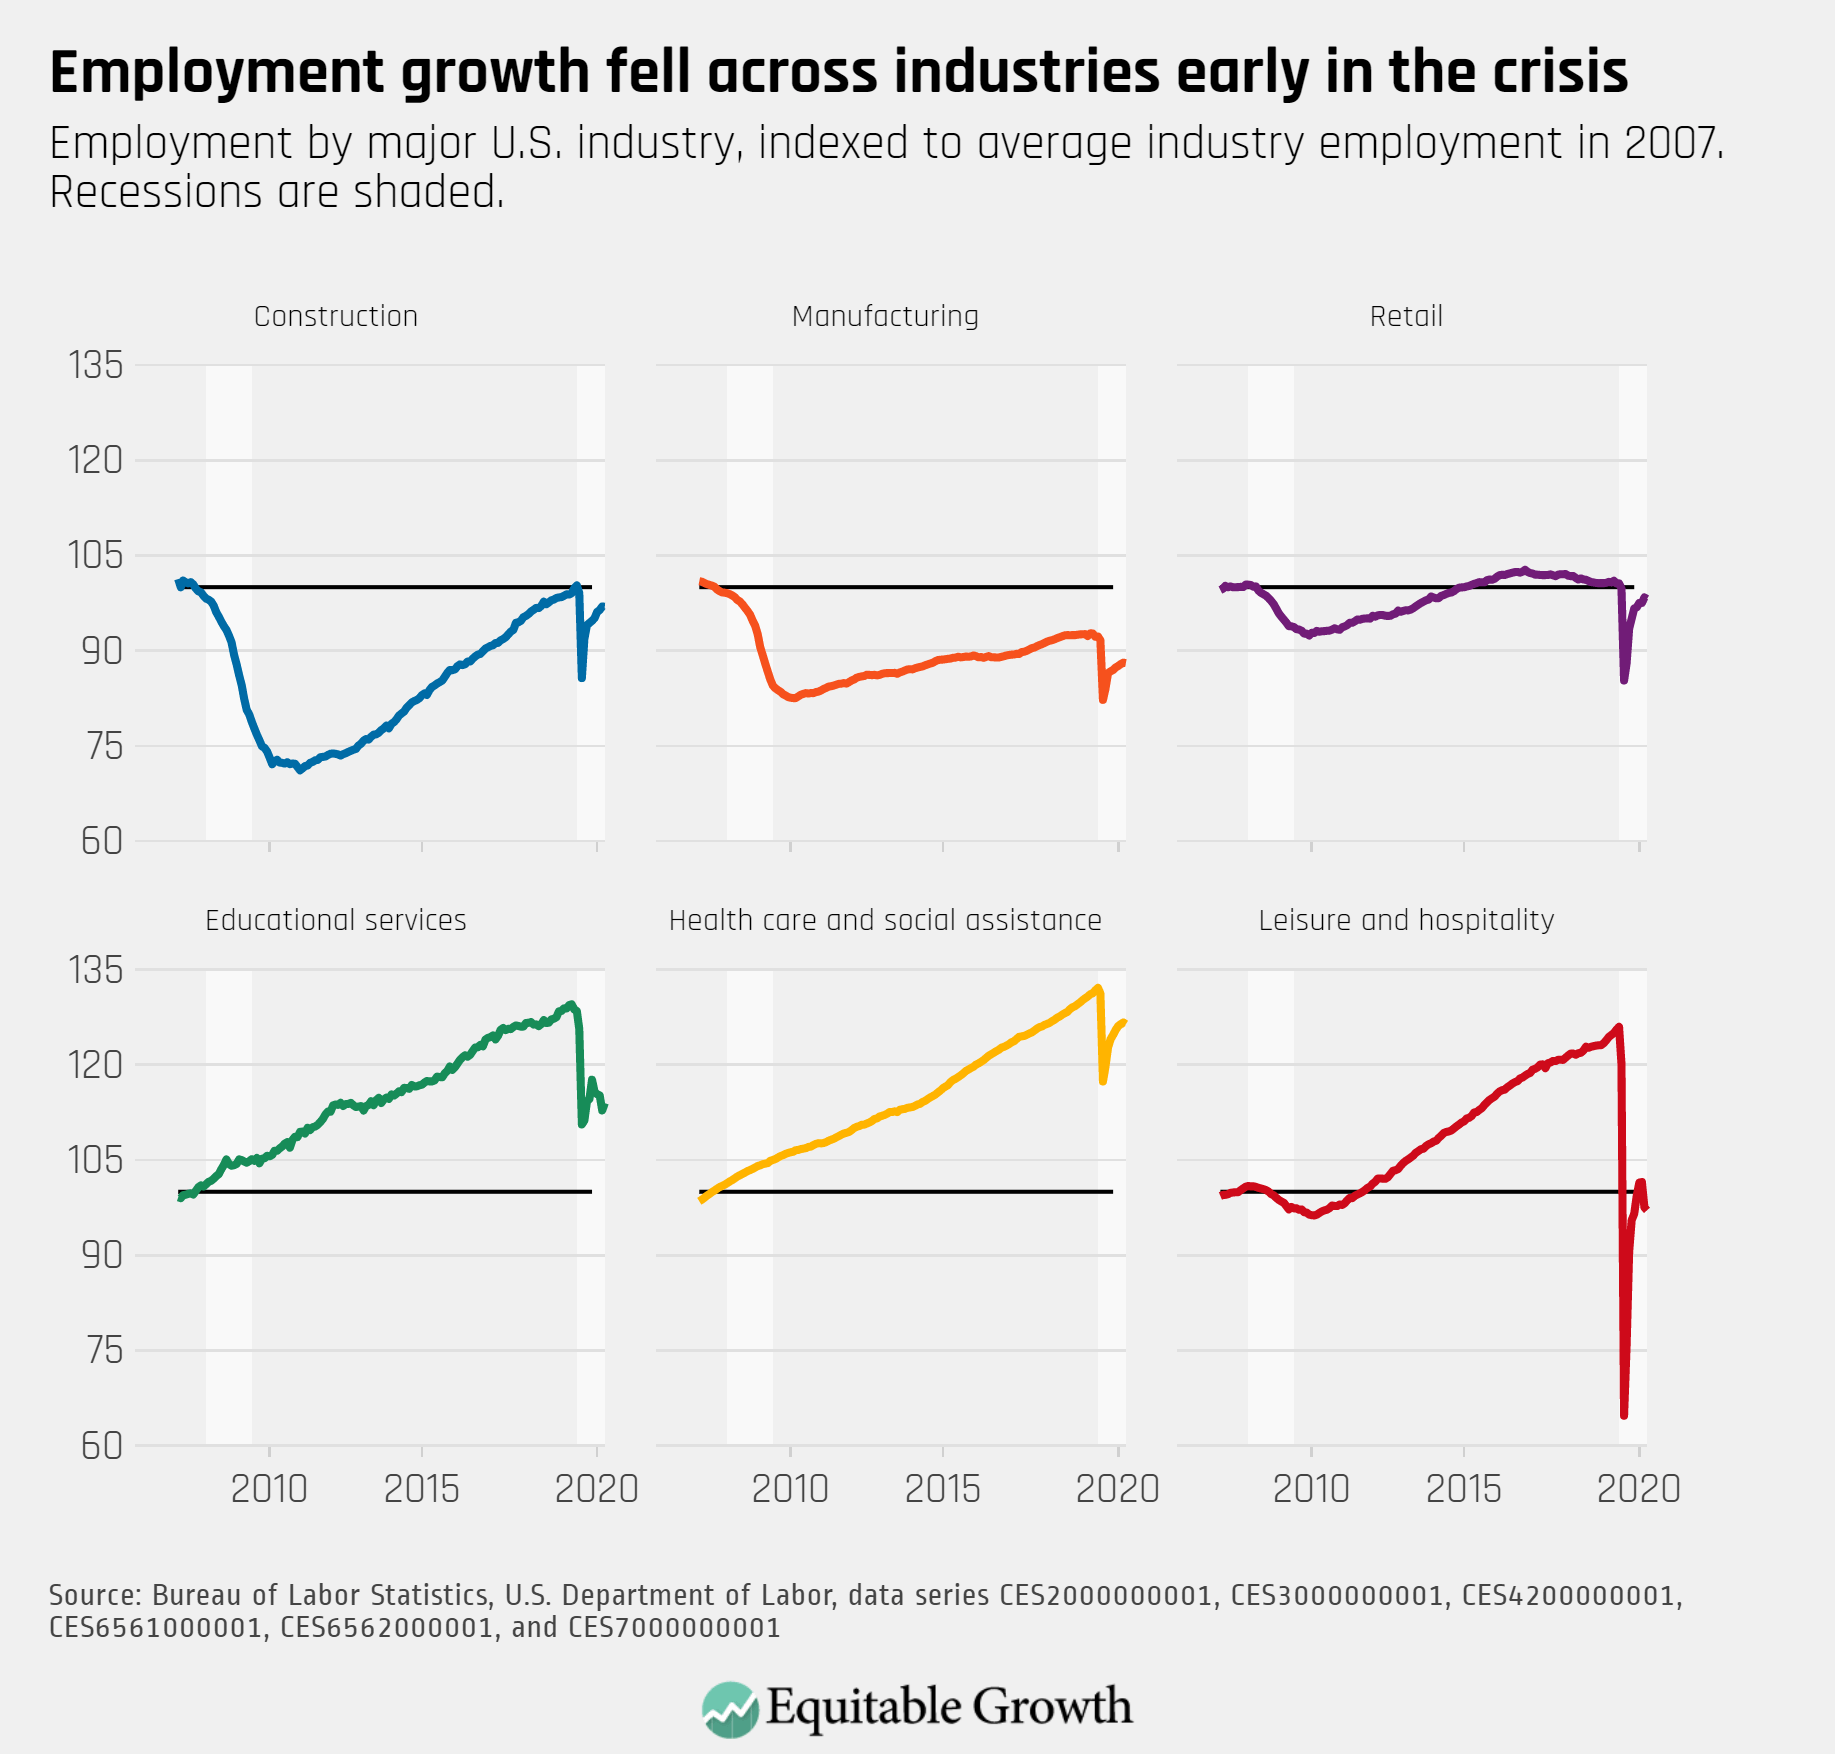
After a steep decline in December, the leisure and hospitality sector continued to decline in January. Employment growth in all industries remains below pre-pandemic levels as the recession continues.
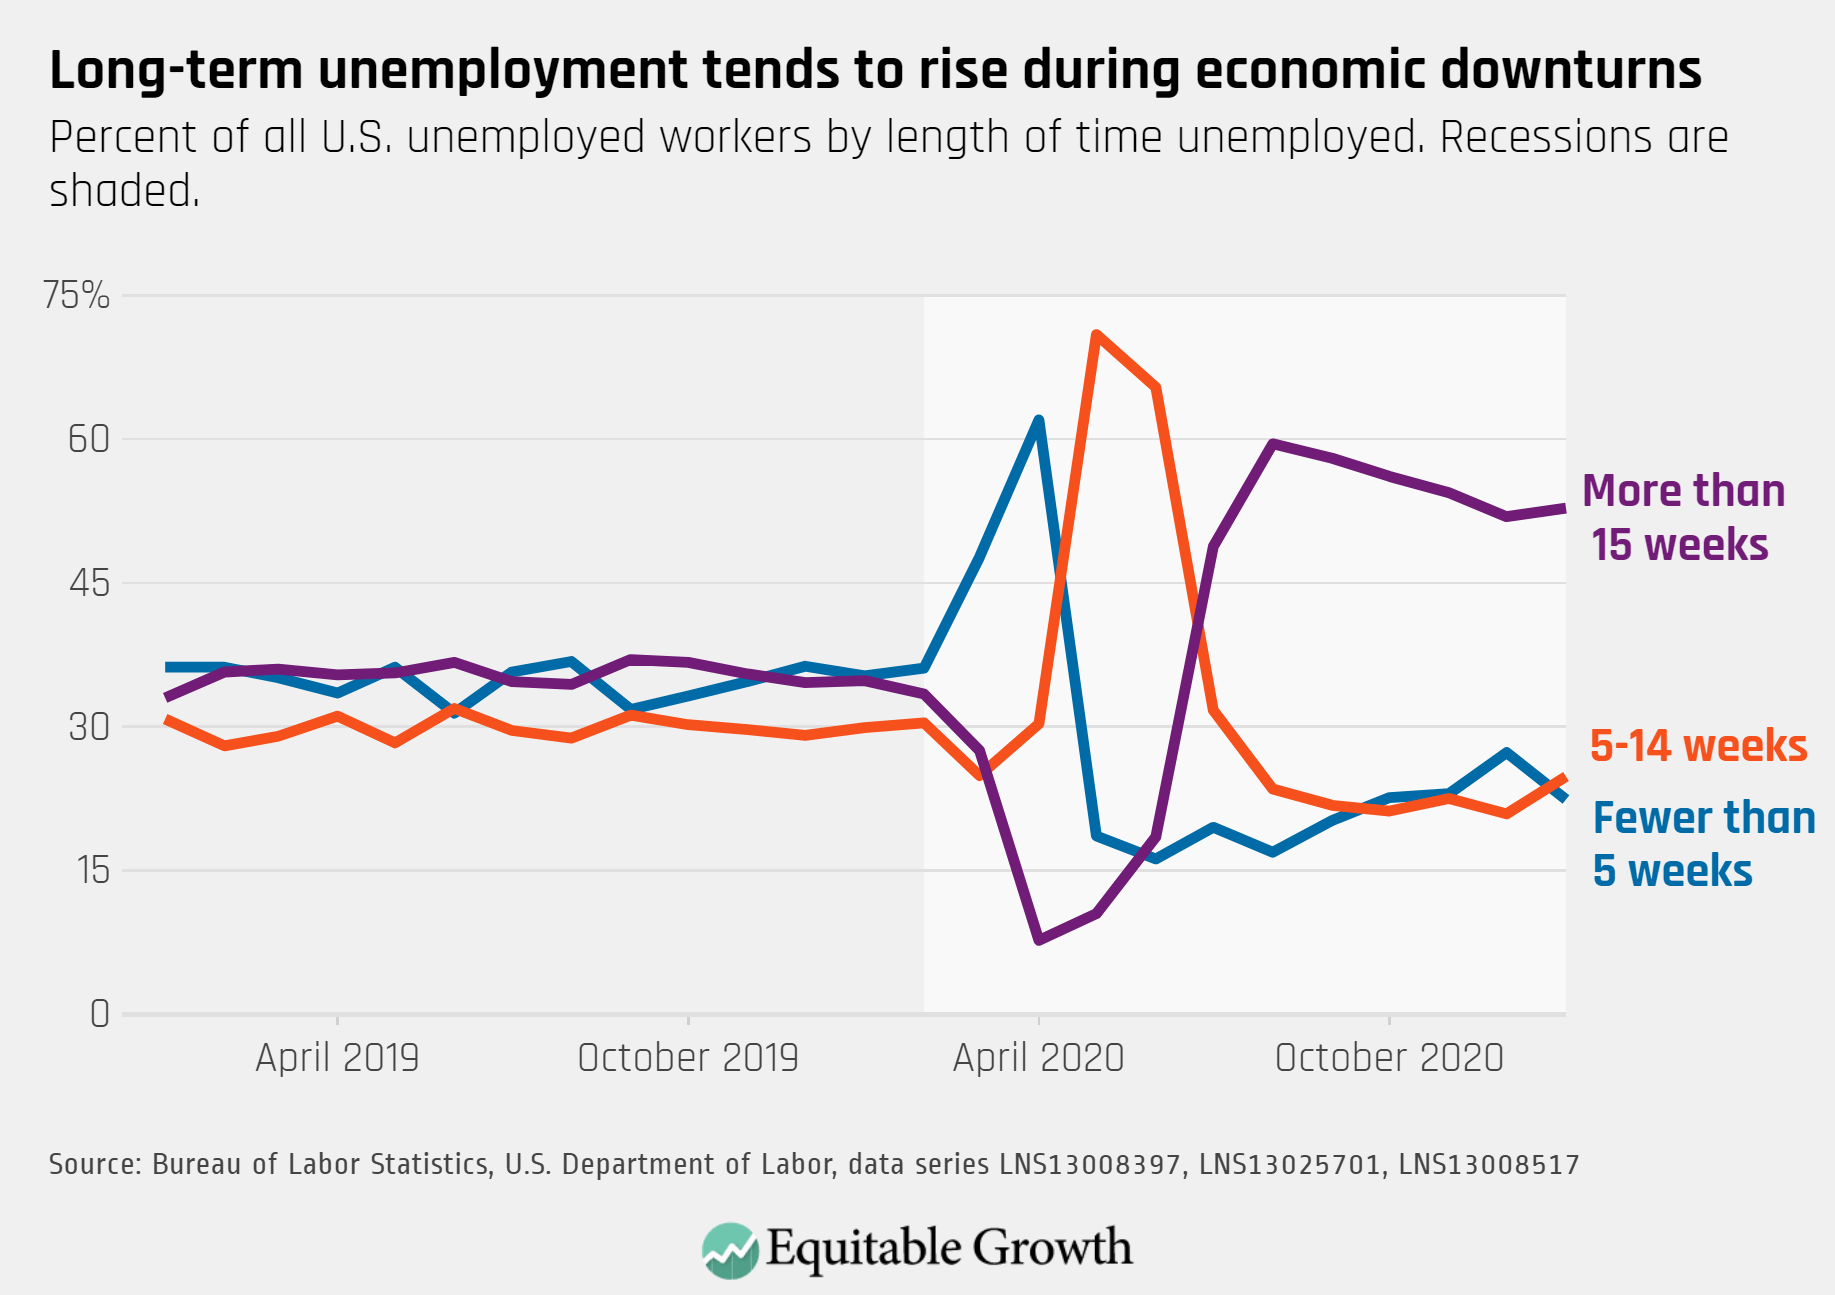
As the recession continues, a higher proportion of unemployed U.S. workers face long-term unemployment.
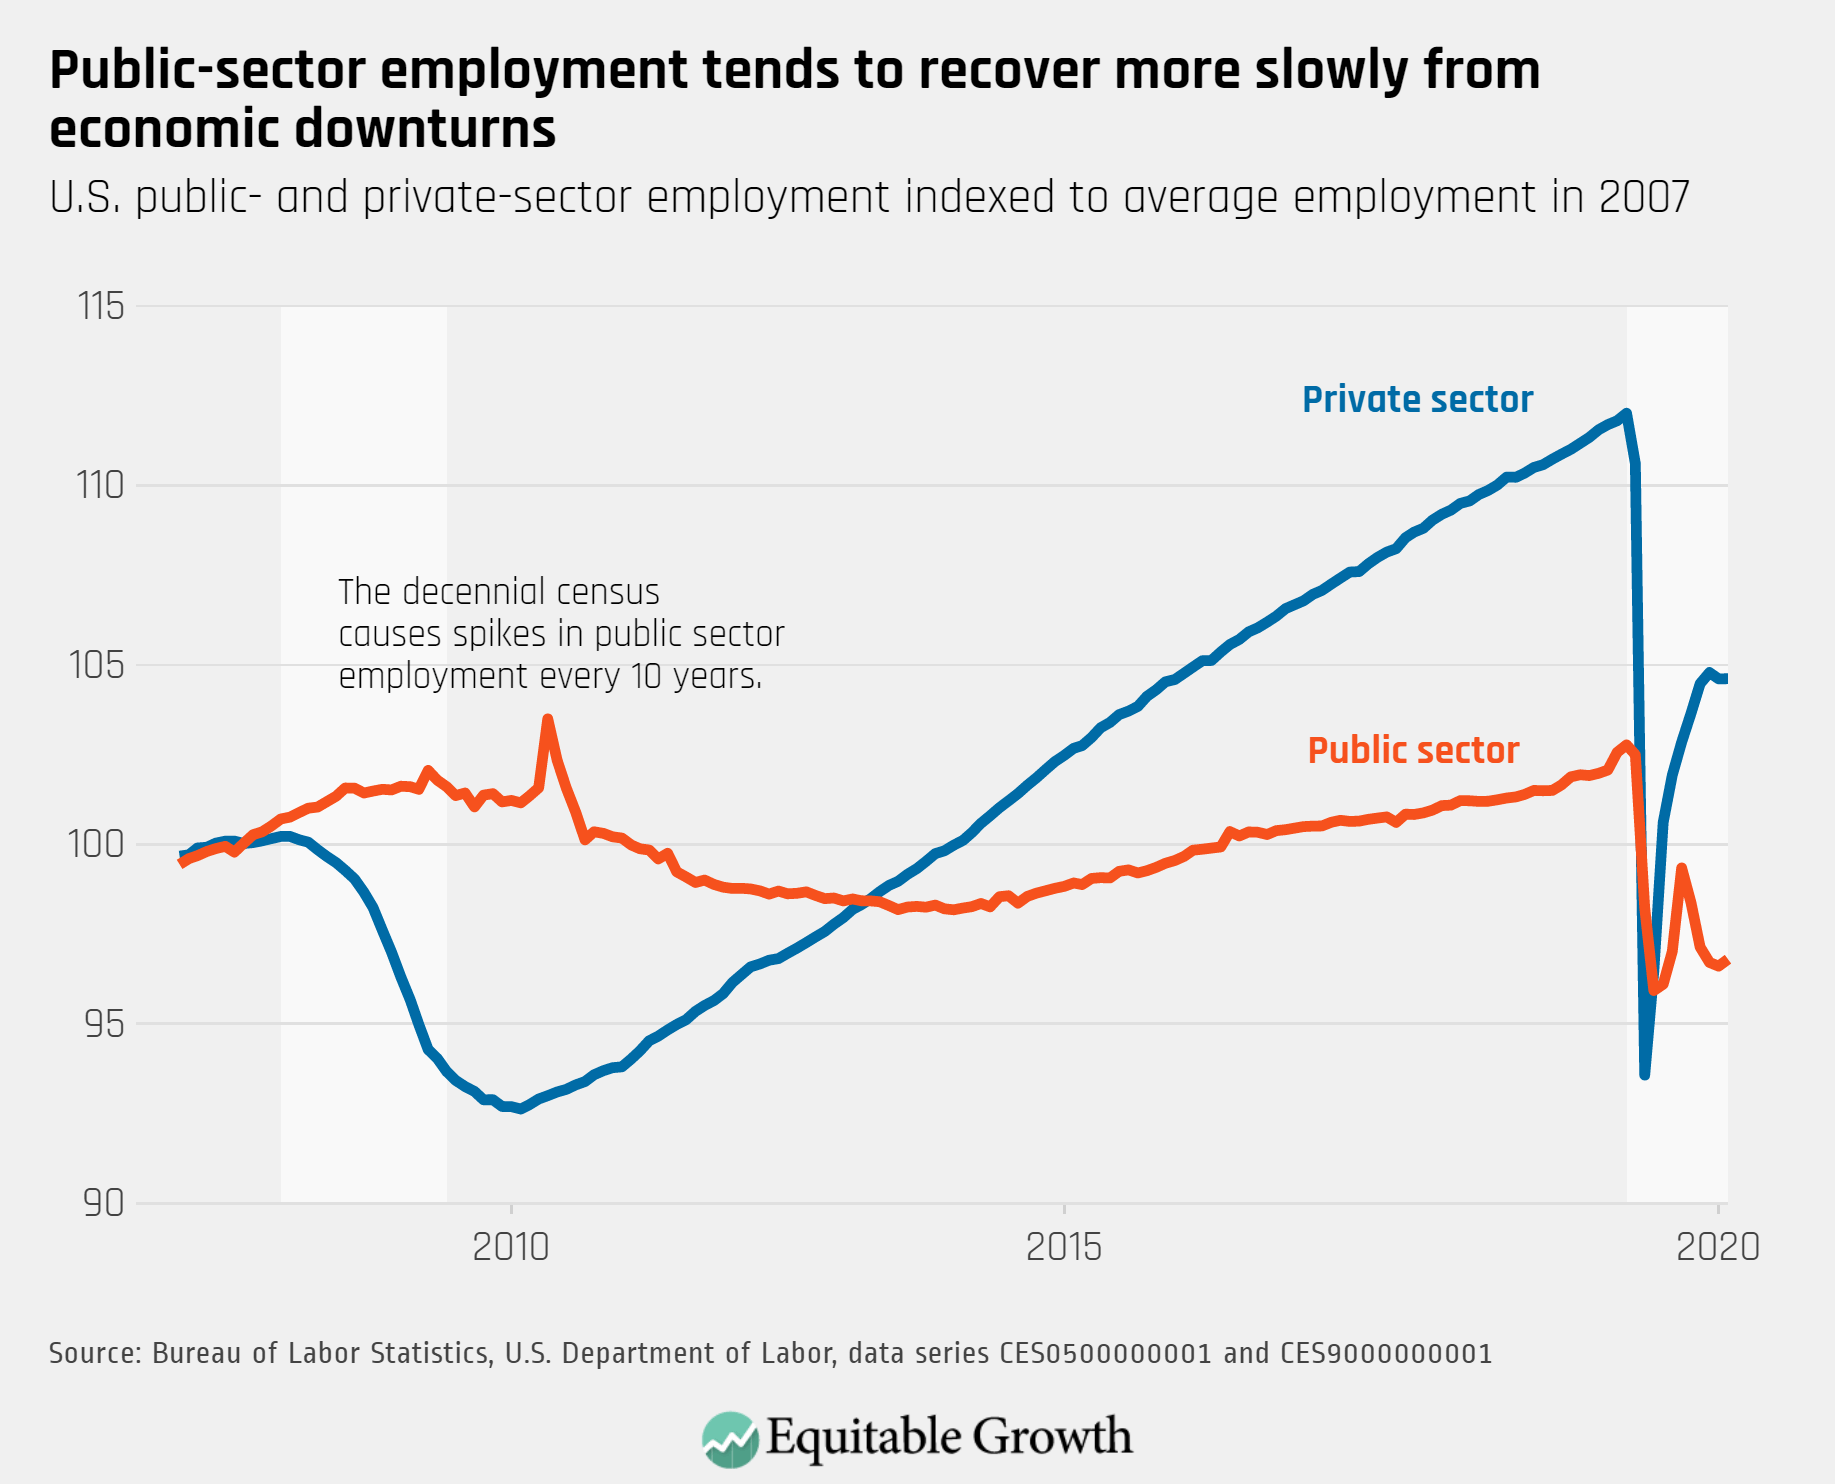
Public-sector employment added a small amount of jobs in January, but remains significantly below pre-pandemic levels and risks further decline in absence of fiscal relief.