Equitable Growth’s Jobs Day Graphs: December 2020 Report Edition
On January 8th, the U.S. Bureau of Labor Statistics released new data on the U.S. labor market during the month of December. Below are five graphs compiled by Equitable Growth staff highlighting important trends in the data.
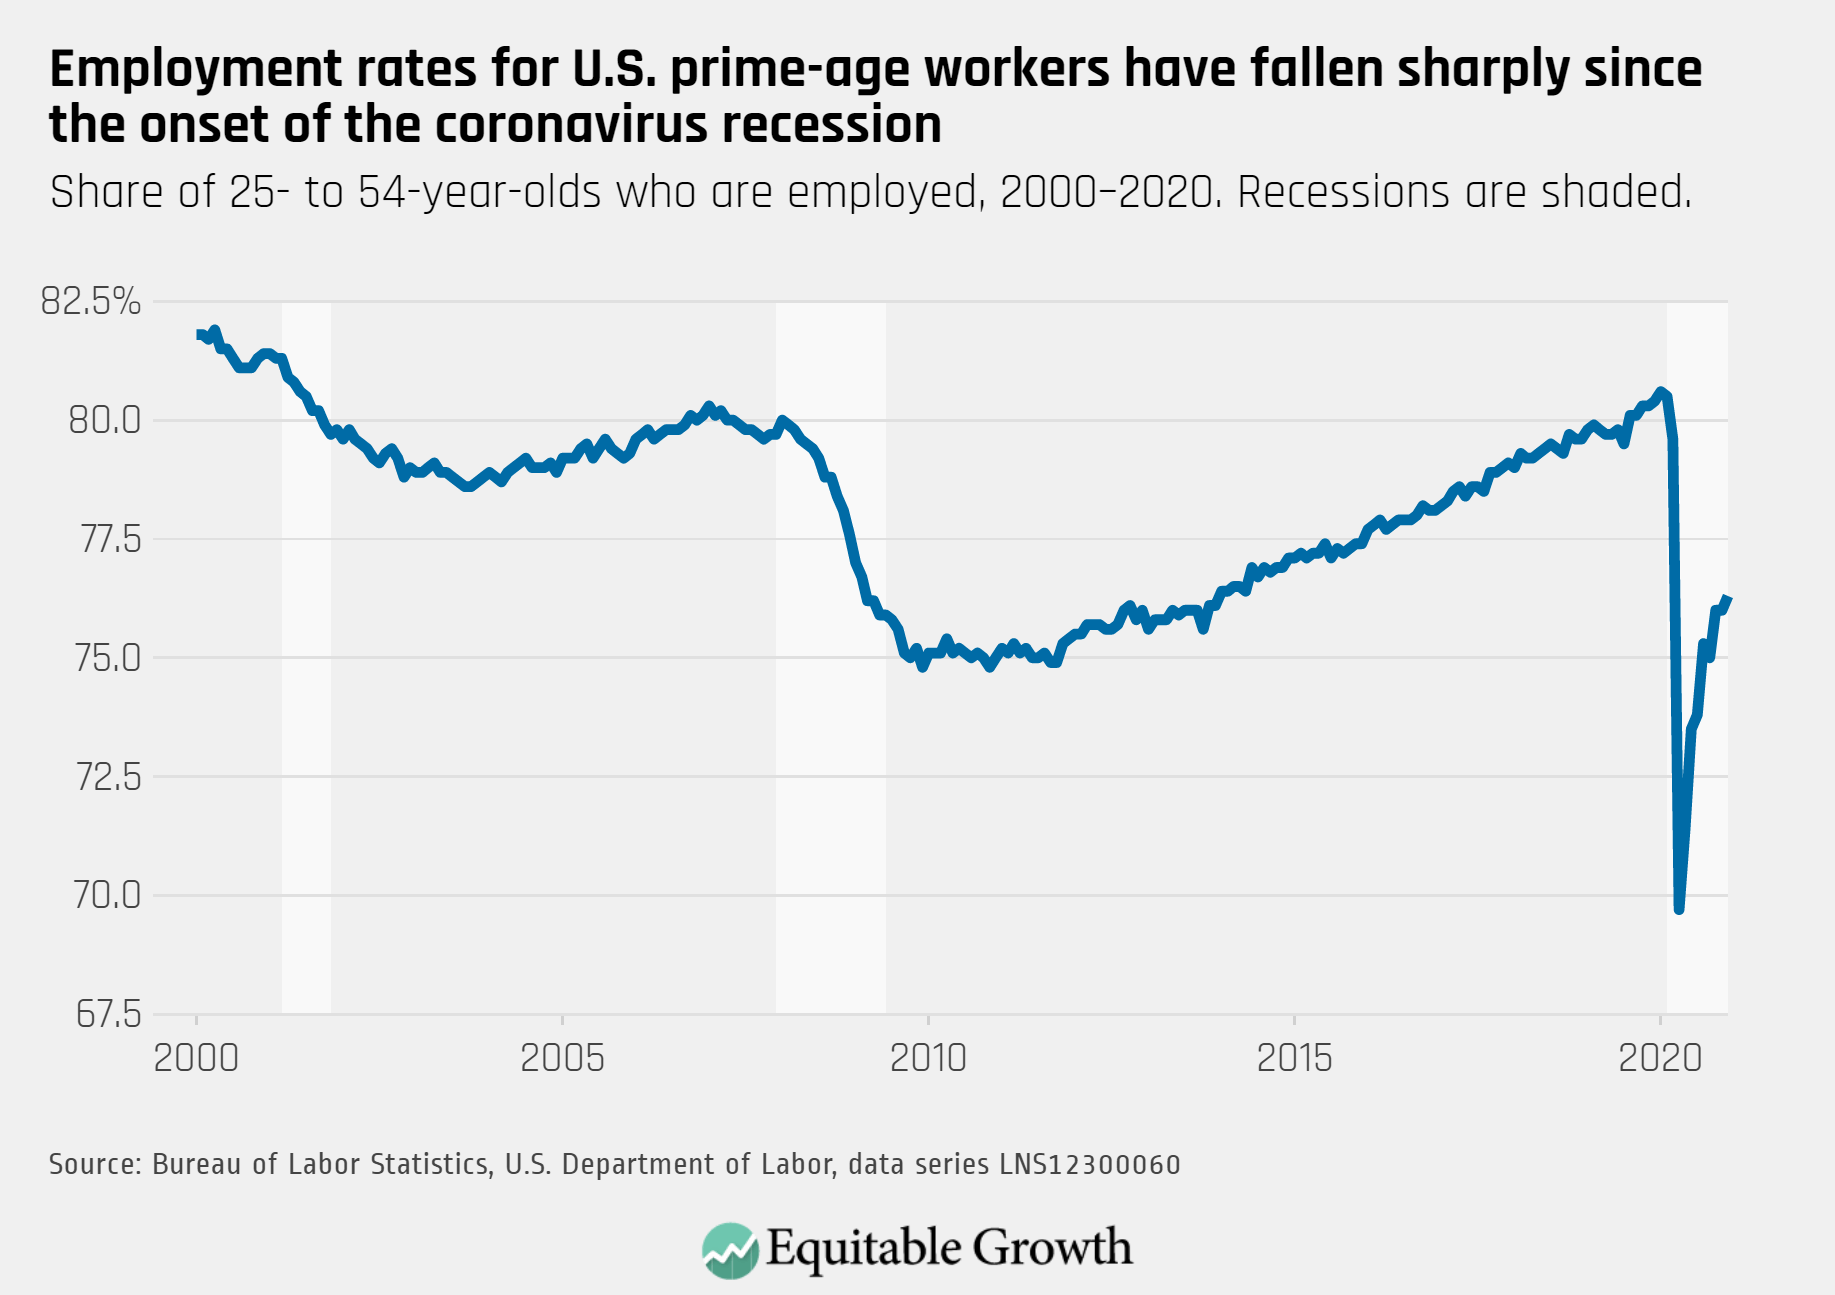
Despite an overall decrease in non-farm employment, the prime-age employment rate increased slightly from 76 percent to 76.3 percent.
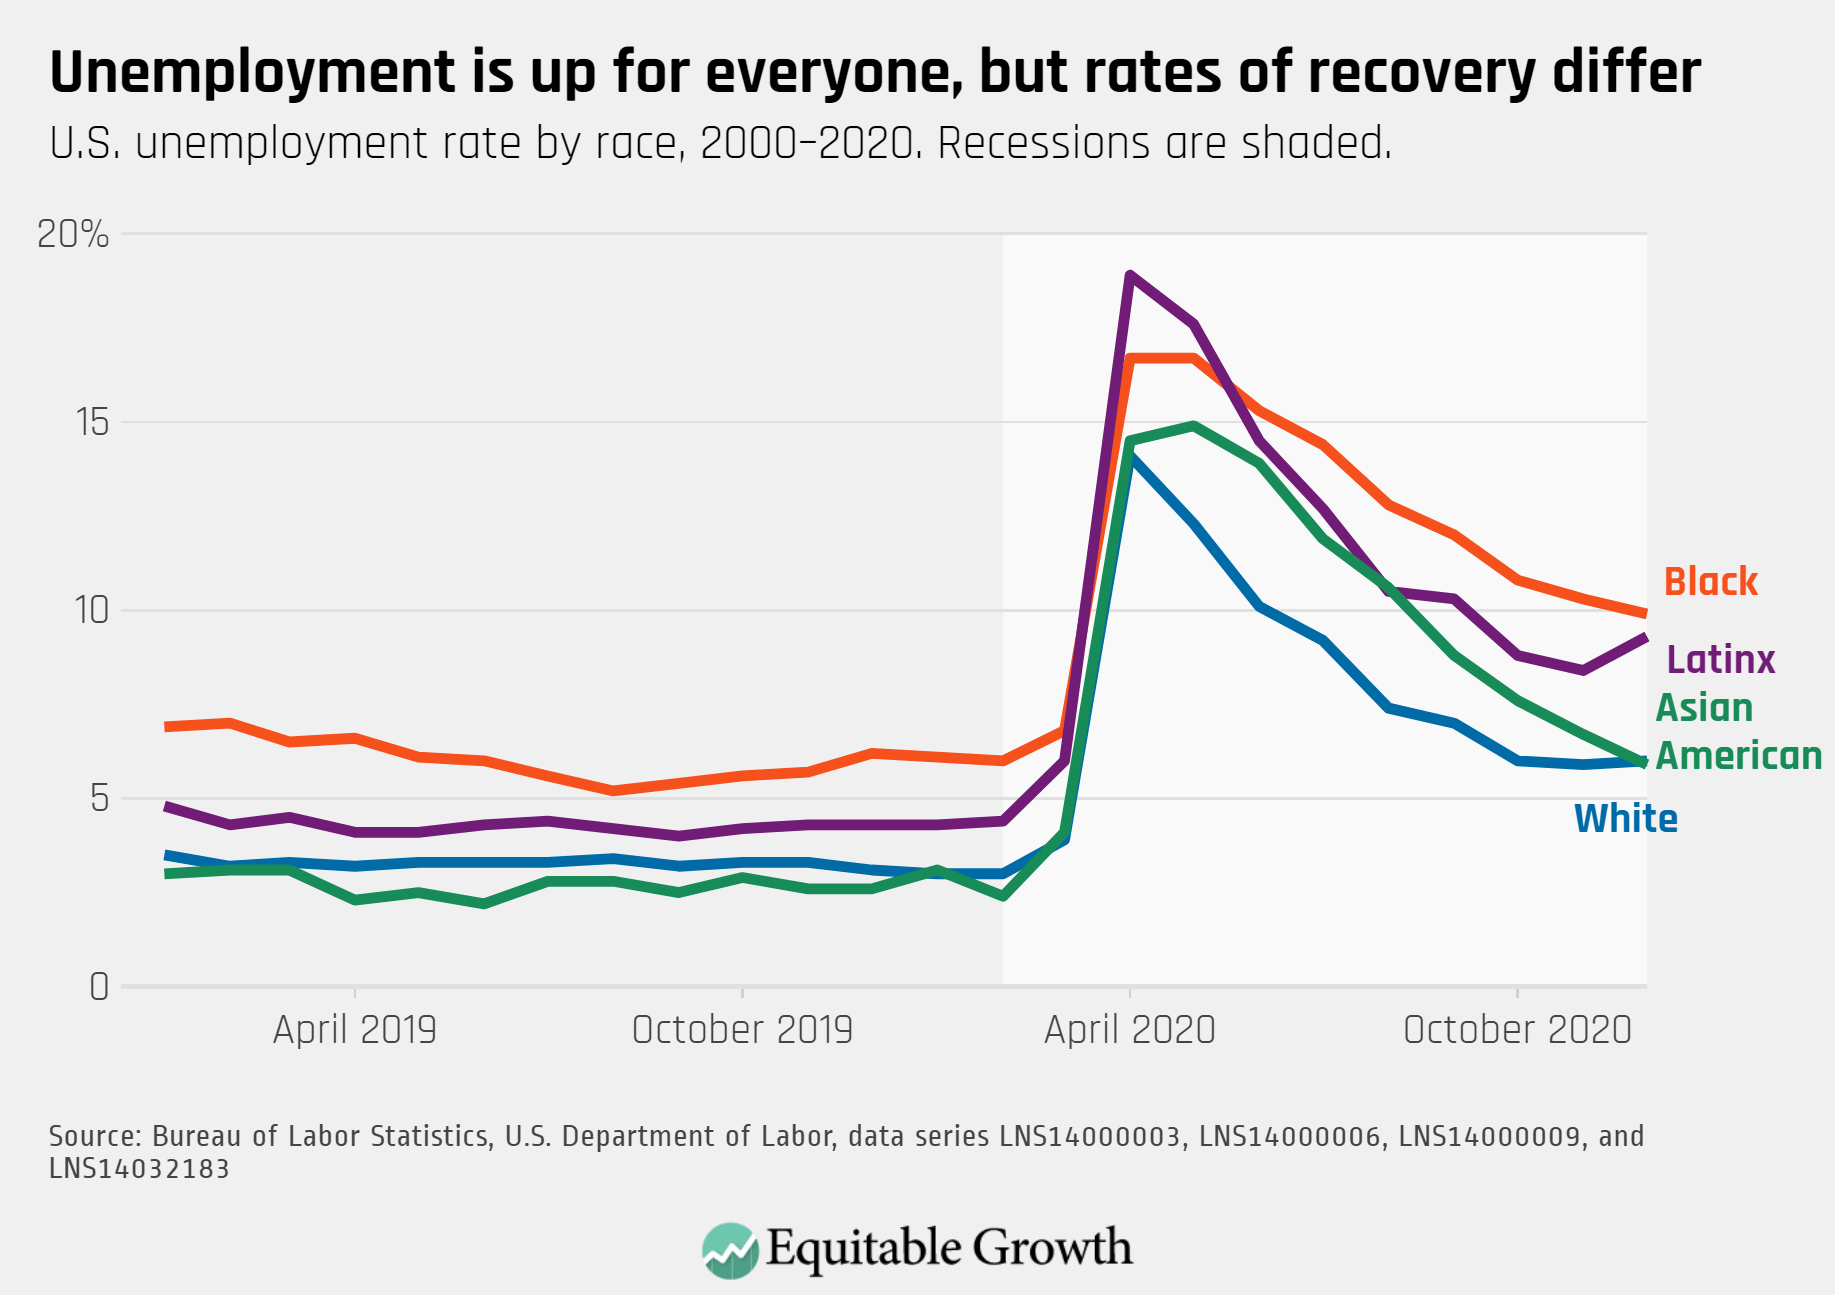
The unemployment rate increased for Latinx workers in December as employment declined significantly in the leisure and hospitality industry where these workers are over-represented.
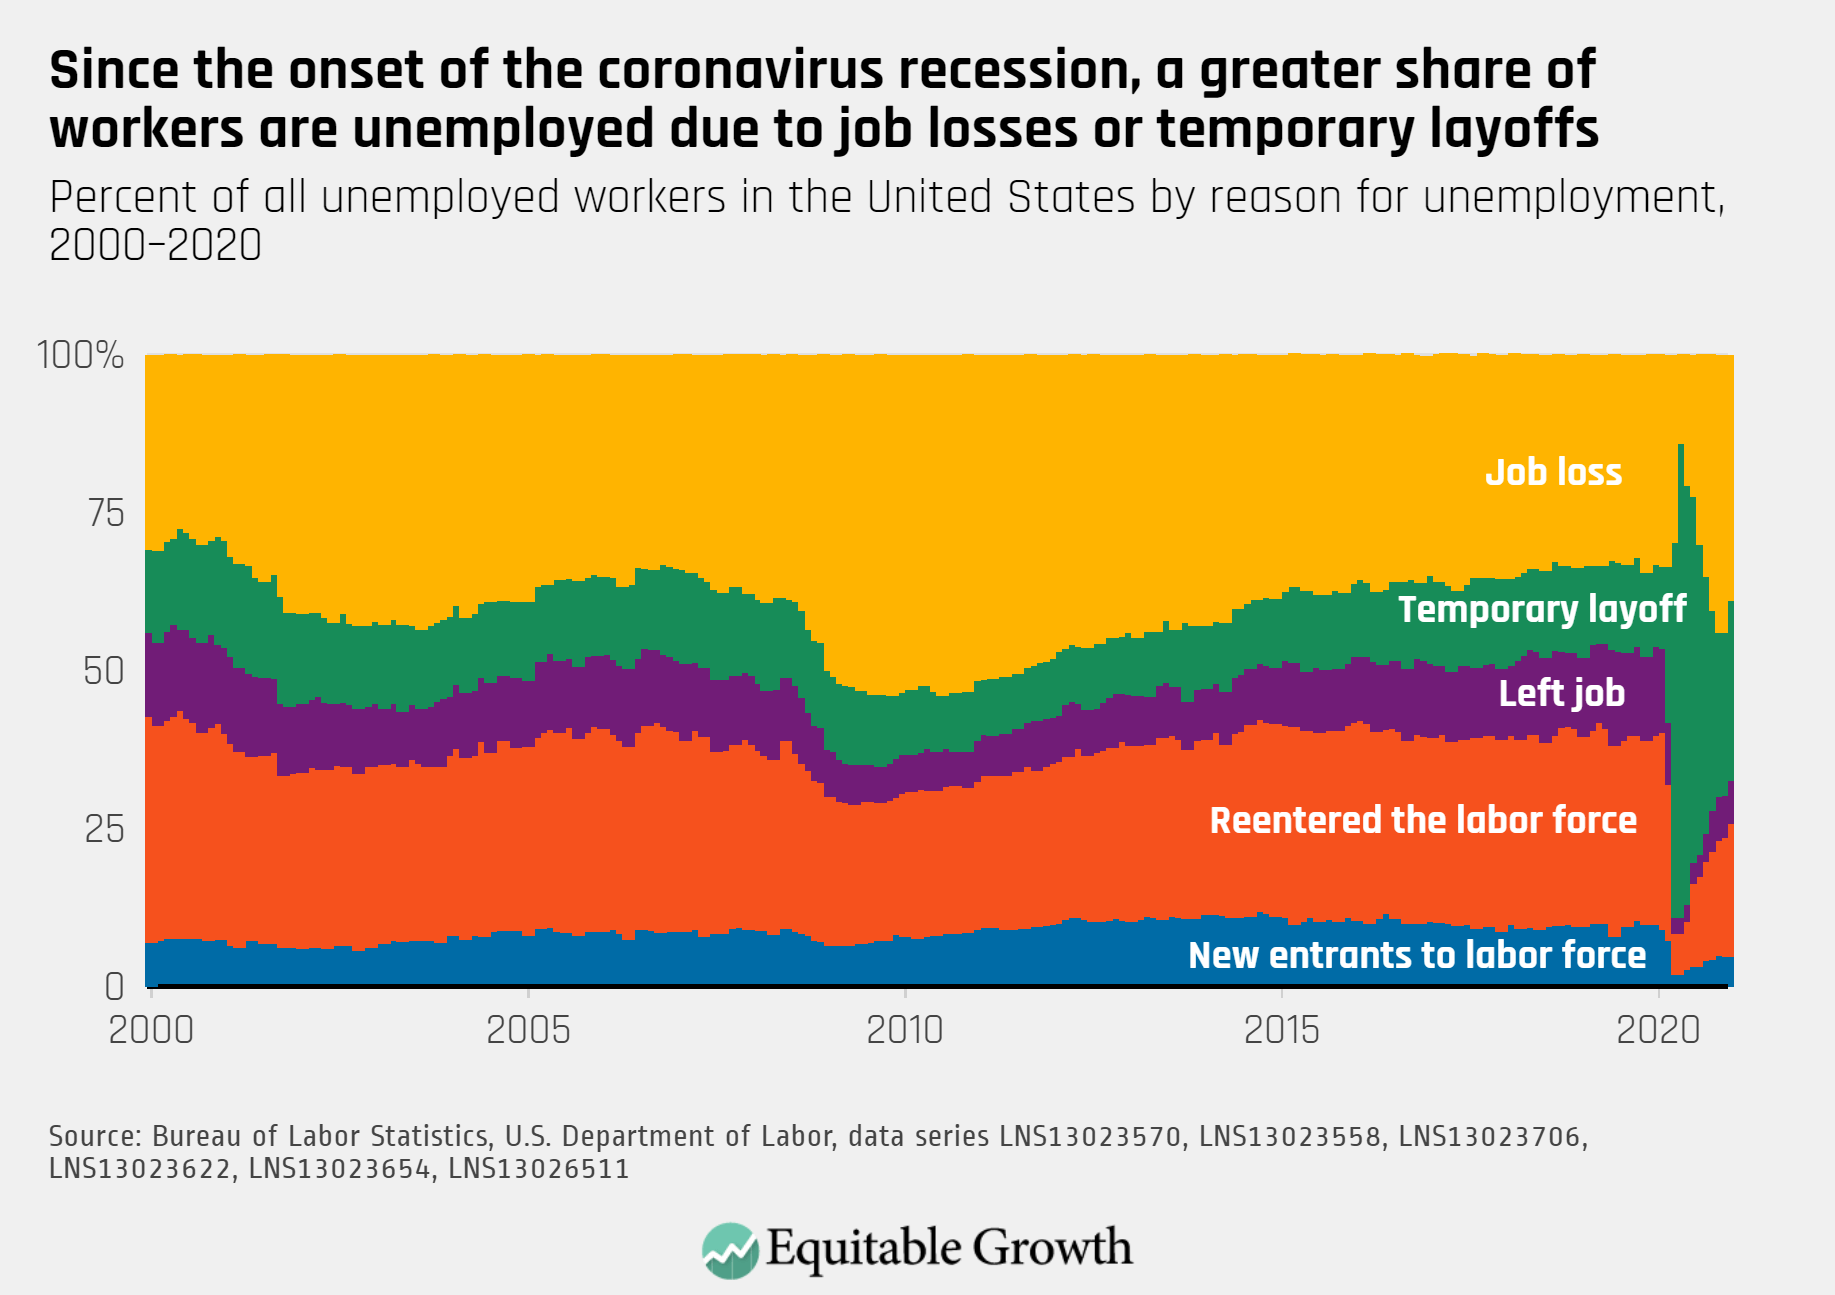
The unemployment rate was unchanged in December, but an increasing proportion of unemployed workers were on temporary layoff or new entrants to the labor market.
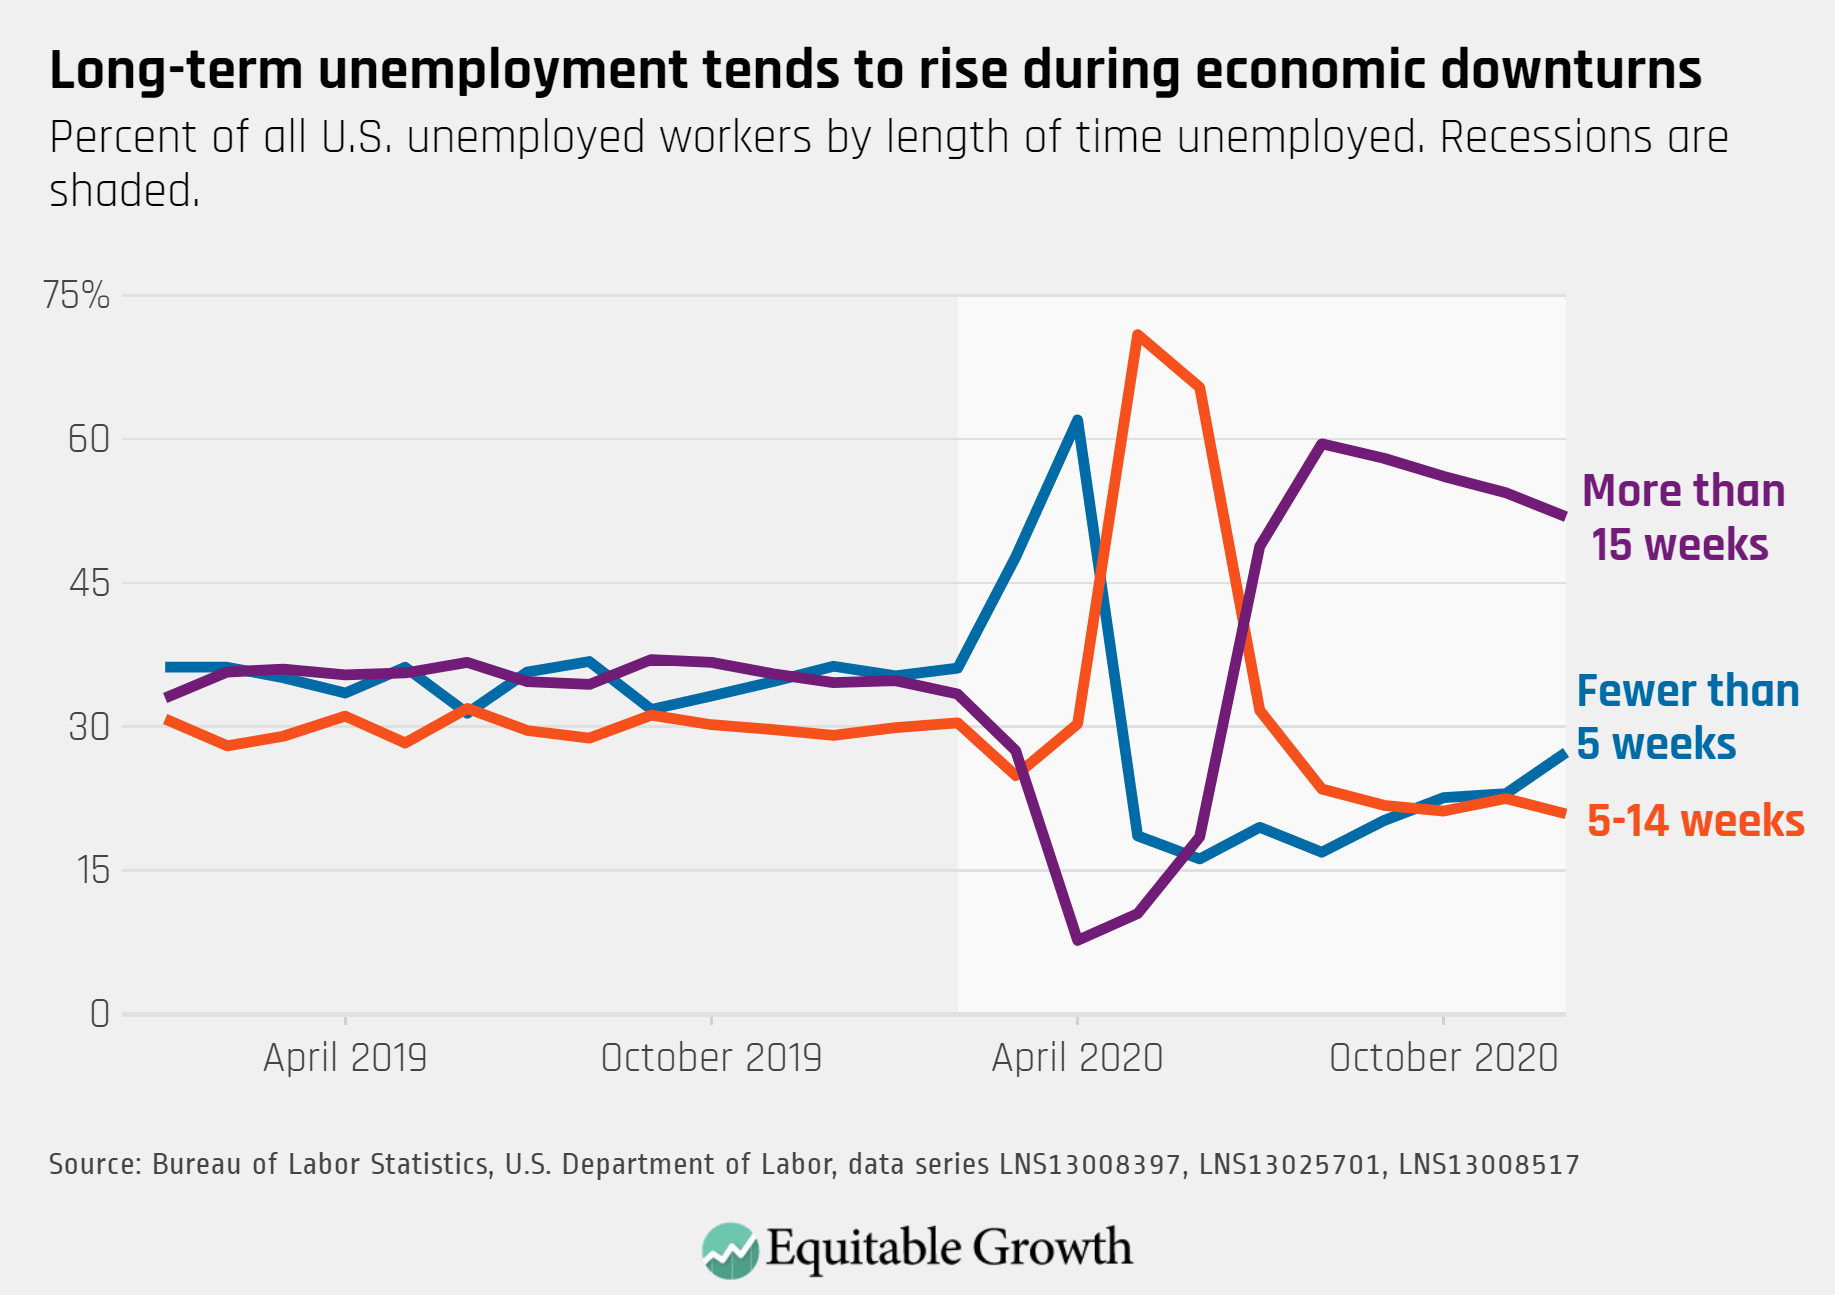
As the pandemic surged in December, an increasing proportion of unemployed workers have been out of work for fewer than 5 weeks.
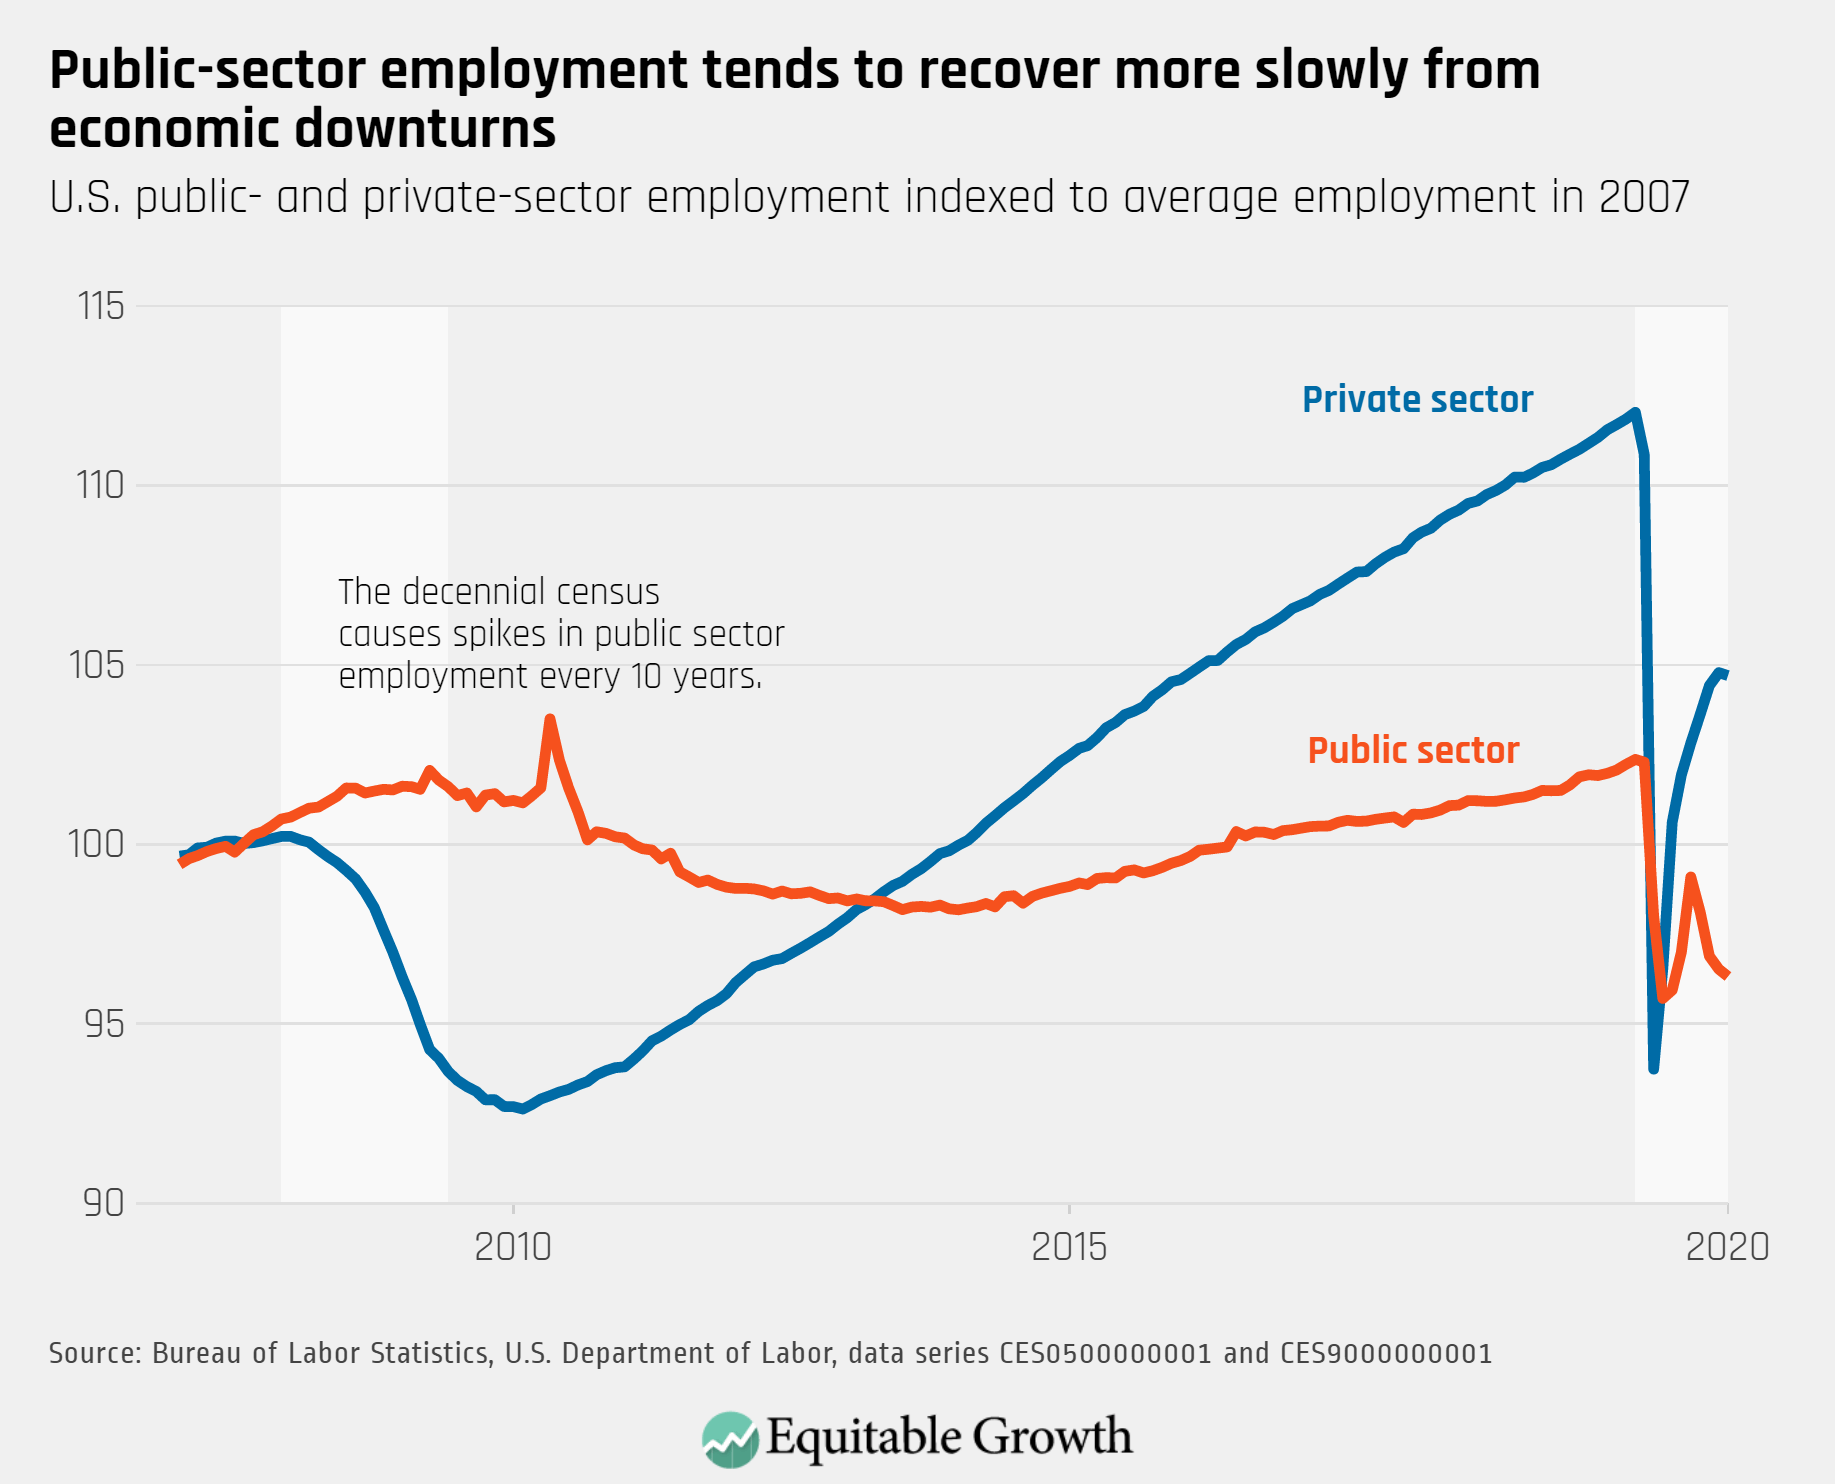
Public-sector employment continued to decline in December, led by decreases to non-education local government employment.