JOLTS Day Graphs: November 2020 Edition

Every month the U.S. Bureau of Labor Statistics releases data on hiring, firing, and other labor market flows from the Job Openings and Labor Turnover Survey, better known as JOLTS. Today, the BLS released the latest data for November 2020. This report doesn’t get as much attention as the monthly Employment Situation Report, but it contains useful information about the state of the U.S. labor market. Below are a few key graphs using data from the report.

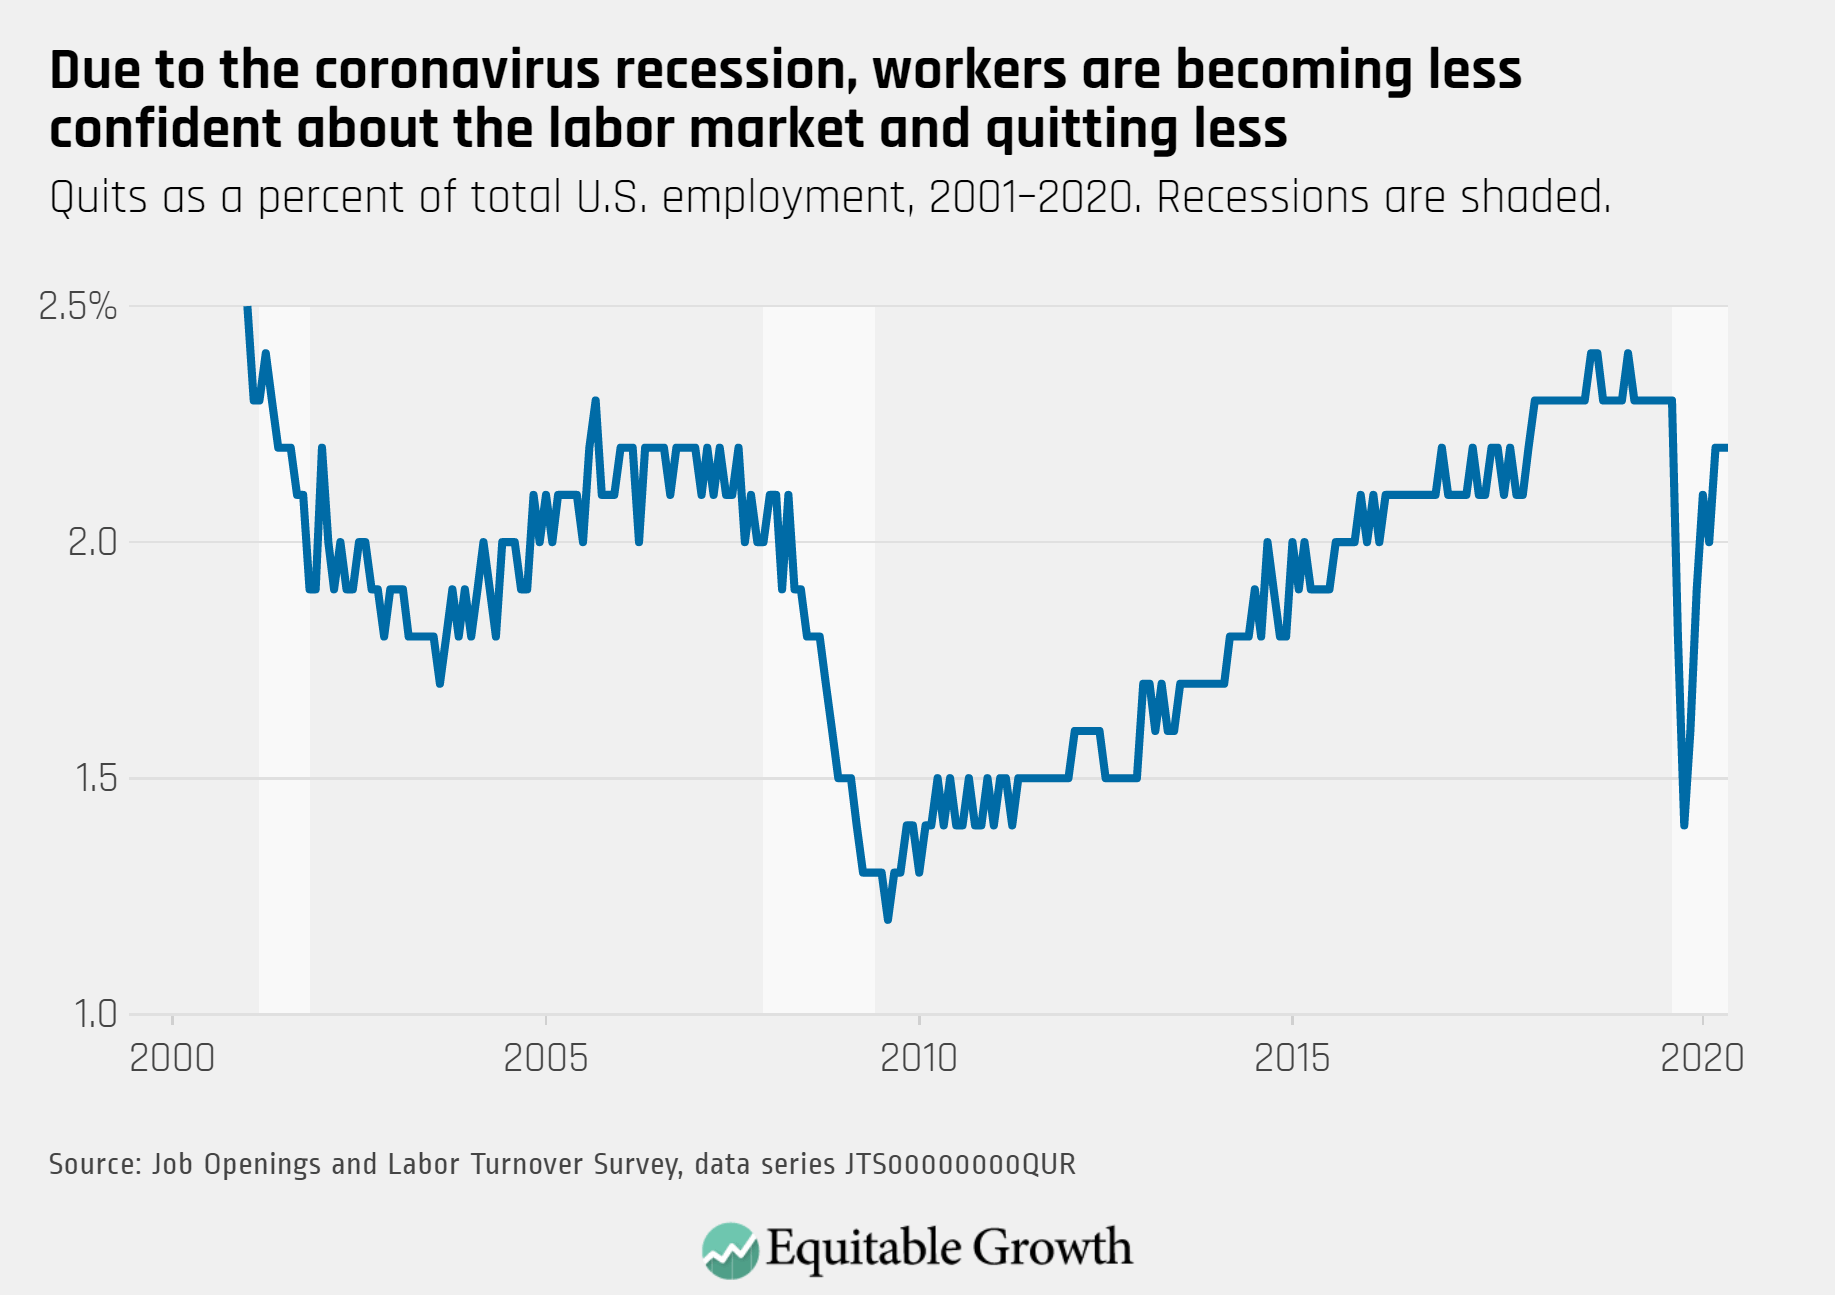
The quits rate has remained at 2.2 percent since September, but in November, it increased to 5.0 percent in accommodation and food services, where pay has declined and jobs are risky due to the pandemic.

Quits as a percent of total employment , 2001–2020

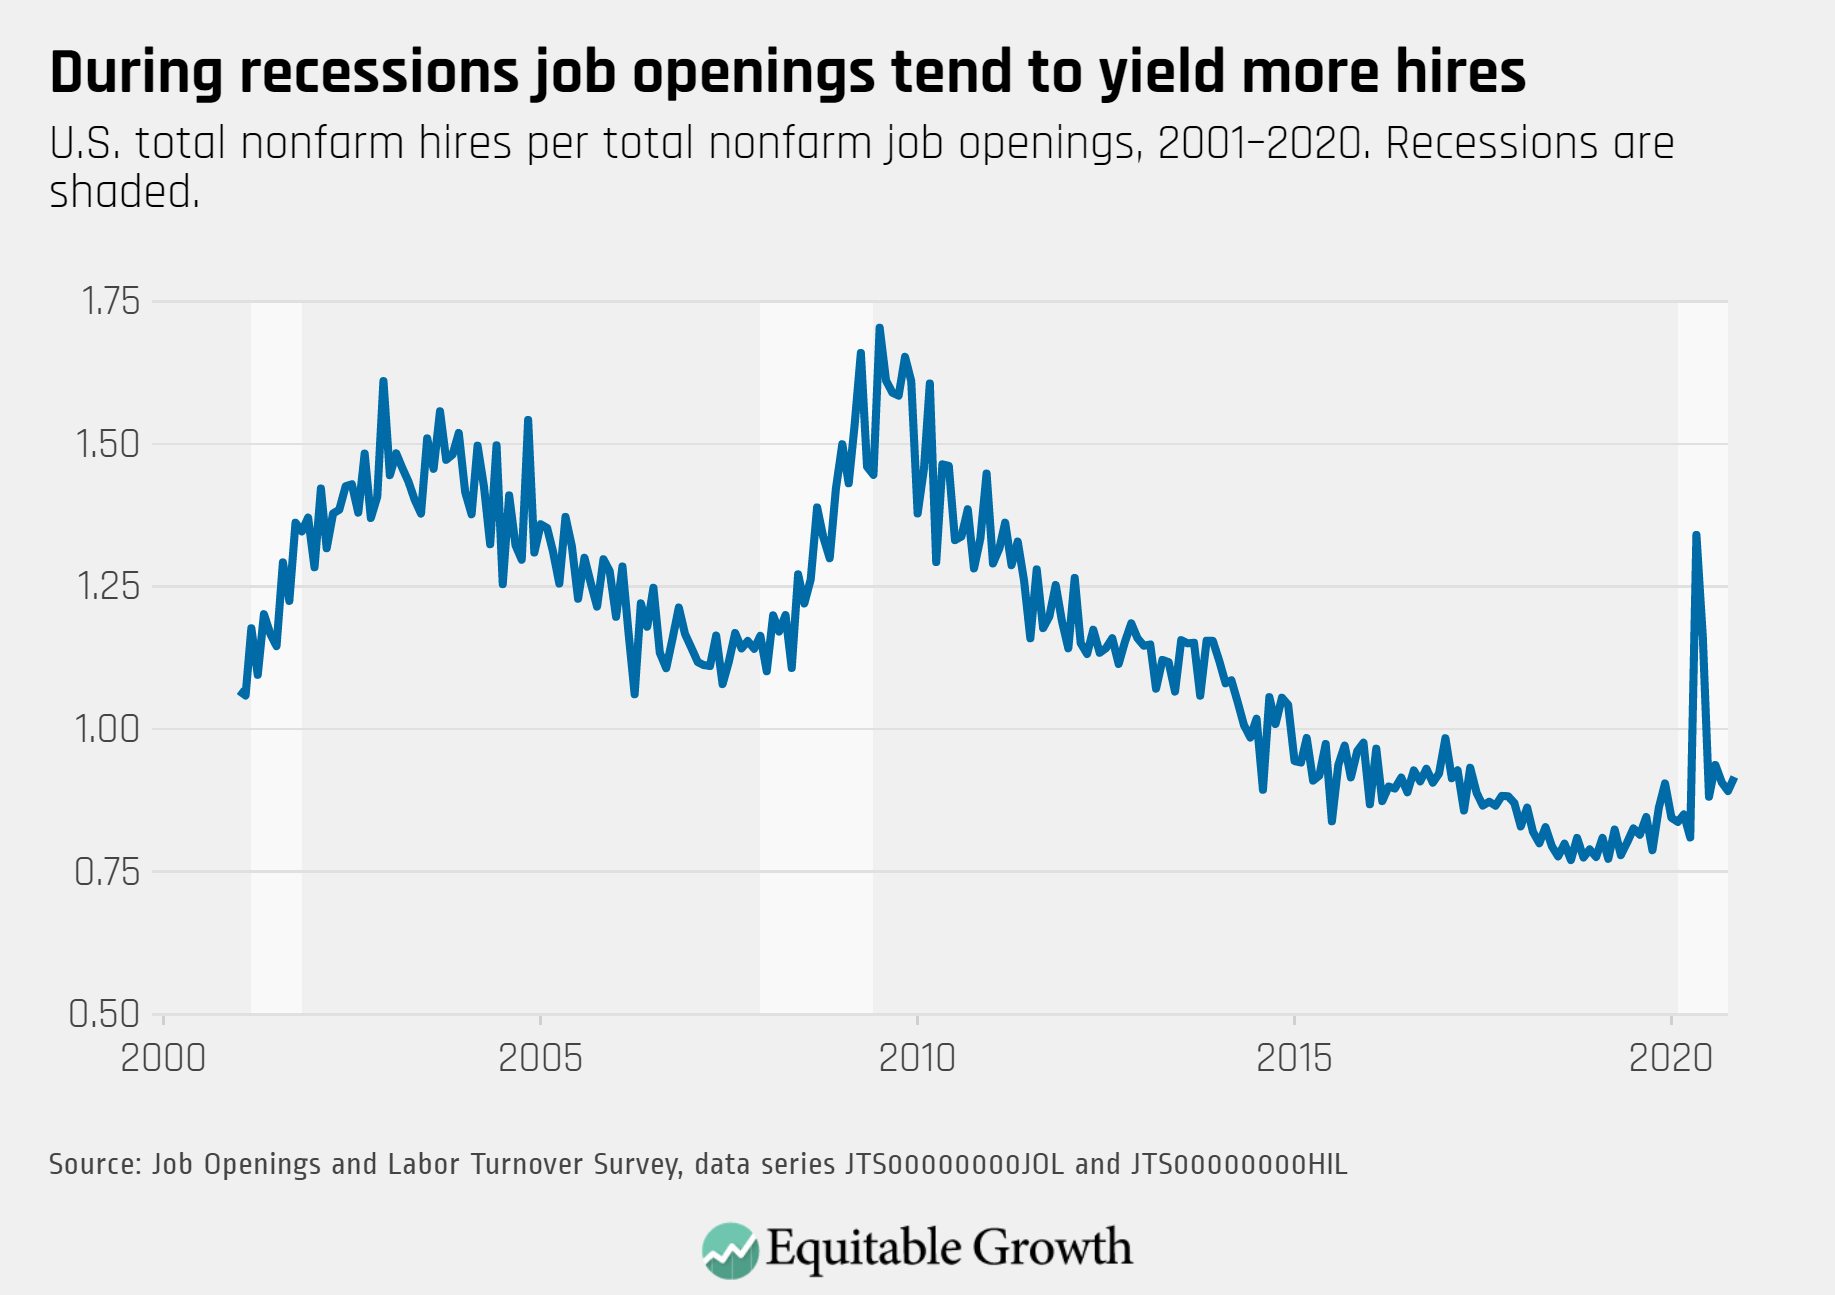
The vacancy yield was little changed in November as the hires rate stayed the same and the job openings rate declined slightly.

U.S. total nonfarm hires per total nonfarm job openings, 2001–2020

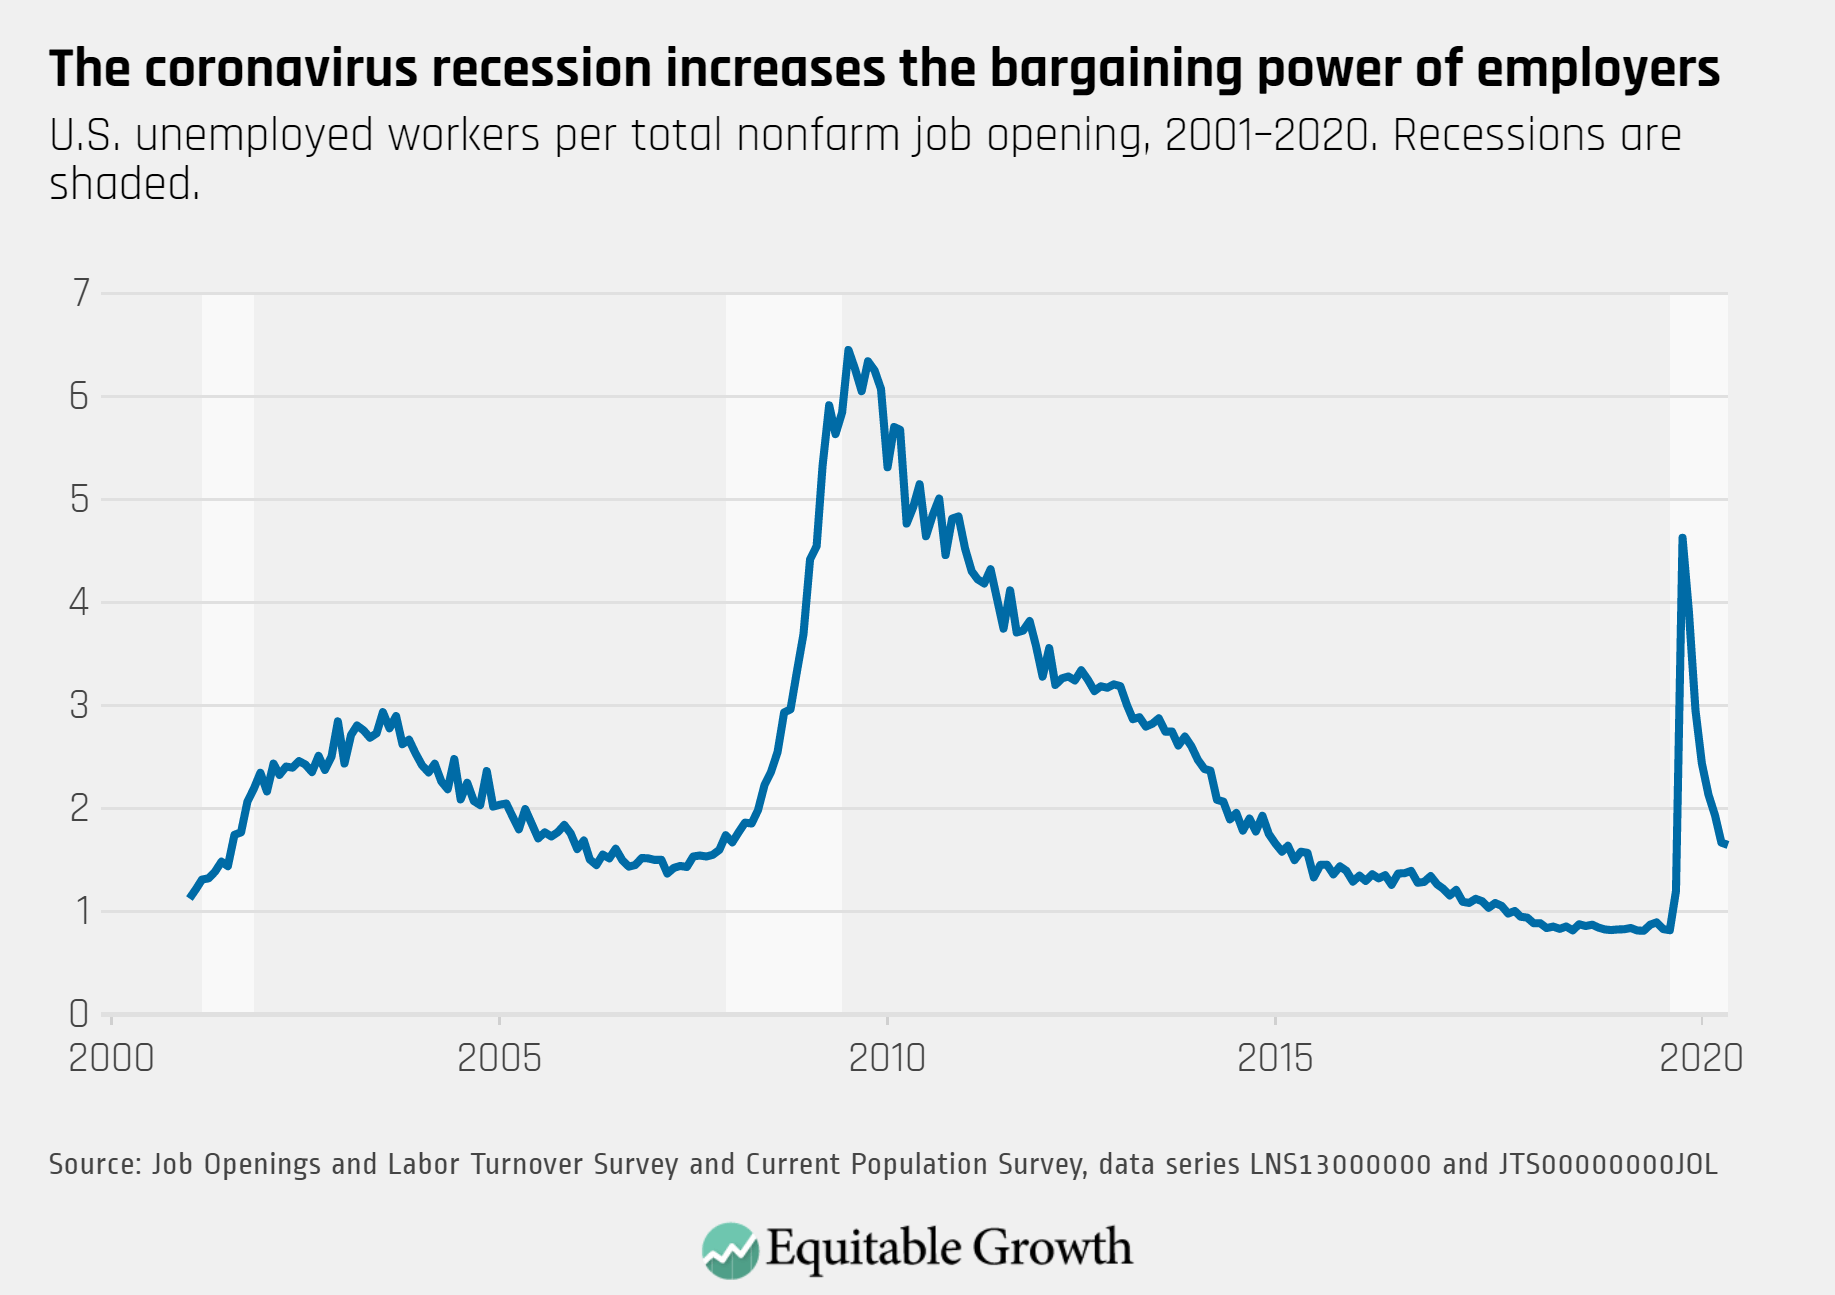
As the unemployment rate declined in November, the ratio of unemployed workers per job opening declined slightly to 1.64.

U.S. unemployed workers per total nonfarm job opening, 2001–2020

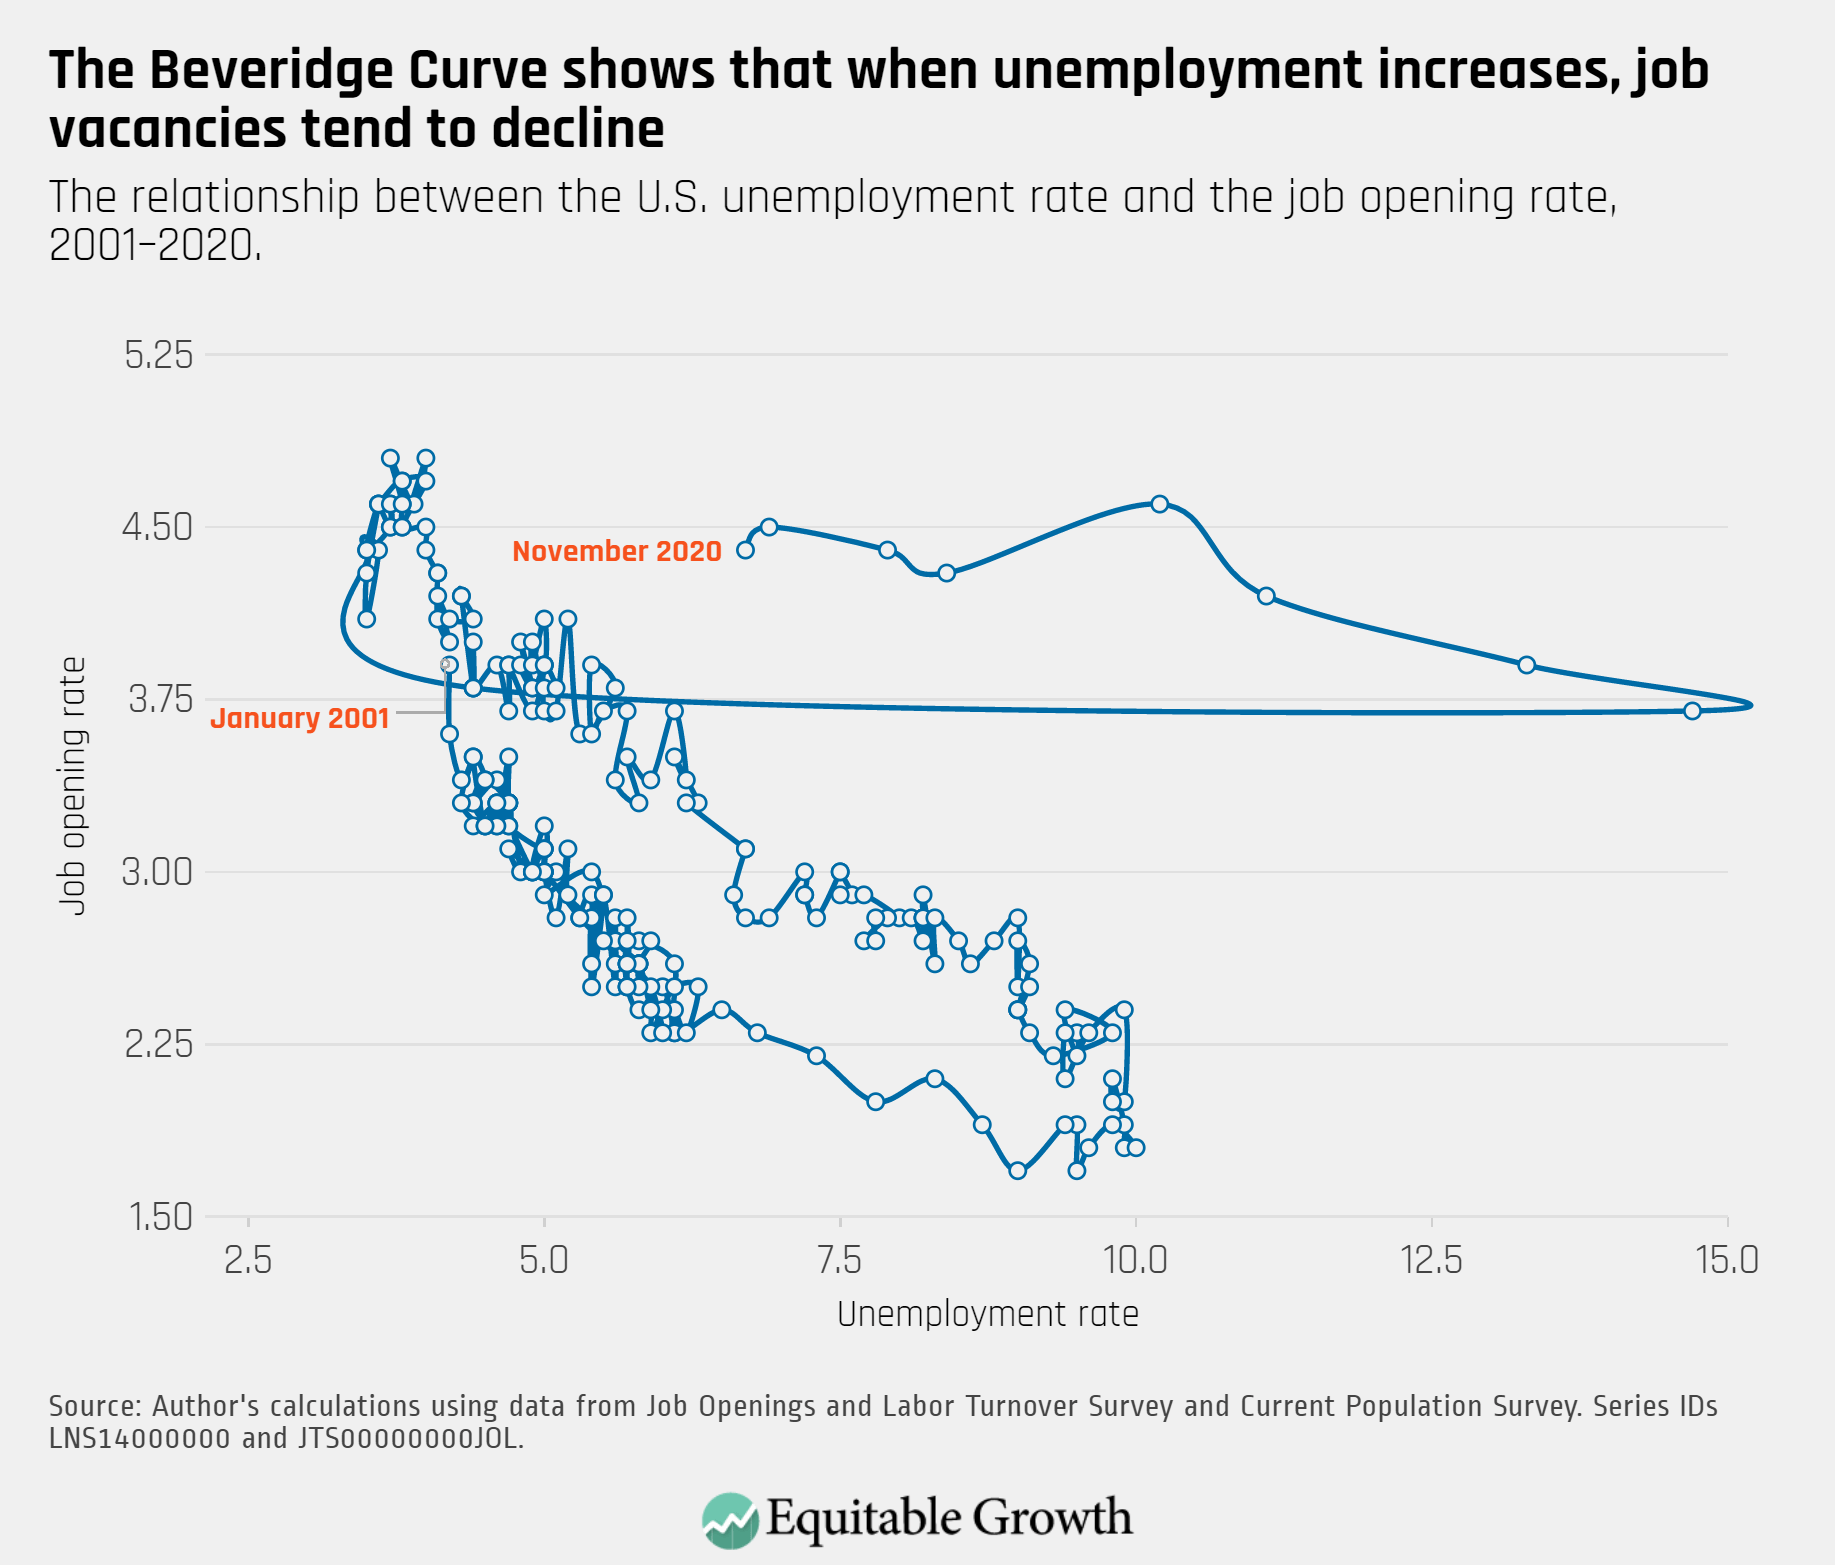
The Beveridge Curve moved little in November as the unemployment rate declined by 0.2 percentage points and the job openings rate declined by 0.1 percentage points.

The relationship between the U.S. unemployment rate and the job opening rate, 2001–2020
Connect with us!

Explore the Equitable Growth network of experts around the country and get answers to today's most pressing questions!

Get in Touch