Equitable Growth’s Jobs Day Graphs: November 2020 Report Edition
On December 4, the U.S. Bureau of Labor Statistics released new data on the U.S. labor market during the month of November. Below are five graphs compiled by Equitable Growth staff highlighting important trends in the data.
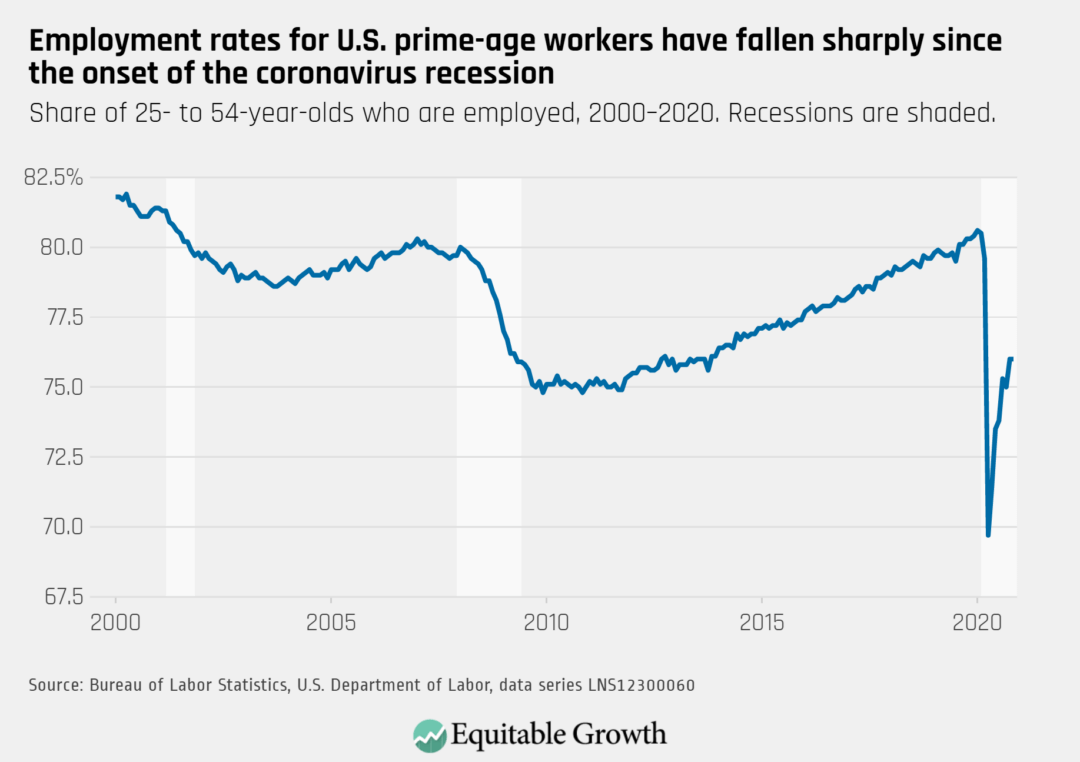
Prime-age employment held steady at 76 percent showing no improvement in November, after a steep decline in the spring and only a partial recovery in the summer and fall.
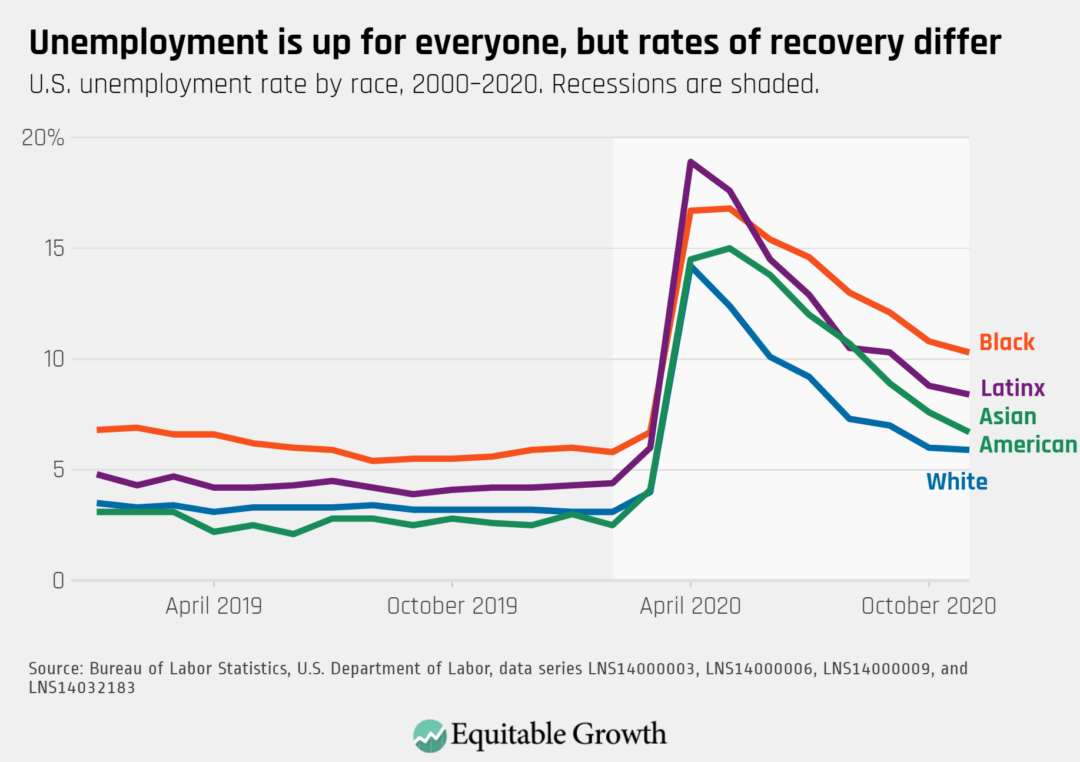
The unemployment rate for Black workers remained in double digits at 10.3 percent, while the unemployment rate for White workers declined slightly to 5.9 percent due to workers dropping out of the labor force.
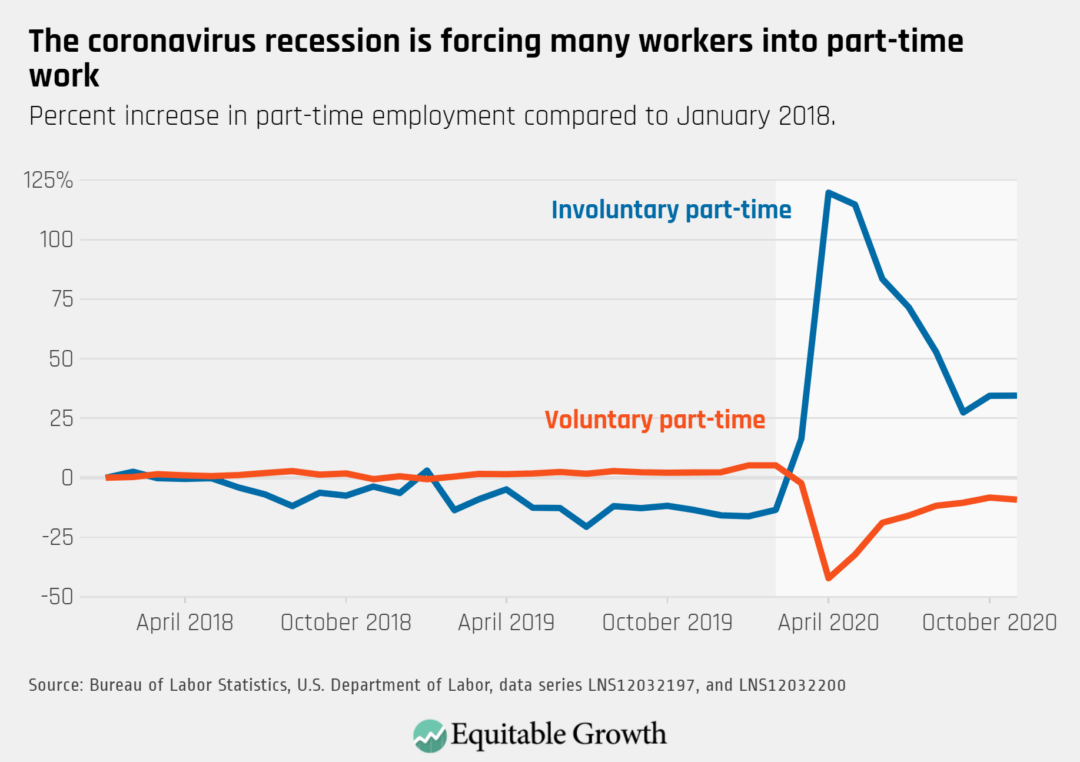
Part-time workers who would prefer full-time work saw no improvement in November as involuntary part-time employment remains 2.3 million above the February level.
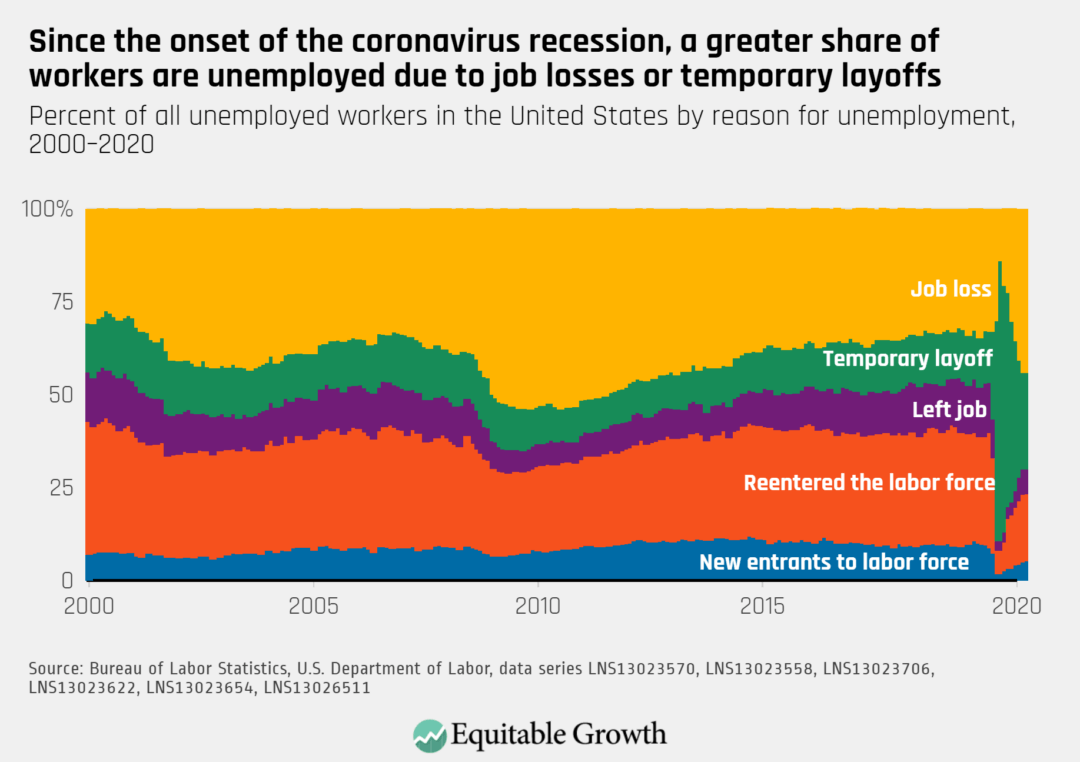
An increasing proportion of unemployed workers are permanent job-losers with those on temporary layoff, voluntarily leaving their job, and reentering the labor market all declining.
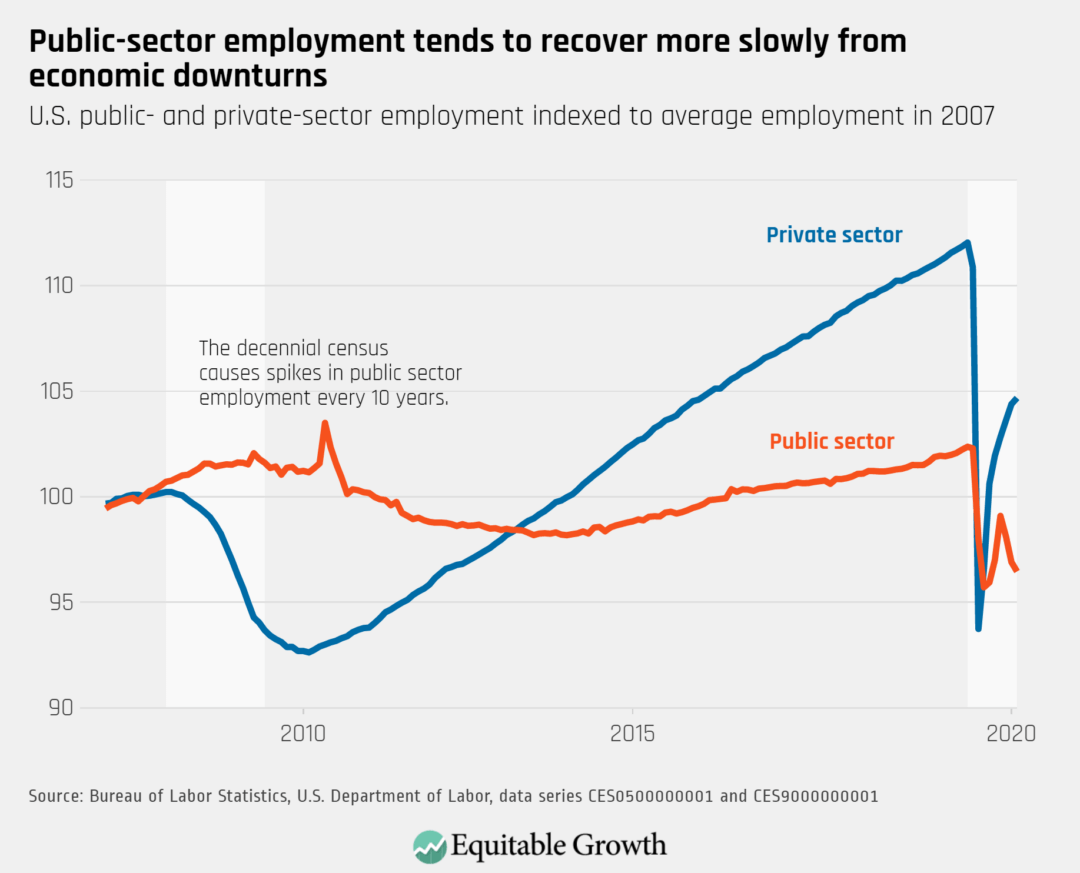
Employment in government dropped for a third consecutive month, decreasing by nearly 100,000 jobs in November.