JOLTS Day Graphs: September 2020 Edition

Every month the U.S. Bureau of Labor Statistics releases data on hiring, firing, and other labor market flows from the Job Openings and Labor Turnover Survey, better known as JOLTS. Today, the BLS released the latest data for September 2020. This report doesn’t get as much attention as the monthly Employment Situation Report, but it contains useful information about the state of the U.S. labor market. Below are a few key graphs using data from the report.

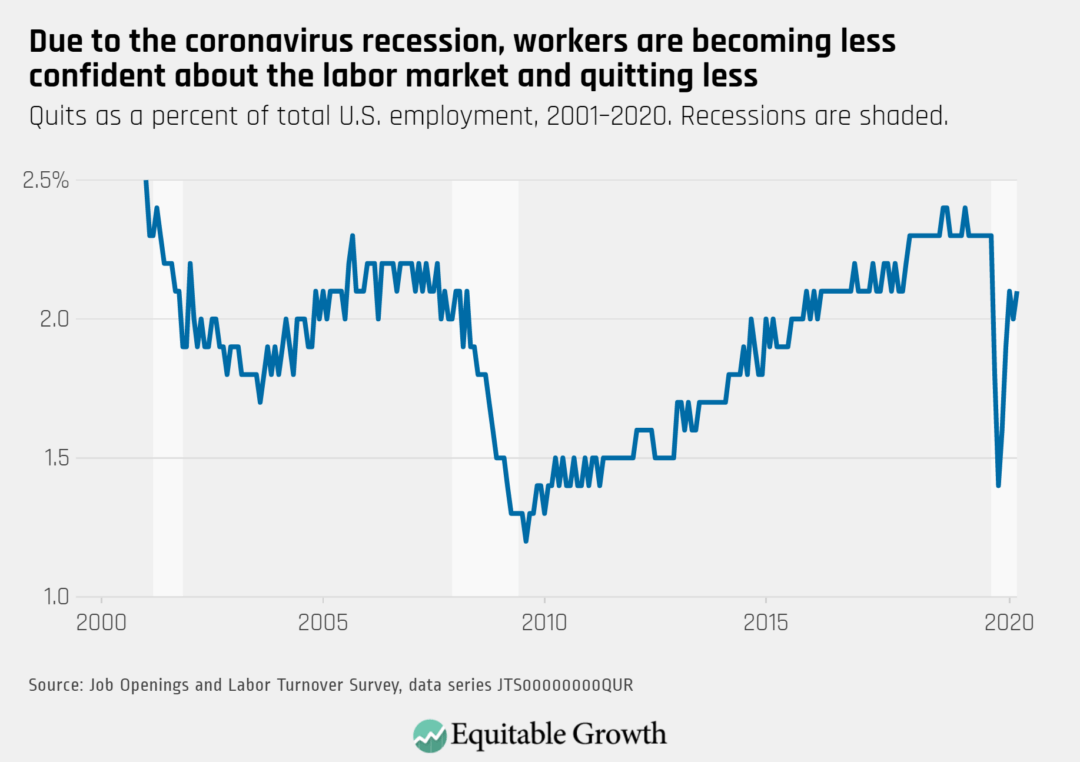
The quits rate increased slightly to 2.1 percent in September, signaling stalled prospects for workers. 

Quits as a percent of total U.S. employment, 2001-2020

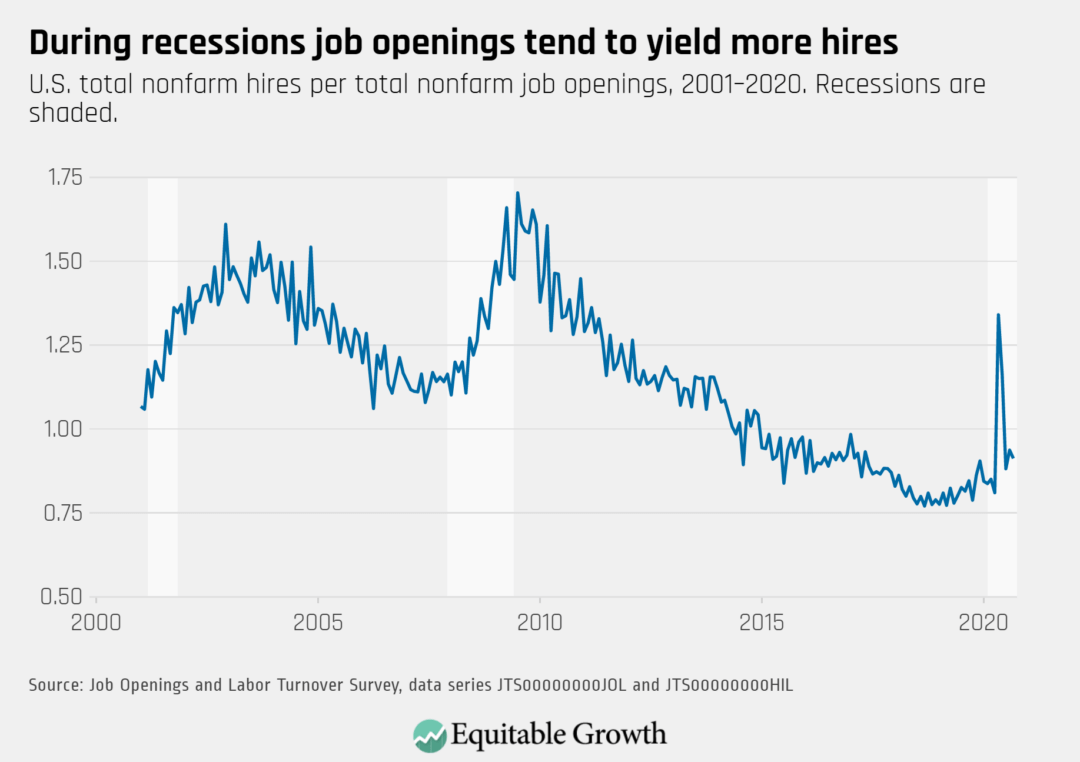
The vacancy yield was essentially unchanged in September, as the rate of job openings stayed at 4.3 percent and the rate of hires remained at 4.1 percent. Hires decreased significantly in the federal government due to a drop in demand for 2020 Census workers, but hires also fell in retail and educational services.

U.S. total nonfarm hires per total nonfarm job openings, 2001–2021

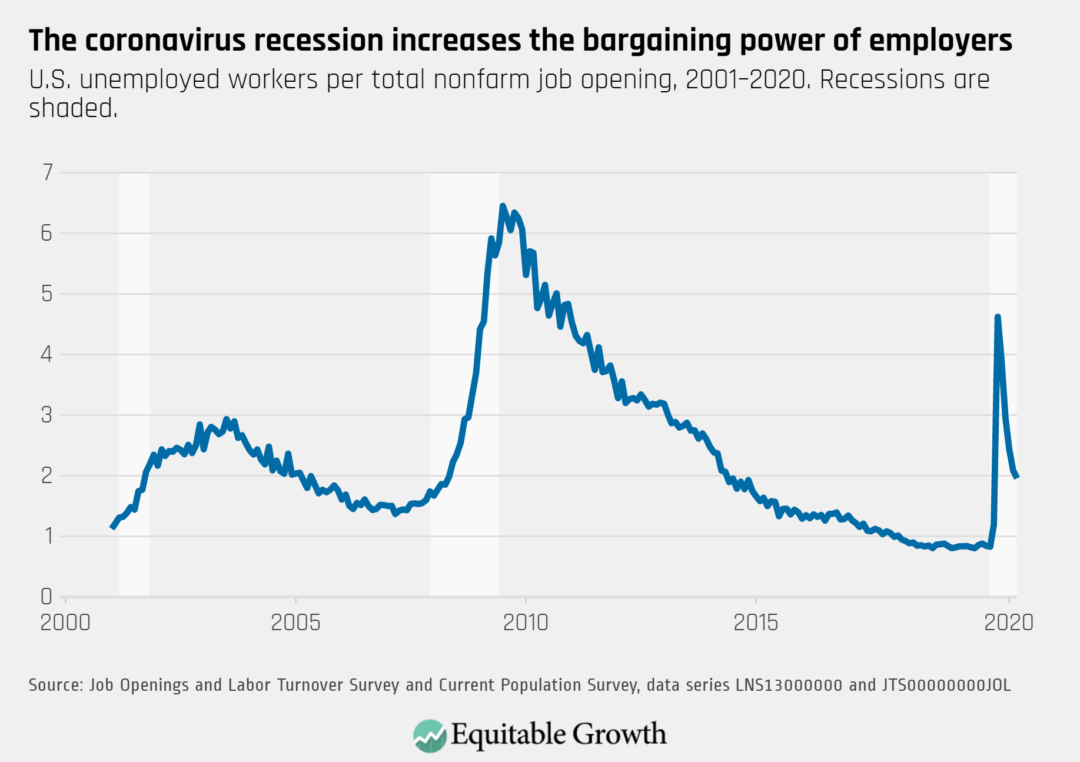
Since job openings remained unchanged and unemployment declined, the ratio of unemployed-worker-per-opening dropped slightly to 1.95.

U.S. unemployed workers per total nonfarm job opening, 2001–2020.

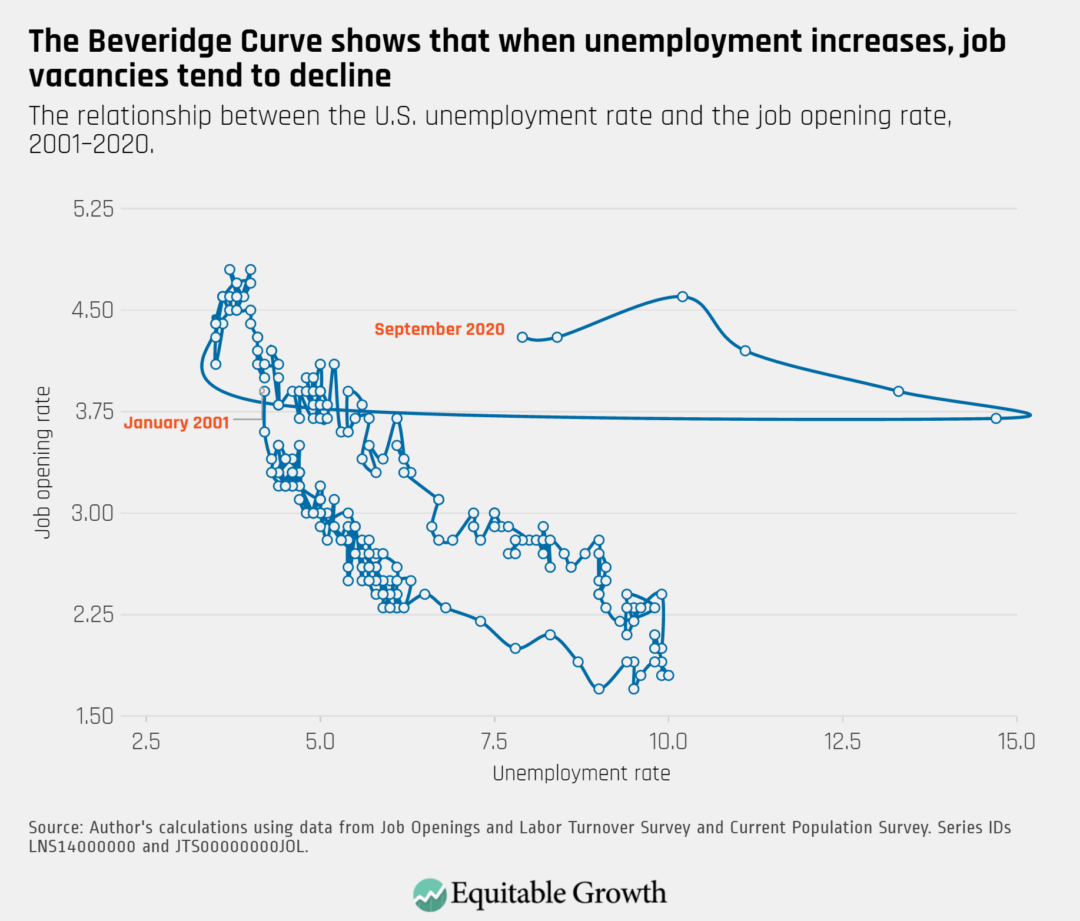
The Beveridge Curve continues to move closer to typical territory in September as unemployment declined, but job openings did not increase in the tenuous recovery.

The relationship between the U.S. unemployment rate and the job opening rate, 2001–2020
Connect with us!

Explore the Equitable Growth network of experts around the country and get answers to today's most pressing questions!

Get in Touch