Equitable Growth’s Jobs Day Graphs: October 2020 Report Edition
On November 6, the U.S. Bureau of Labor Statistics released new data on the U.S. labor market during the month of October. Below are five graphs compiled by Equitable Growth staff highlighting important trends in the data.
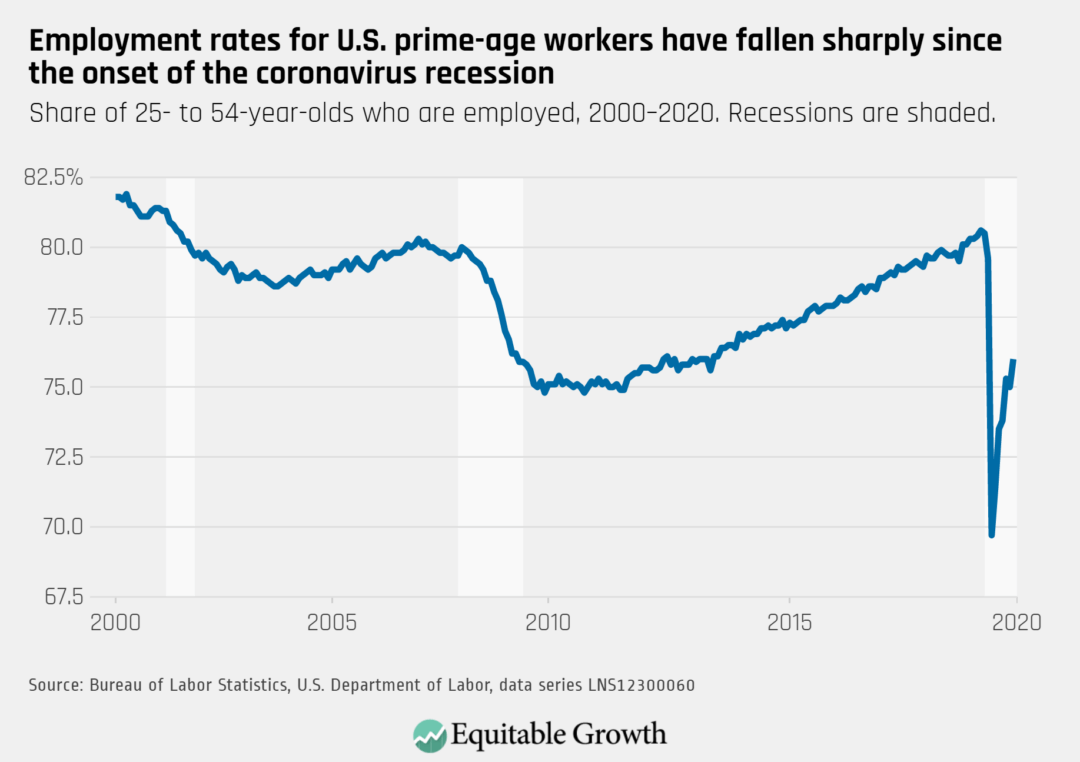
While the employment rate of prime-age workers continued to recover in October, reaching 76 percent compared to the pre-pandemic height of 80.5 percent, the pace of its improvement has decreased since the summer.
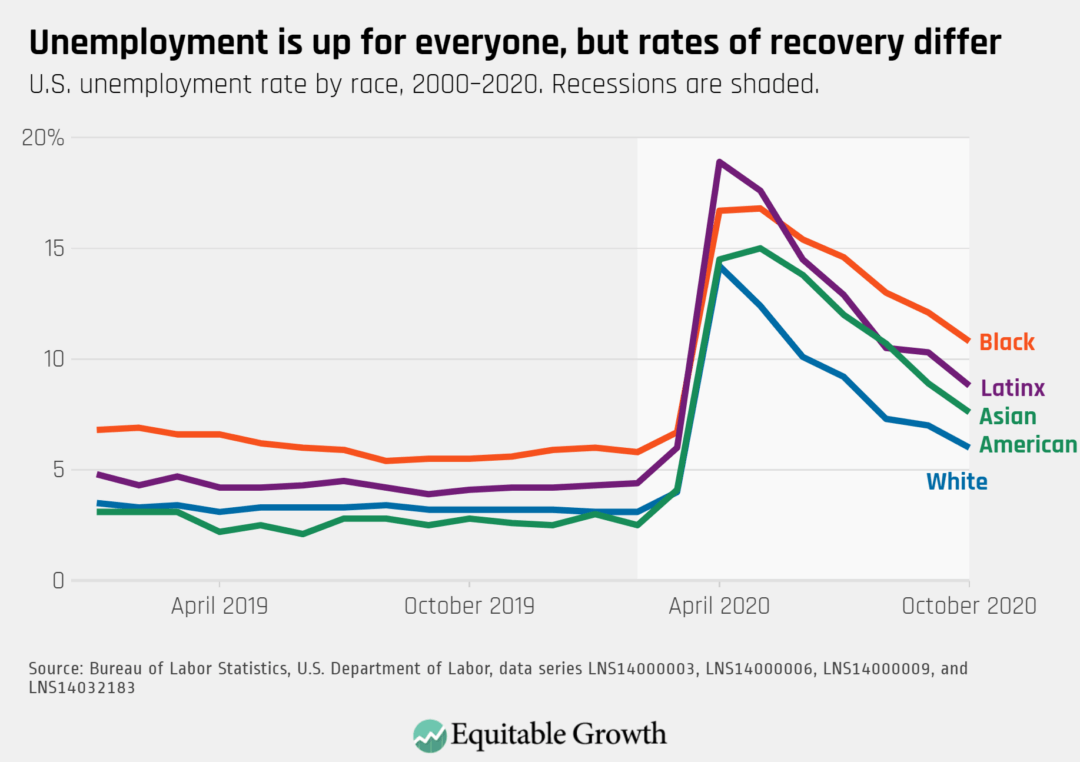
The unemployment rate fell to 6.9 percent for all workers, but was significantly higher for Black workers at 10.8 percent. The uncontrolled pandemic, occupational segregation, and labor market discrimination limit the ability of Black unemployment rates to recover and converge with other demographic groups.
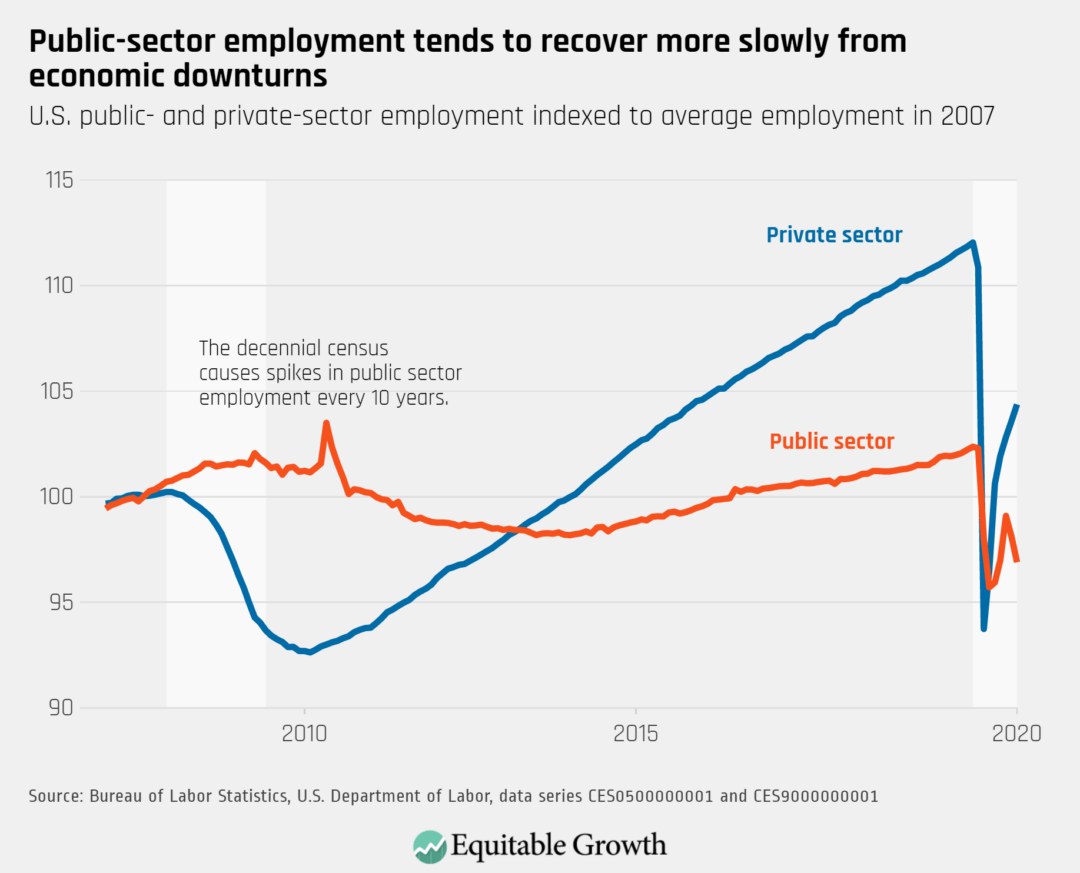
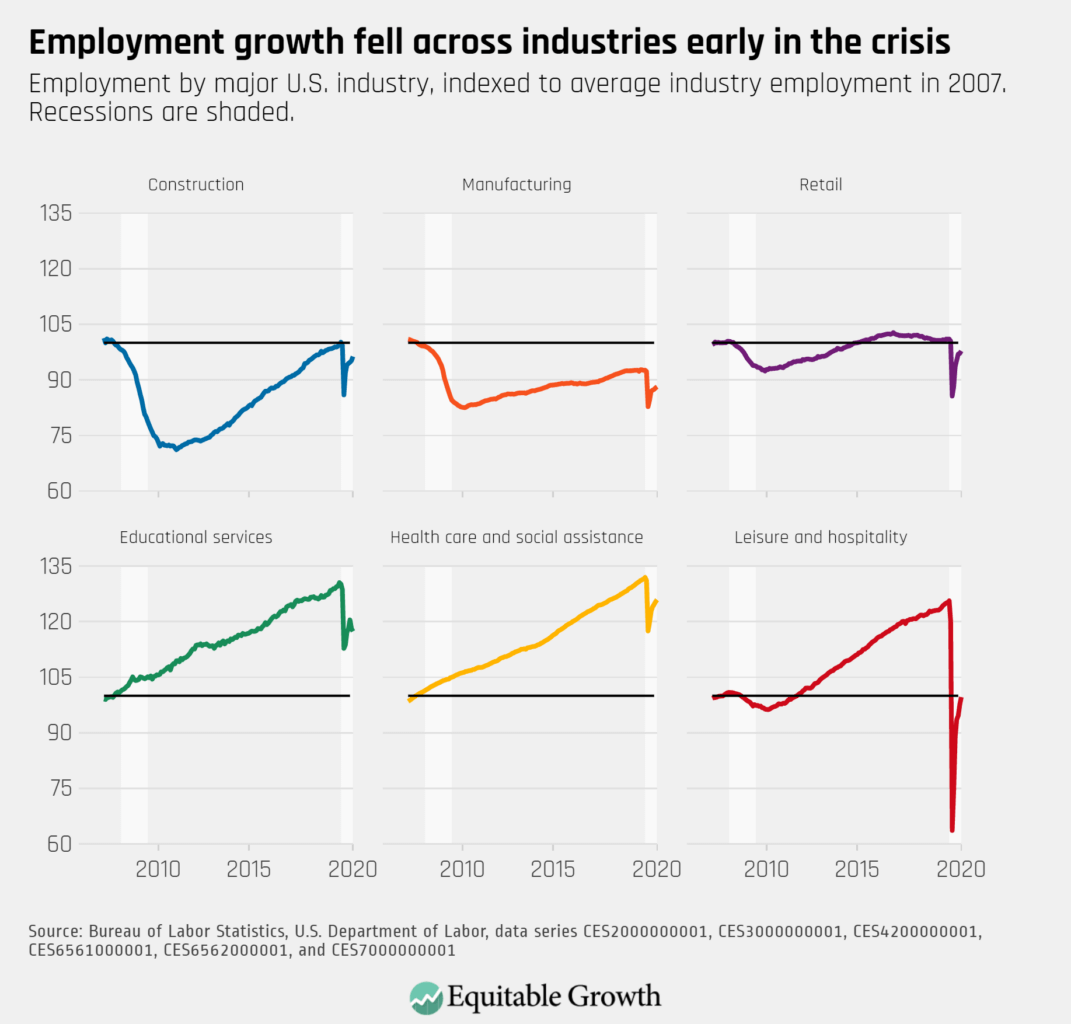
Employment growth continues to improve across the private sector, but layoffs from the end of the 2020 Census and job losses in local and state government education offset employment recovery.
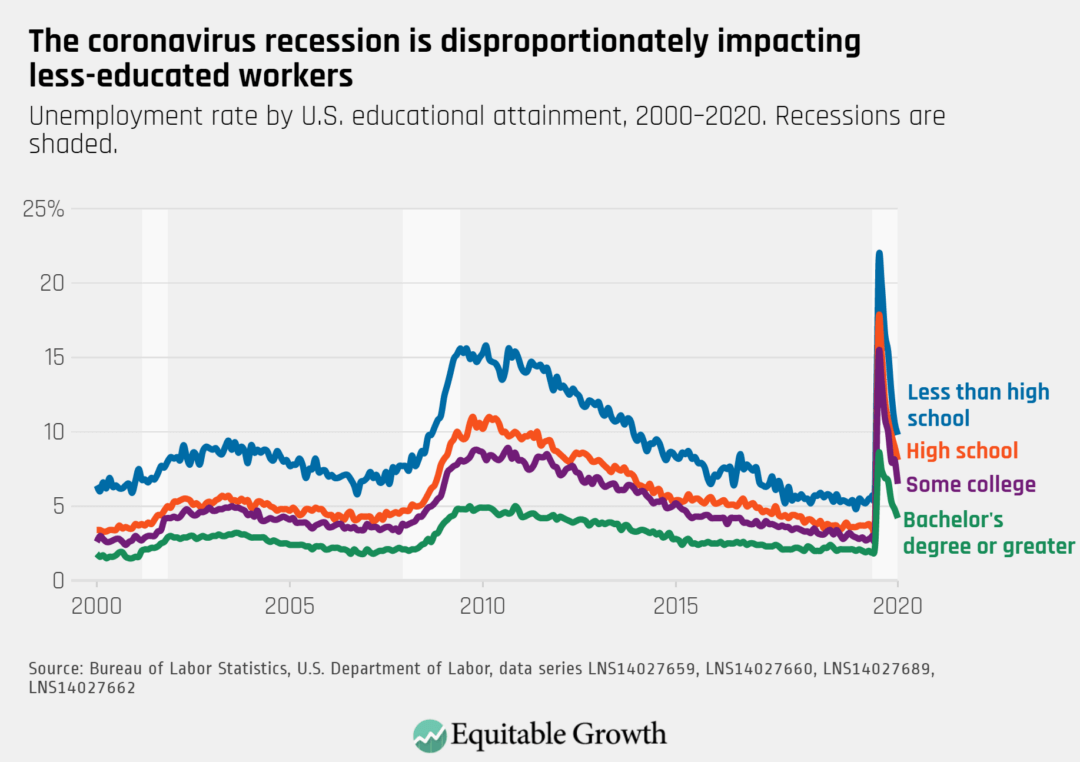
Unemployment rates continue to be significantly higher for workers with less than a college degree, who are less likely to be able to telework.
Public-sector employment declined in October, due to 147,000 Census layoffs and 159,000 job losses in education, disproportionately impacting women workers who are overrepresented in the education sector.