JOLTS Day Graphs: October 2020 Edition

Every month the U.S. Bureau of Labor Statistics releases data on hiring, firing, and other labor market flows from the Job Openings and Labor Turnover Survey, better known as JOLTS. Today, the BLS released the latest data for October 2020. This report doesn’t get as much attention as the monthly Employment Situation Report, but it contains useful information about the state of the U.S. labor market. Below are a few key graphs using data from the report.

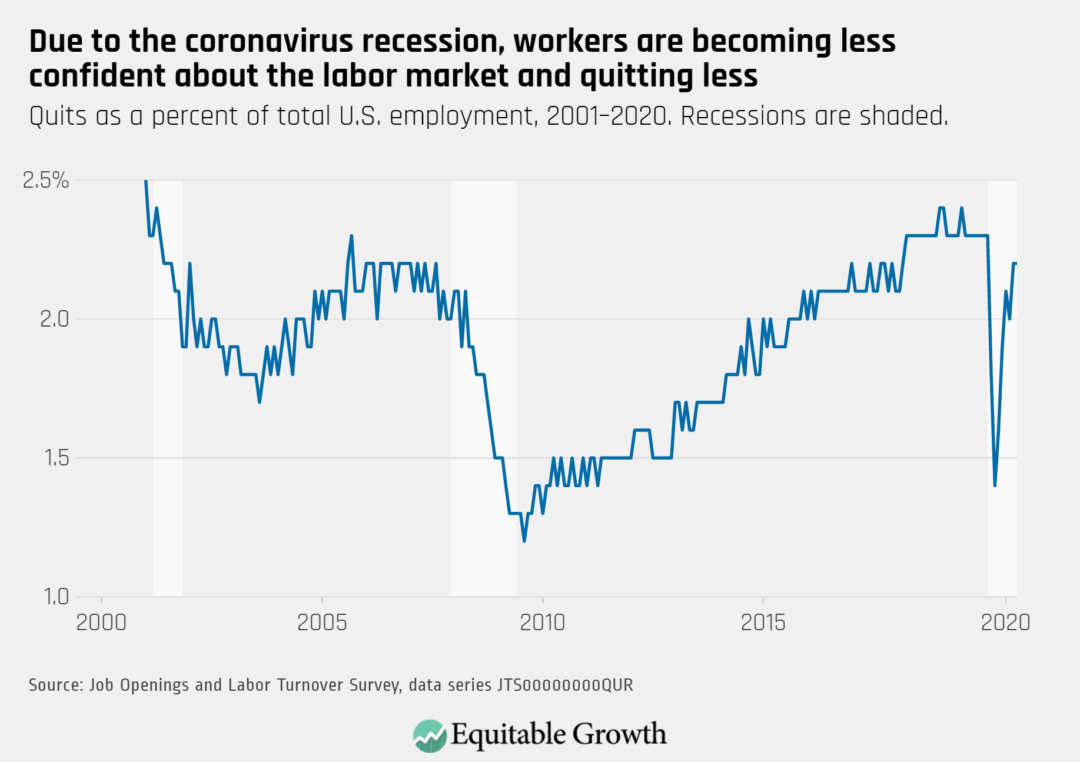
The quits rate was unchanged at 2.2% for October, nearly the same level as it was in October 2019, prior to the pandemic.

Quits as a percent of total U.S. employment , 2001–2020

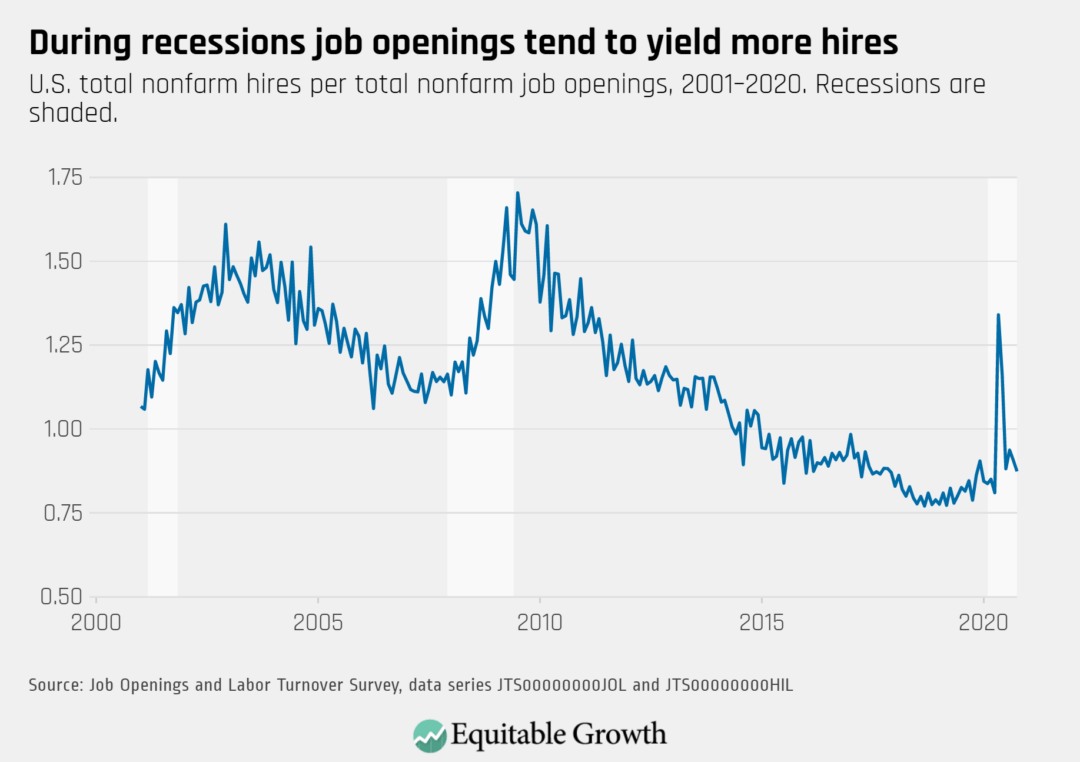
With hires decreasing by 74,000 and job openings increasing by 160,000, the vacancy yield decreased slightly in October.

U.S. total nonfarm hires per total nonfarm job openings, 2001–2020

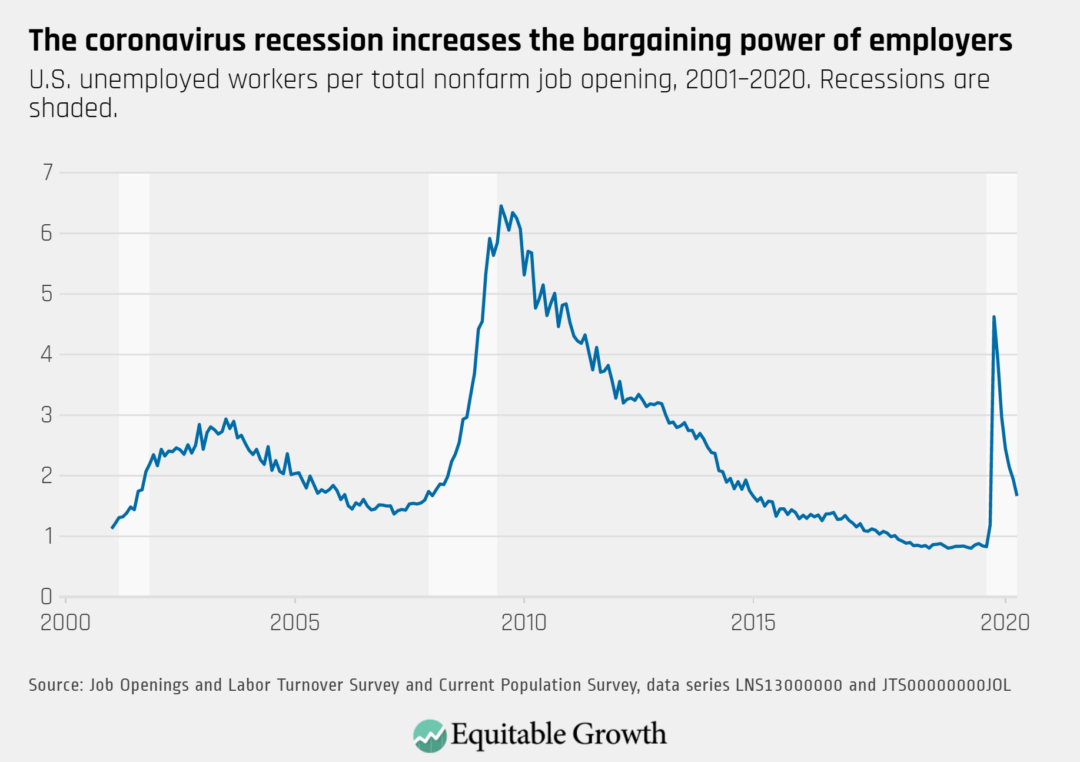
The ratio of unemployed workers to job openings continued to decrease as the unemployment rate declined and the openings rate increased slightly. But, at the same time, 4.2 million workers left the labor force in October.

U.S. unemployed workers per total nonfarm job opening, 2001–2020

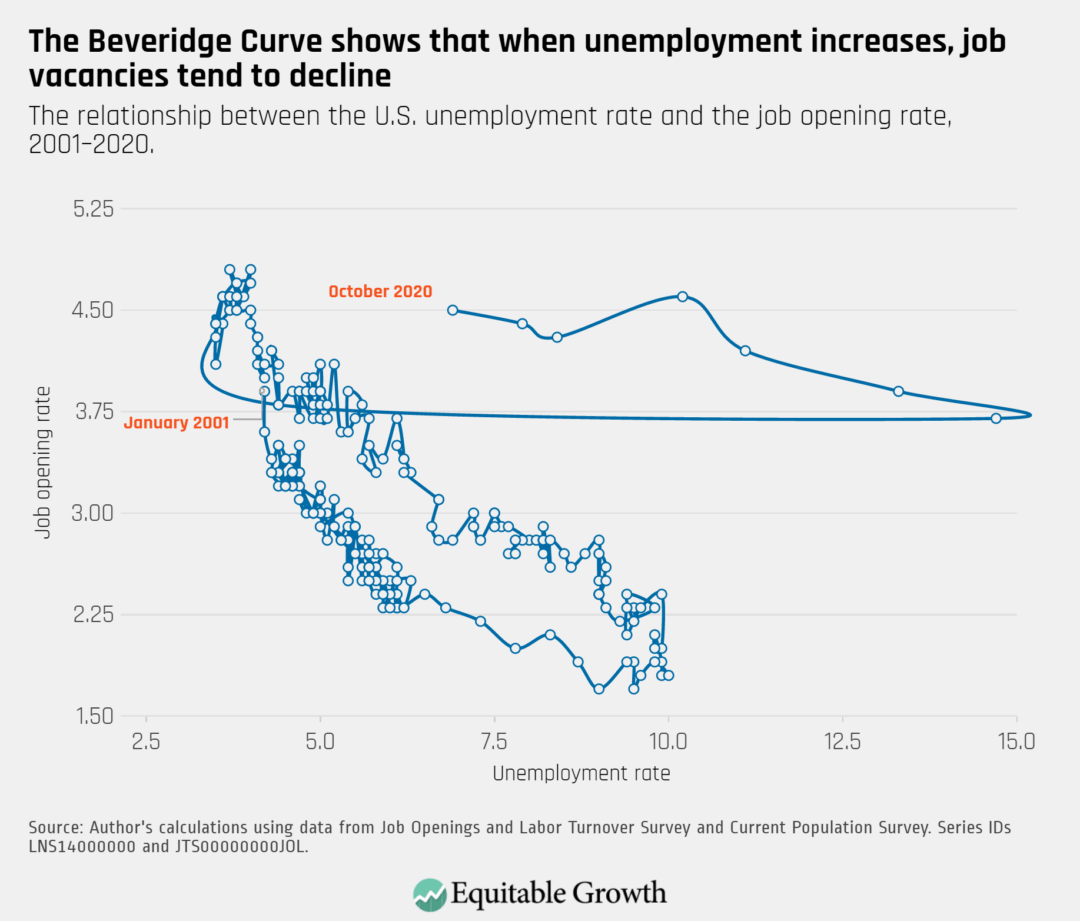
The Beveridge Curve continued to move toward typical territory, but still reflects a distorted relationship between job openings and unemployment in the Coronavirus Recession.

The relationship between the U.S. unemployment rate and the job opening rate, 2001–2020
Connect with us!

Explore the Equitable Growth network of experts around the country and get answers to today's most pressing questions!

Get in Touch