JOLTS Day Graphs: June 2021 Edition

Every month the U.S. Bureau of Labor Statistics releases data on hiring, firing, and other labor market flows from the Job Openings and Labor Turnover Survey, better known as JOLTS. Today, the BLS released the latest data for June 2021. This report doesn’t get as much attention as the monthly Employment Situation Report, but it contains useful information about the state of the U.S. labor market. Below are a few key graphs using data from the report.

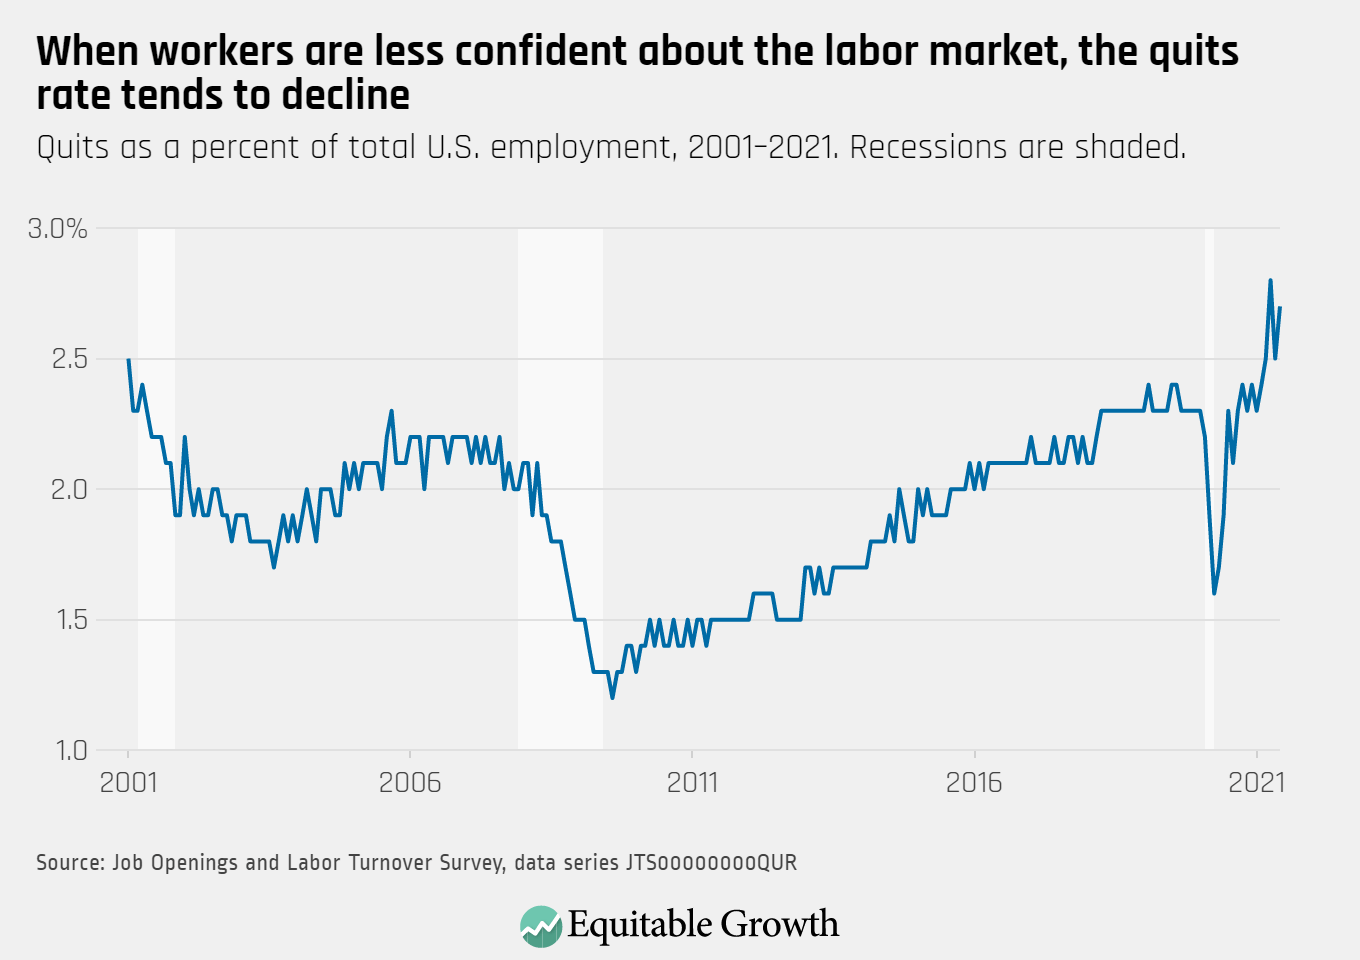
The quits rate rose to 2.7 percent in June as 3.9 million workers quit their jobs.

Quits as a percent of total U.S. employment, 2001-2021. Recessions are shaded.

The vacancy yield increased slightly in June but remained low, as job openings reached a series high of 10.1 million and hires rose to 6.7 million.

U.S. total nonfarm hires per total nonfarm job openings, 2001-2021. Recessions are shaded.

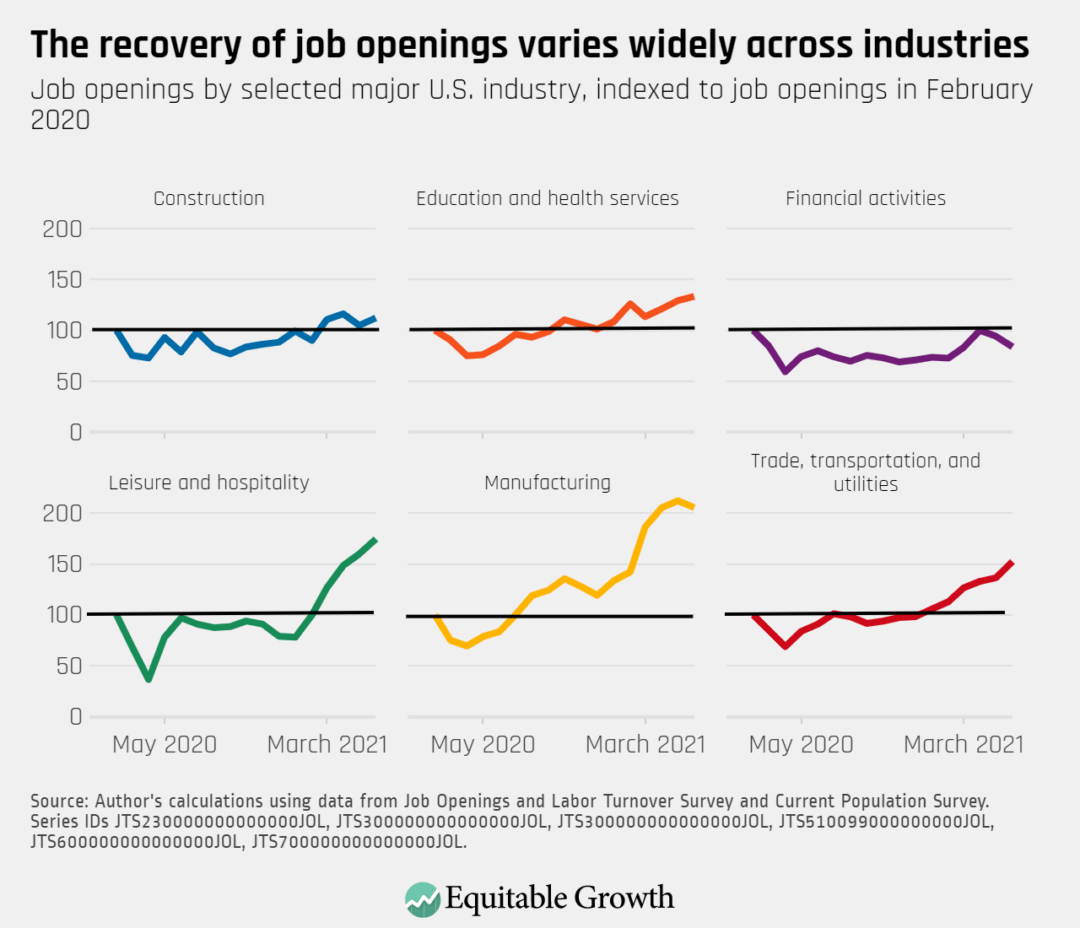
The job openings rate increased to 6.5 percent in June, with job openings remaining particularly elevated for the manufacturing industry and for leisure and hospitality, but low for the financial activities sector.

Job openings by selected major U.S. industry, indexed to job openings in February 2020

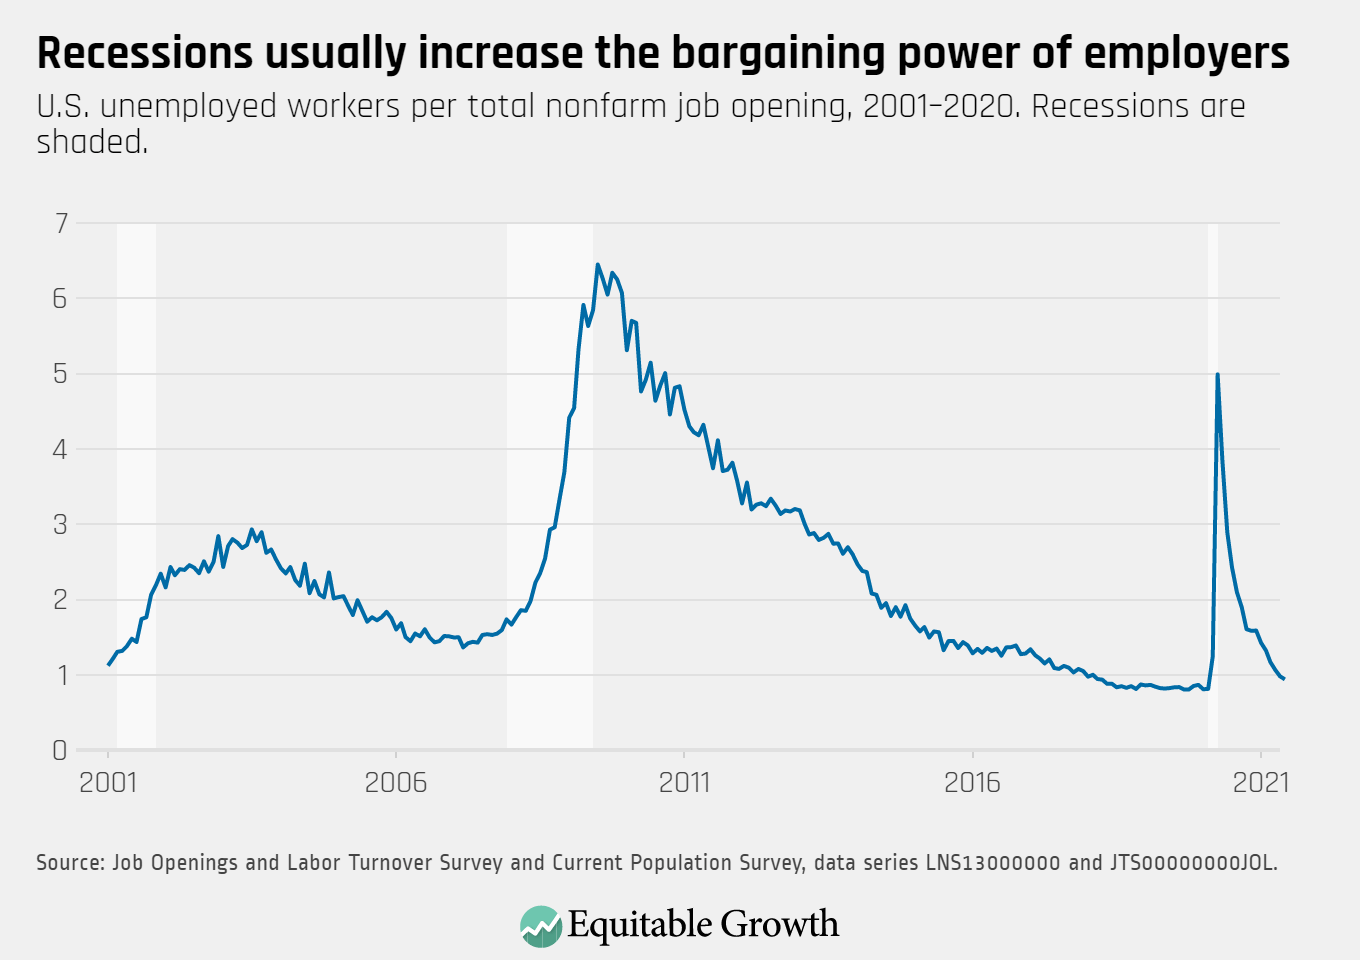
The ratio of unemployed workers to job openings decreased to 0.9 in June, approaching pre-coronavirus recession levels.

U.S. unemployed workers per total nonfarm job opening, 2001-2020. Recessions are shaded.

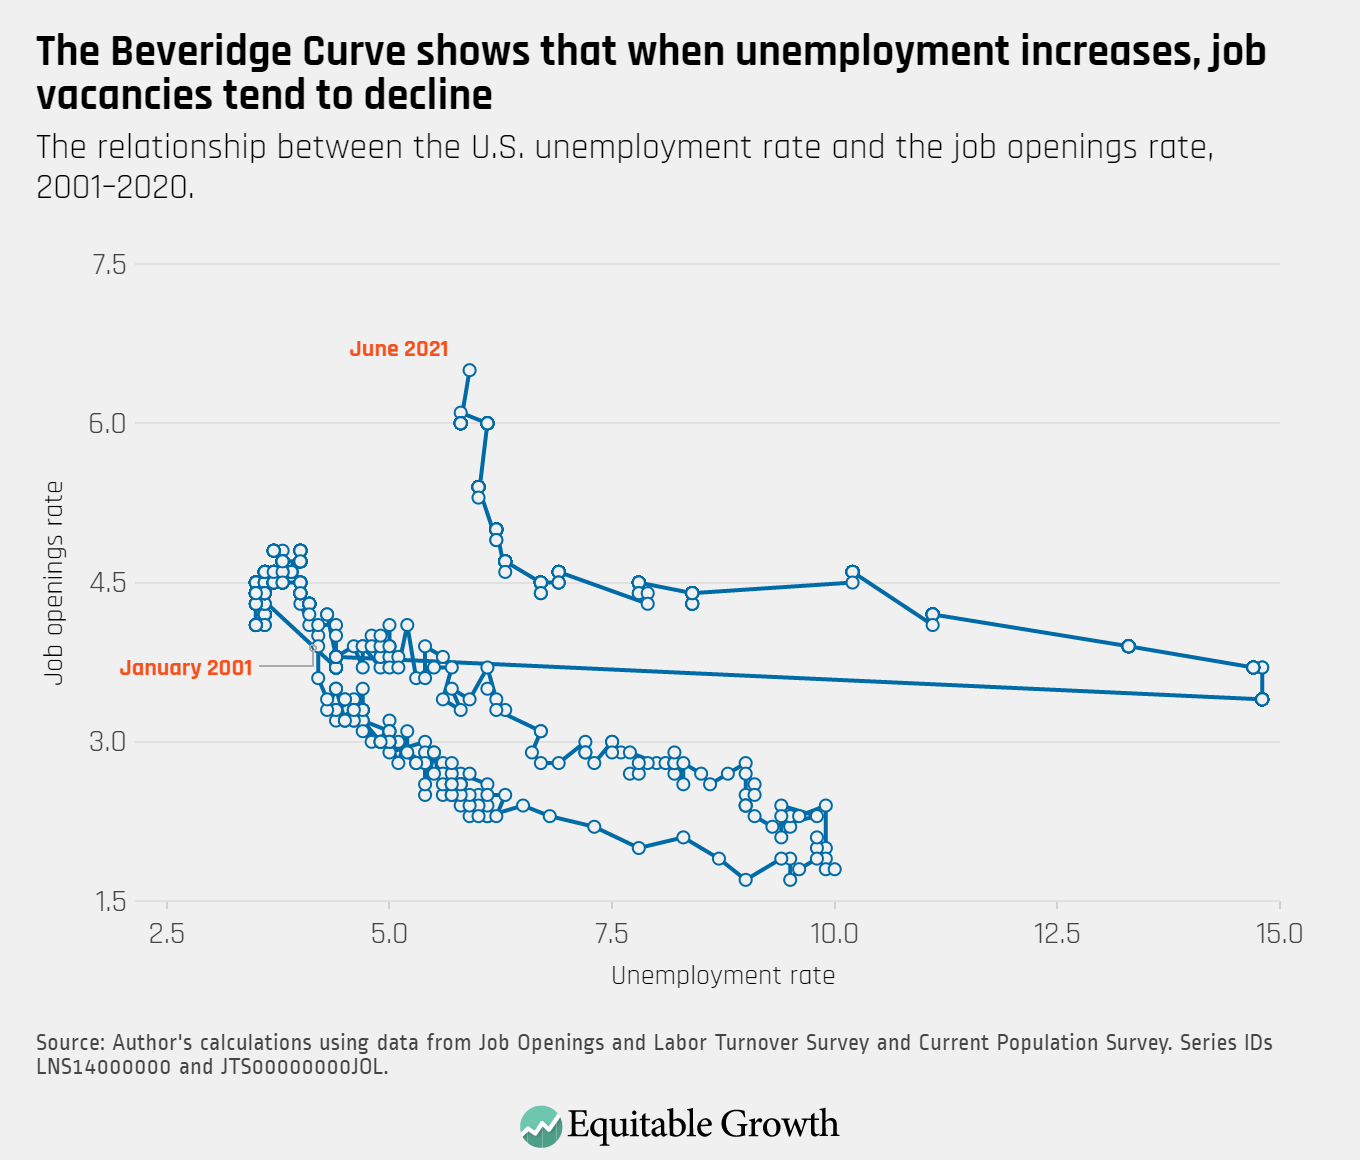
With a slight increase in the unemployment rate and the job openings rate rising to a series high, the Beveridge Curve continues to move in atypical territory, compared to previous business cycles.

The relationship between the U.S. unemployment rate and the job openings rate, 2001-2020
Connect with us!

Explore the Equitable Growth network of experts around the country and get answers to today's most pressing questions!

Get in Touch