JOLTS Day Graphs: July 2021 Edition

Every month the U.S. Bureau of Labor Statistics releases data on hiring, firing, and other labor market flows from the Job Openings and Labor Turnover Survey, better known as JOLTS. Today, the BLS released the latest data for July 2021. This report doesn’t get as much attention as the monthly Employment Situation Report, but it contains useful information about the state of the U.S. labor market. Below are a few key graphs using data from the report.

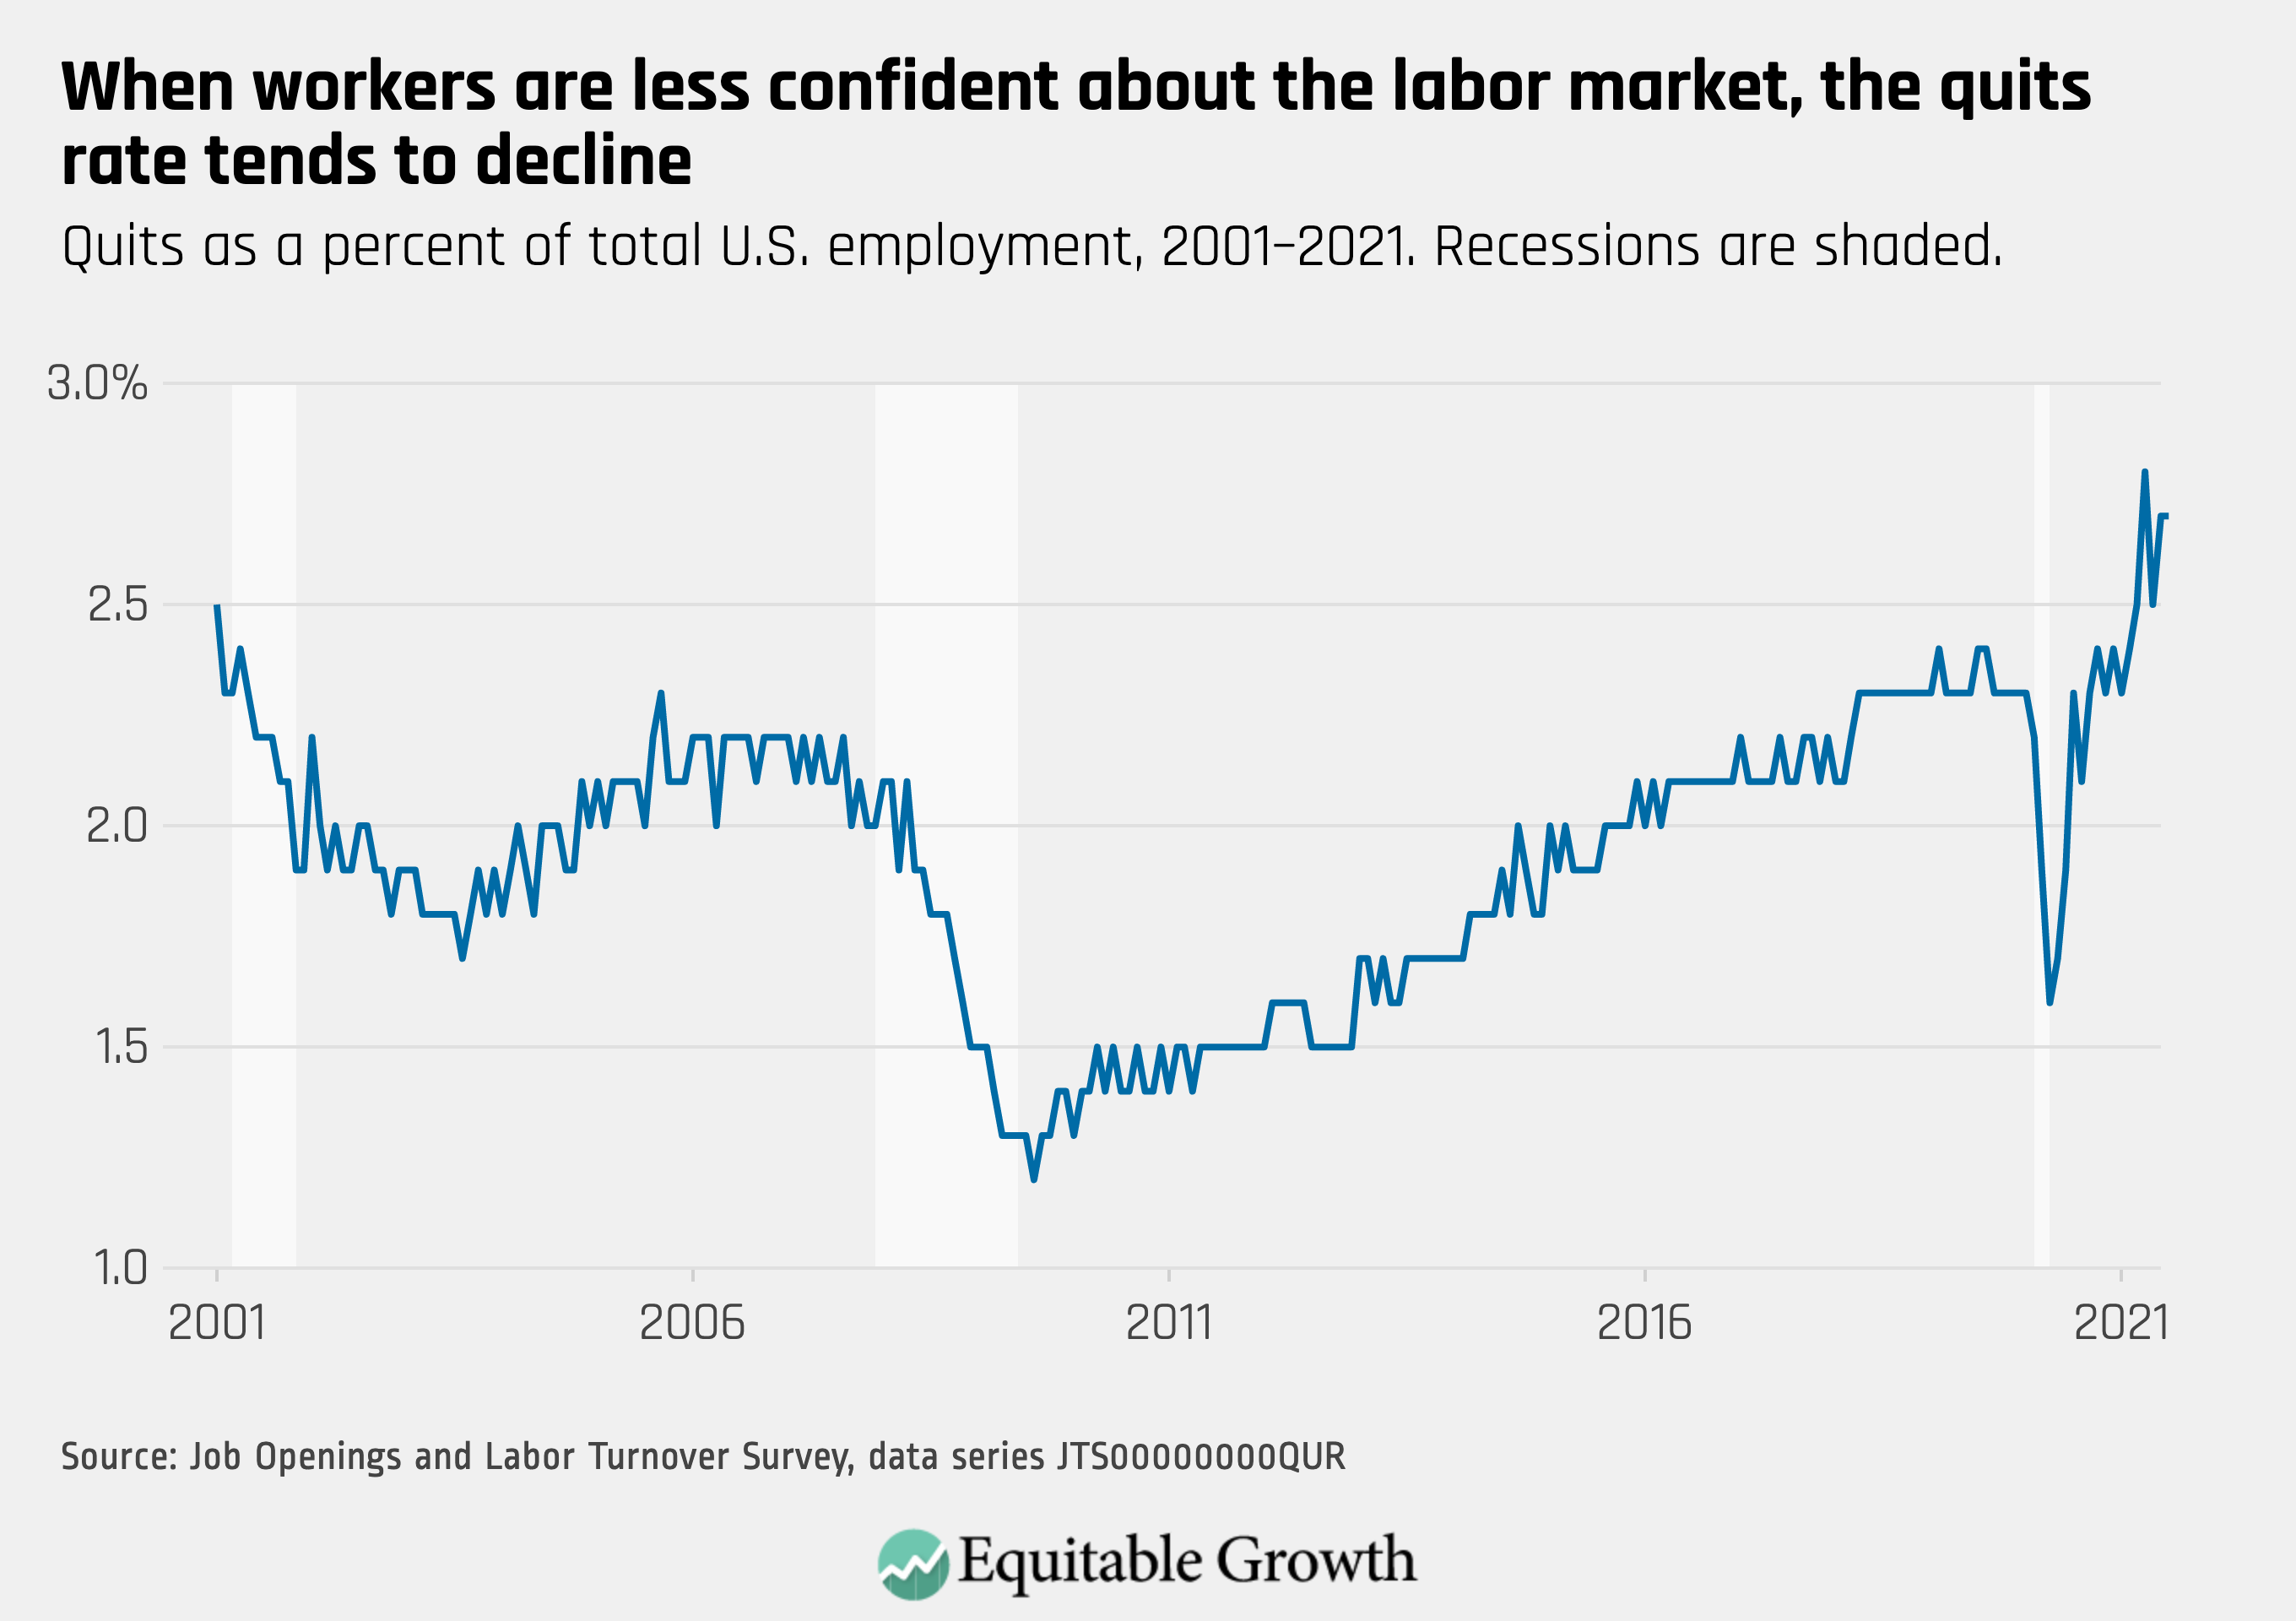
The quits rate remained relatively steady at 2.7 percent as 4 million workers quit their jobs in July, while the job openings rate increased to 6.9 percent.

Quits as a percent of total U.S. employment, 2001–2021

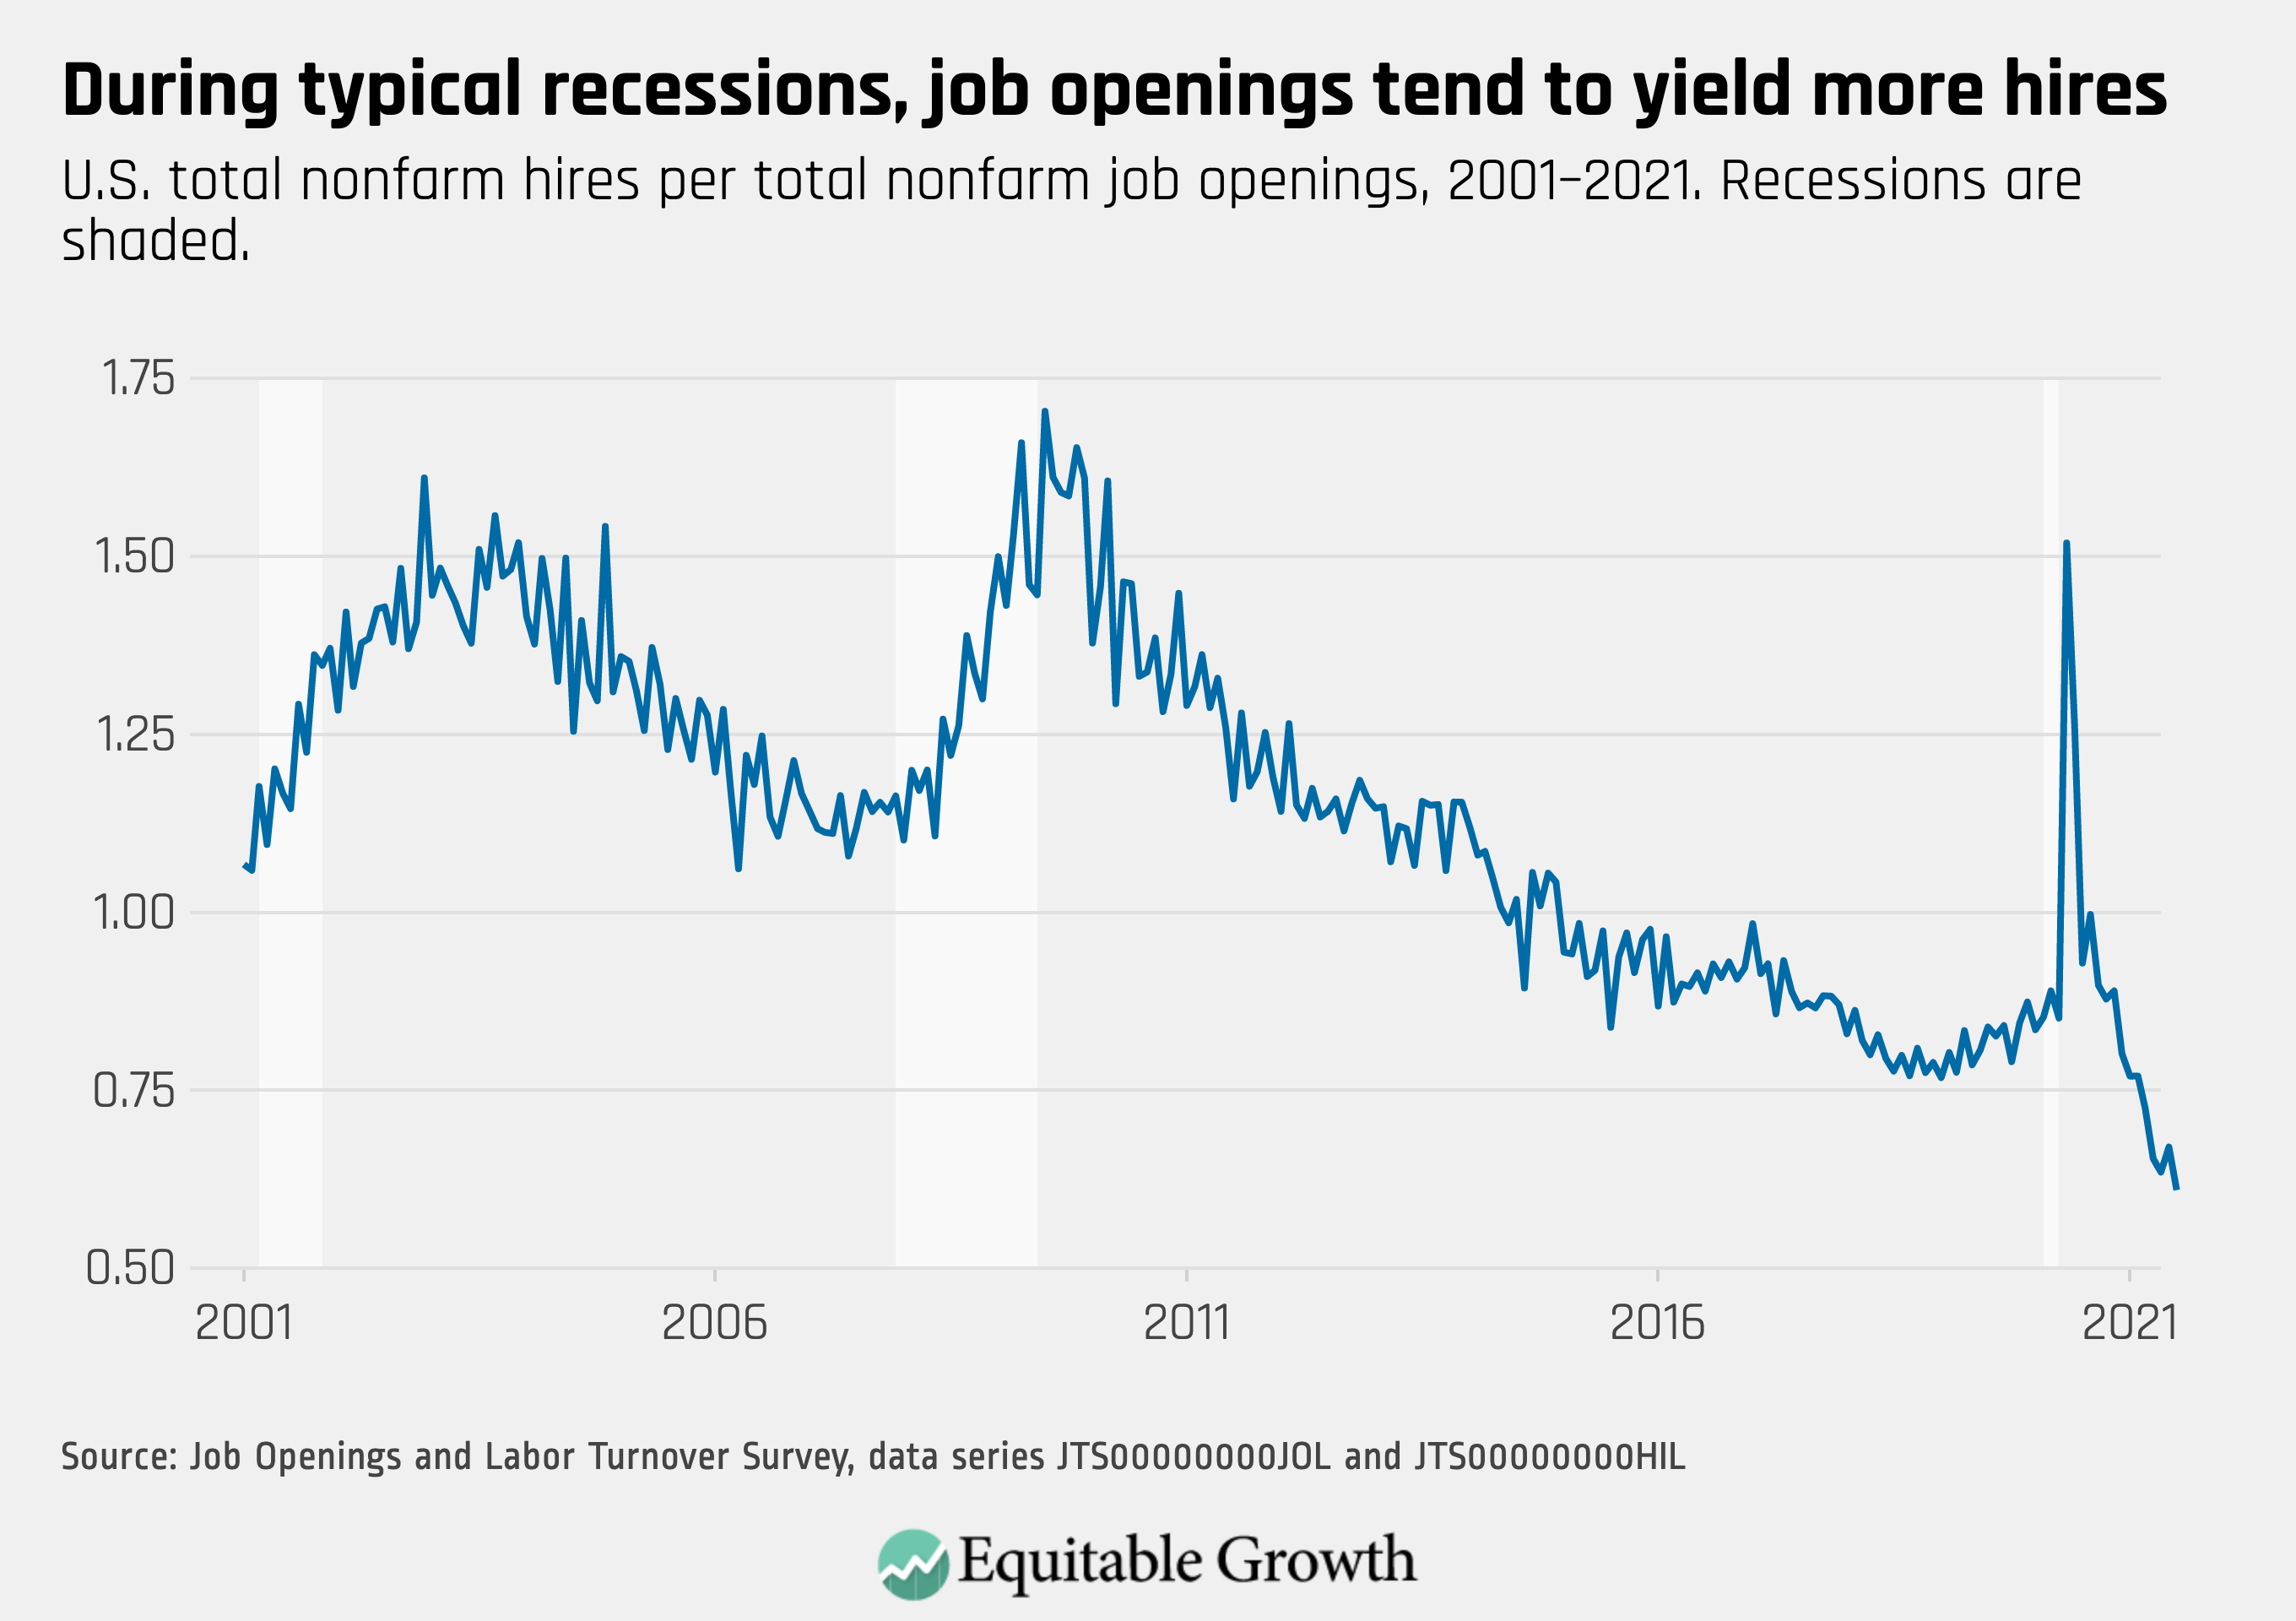
The vacancy yield declined in July as job openings reached a series high of 10.9 million while hires, at 6.7 million, were little changed.

U.S. total nonfarm hires per total nonfarm job openings, 2001–2021

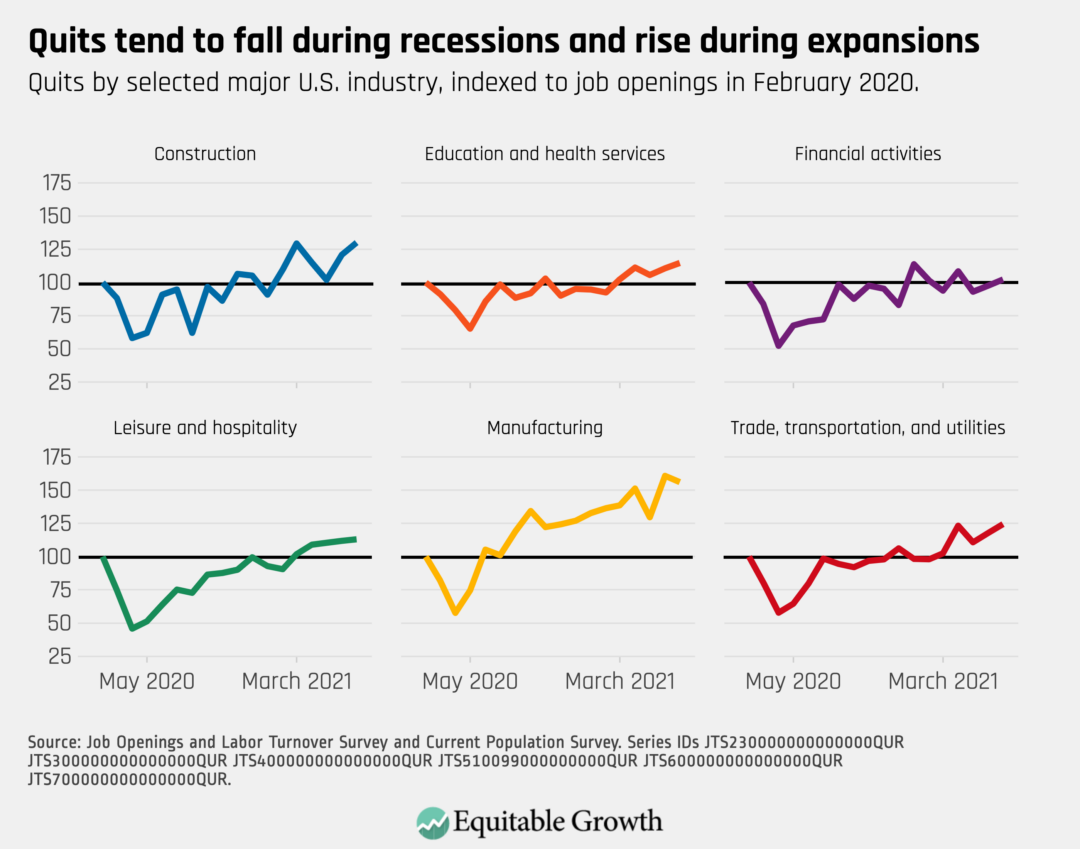
The quits rate remained elevated in July, and increased in areas such as state and local government education, construction, and wholesale trade.

Quits by selected major U.S. industry, indexed to job openings in February 2020

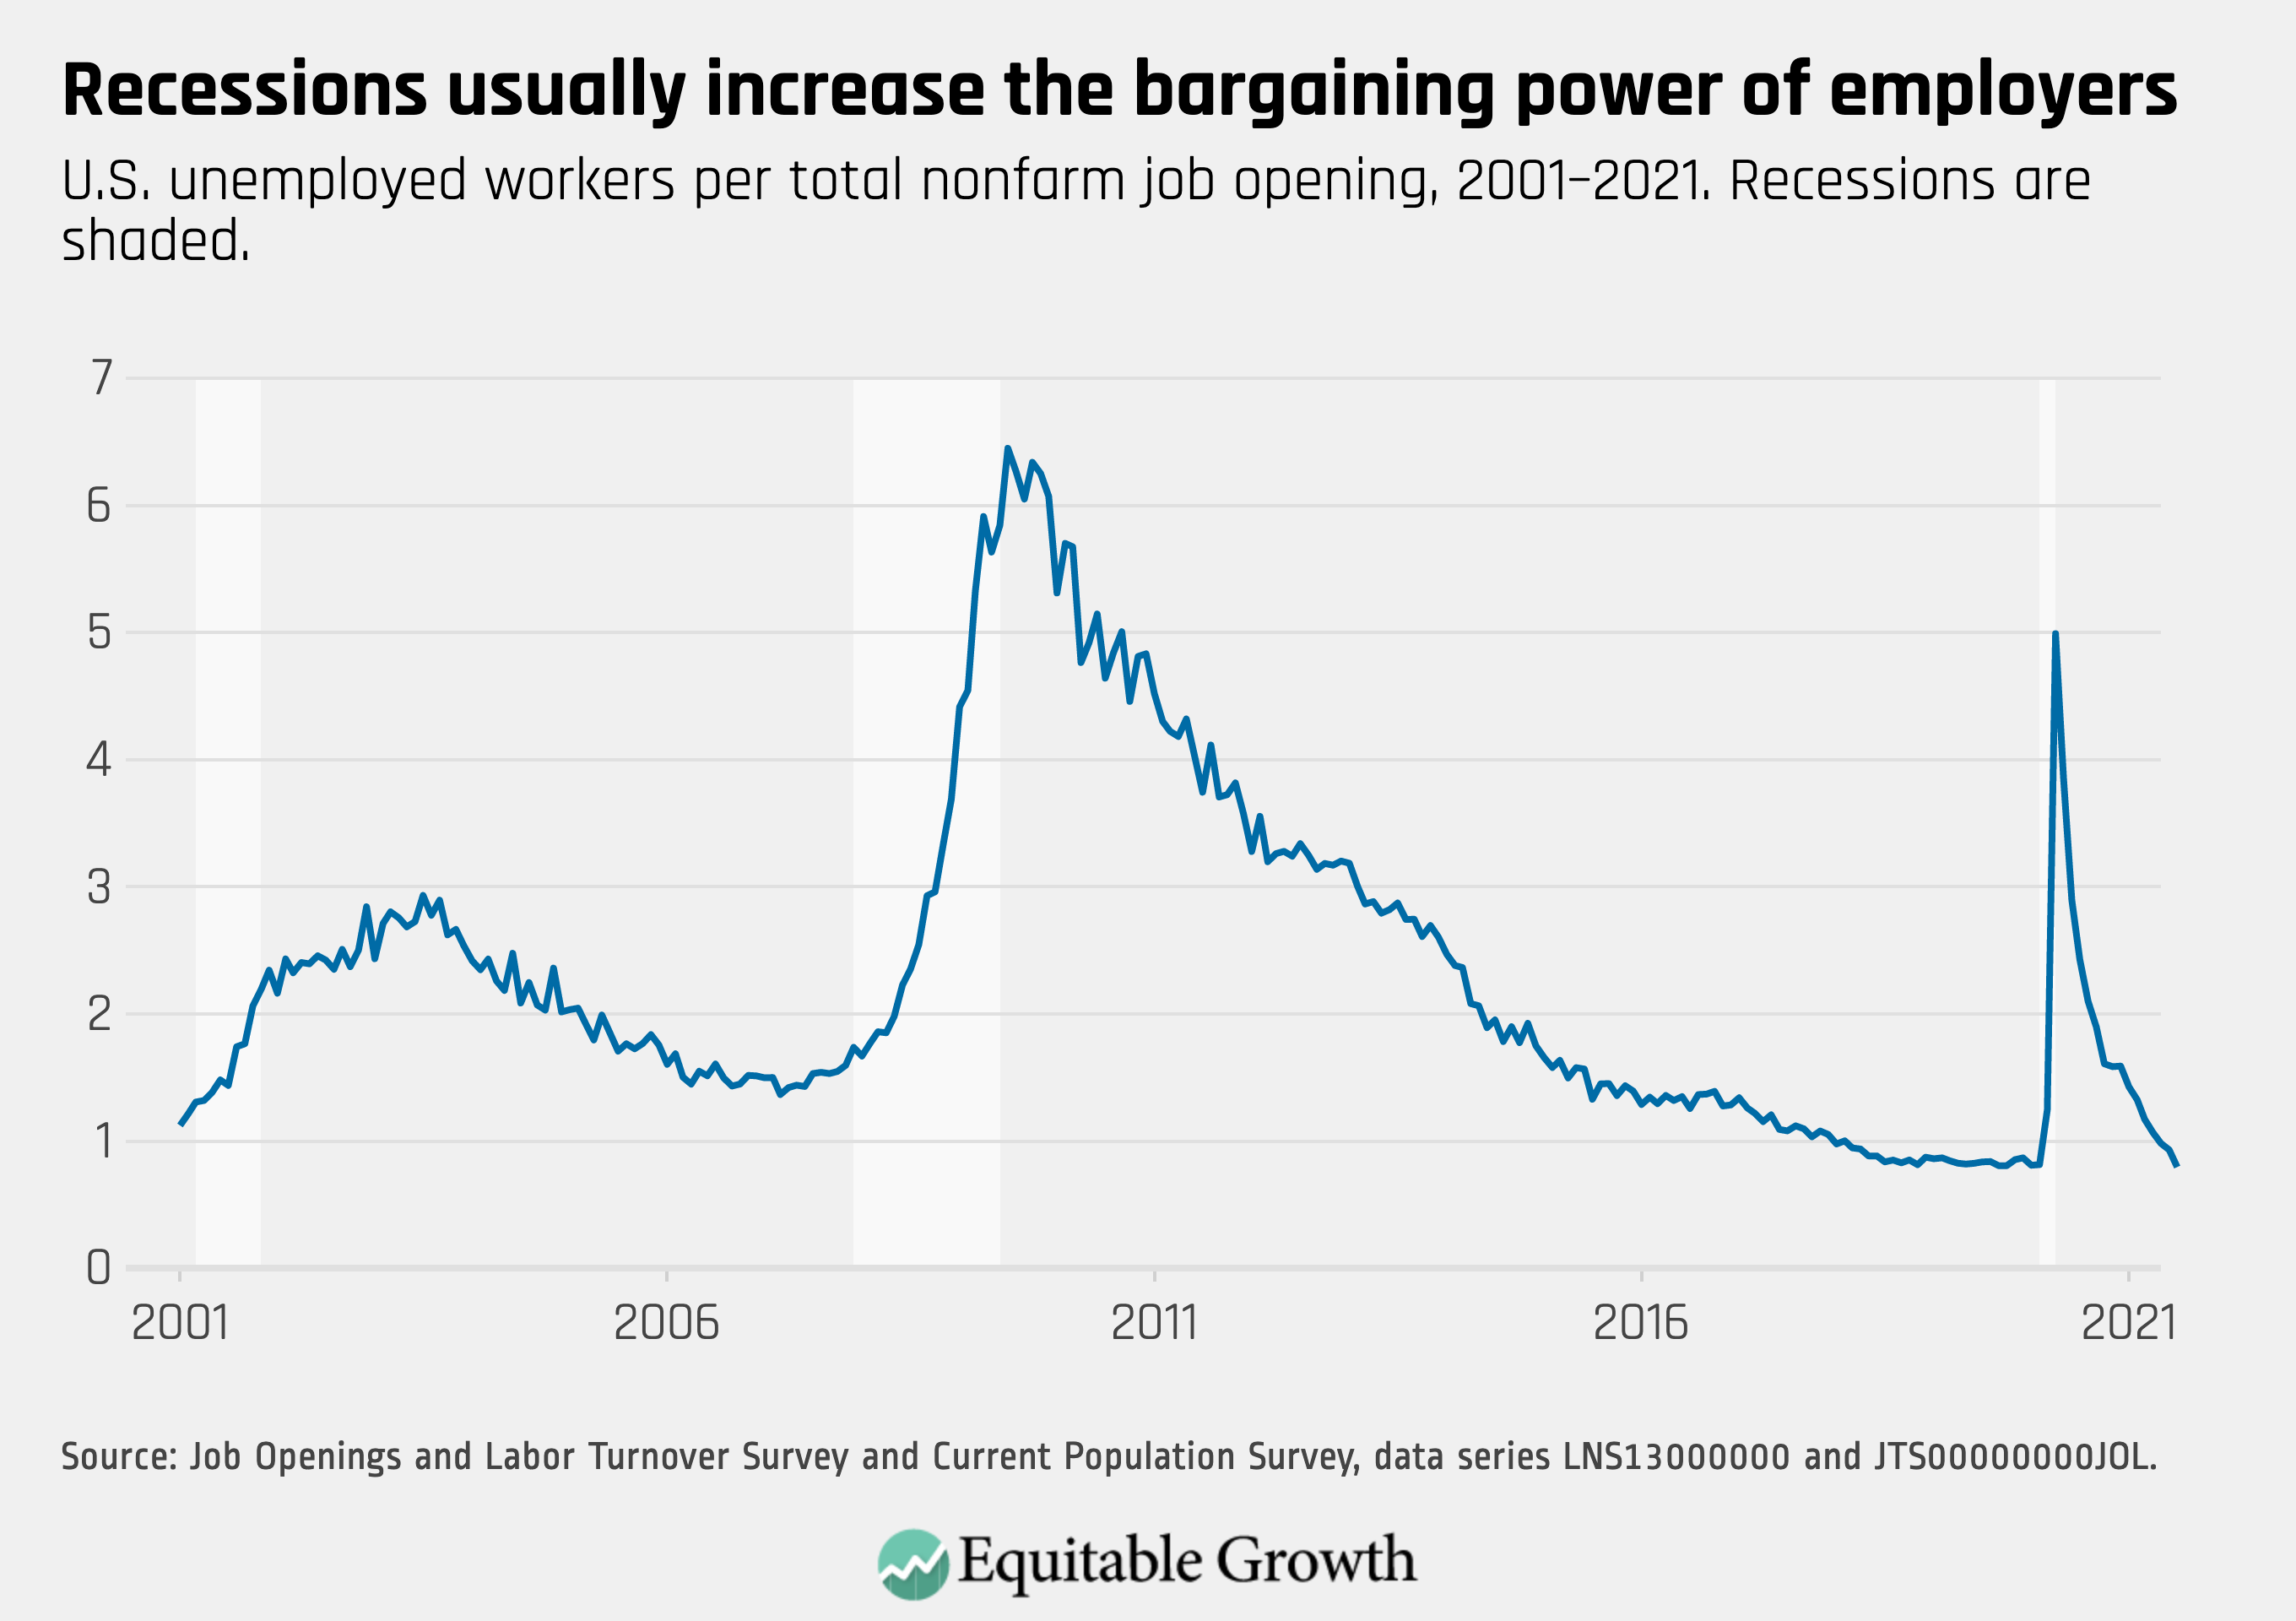
The ratio of unemployed worker per job opening fell to below 0.8 in July, similar to the low levels previously seen immediately before the coronavirus recession.

U.S. unemployed workers per total nonfarm job opening, 2001–2021.

The Beveridge Curve continues to be in an atypical range, compared to previous business cycles, remaining elevated in July as the unemployment rate fell while the job openings rate increased.

The relationship between the U.S. unemployment rate and the job opening rate, 2001–2021
Connect with us!

Explore the Equitable Growth network of experts around the country and get answers to today's most pressing questions!

Get in Touch