JOLTS Day Graphs: February 2021 Edition

Every month the U.S. Bureau of Labor Statistics releases data on hiring, firing, and other labor market flows from the Job Openings and Labor Turnover Survey, better known as JOLTS. Today, the BLS released the latest data for February 2021. This report doesn’t get as much attention as the monthly Employment Situation Report, but it contains useful information about the state of the U.S. labor market. Below are a few key graphs using data from the report.

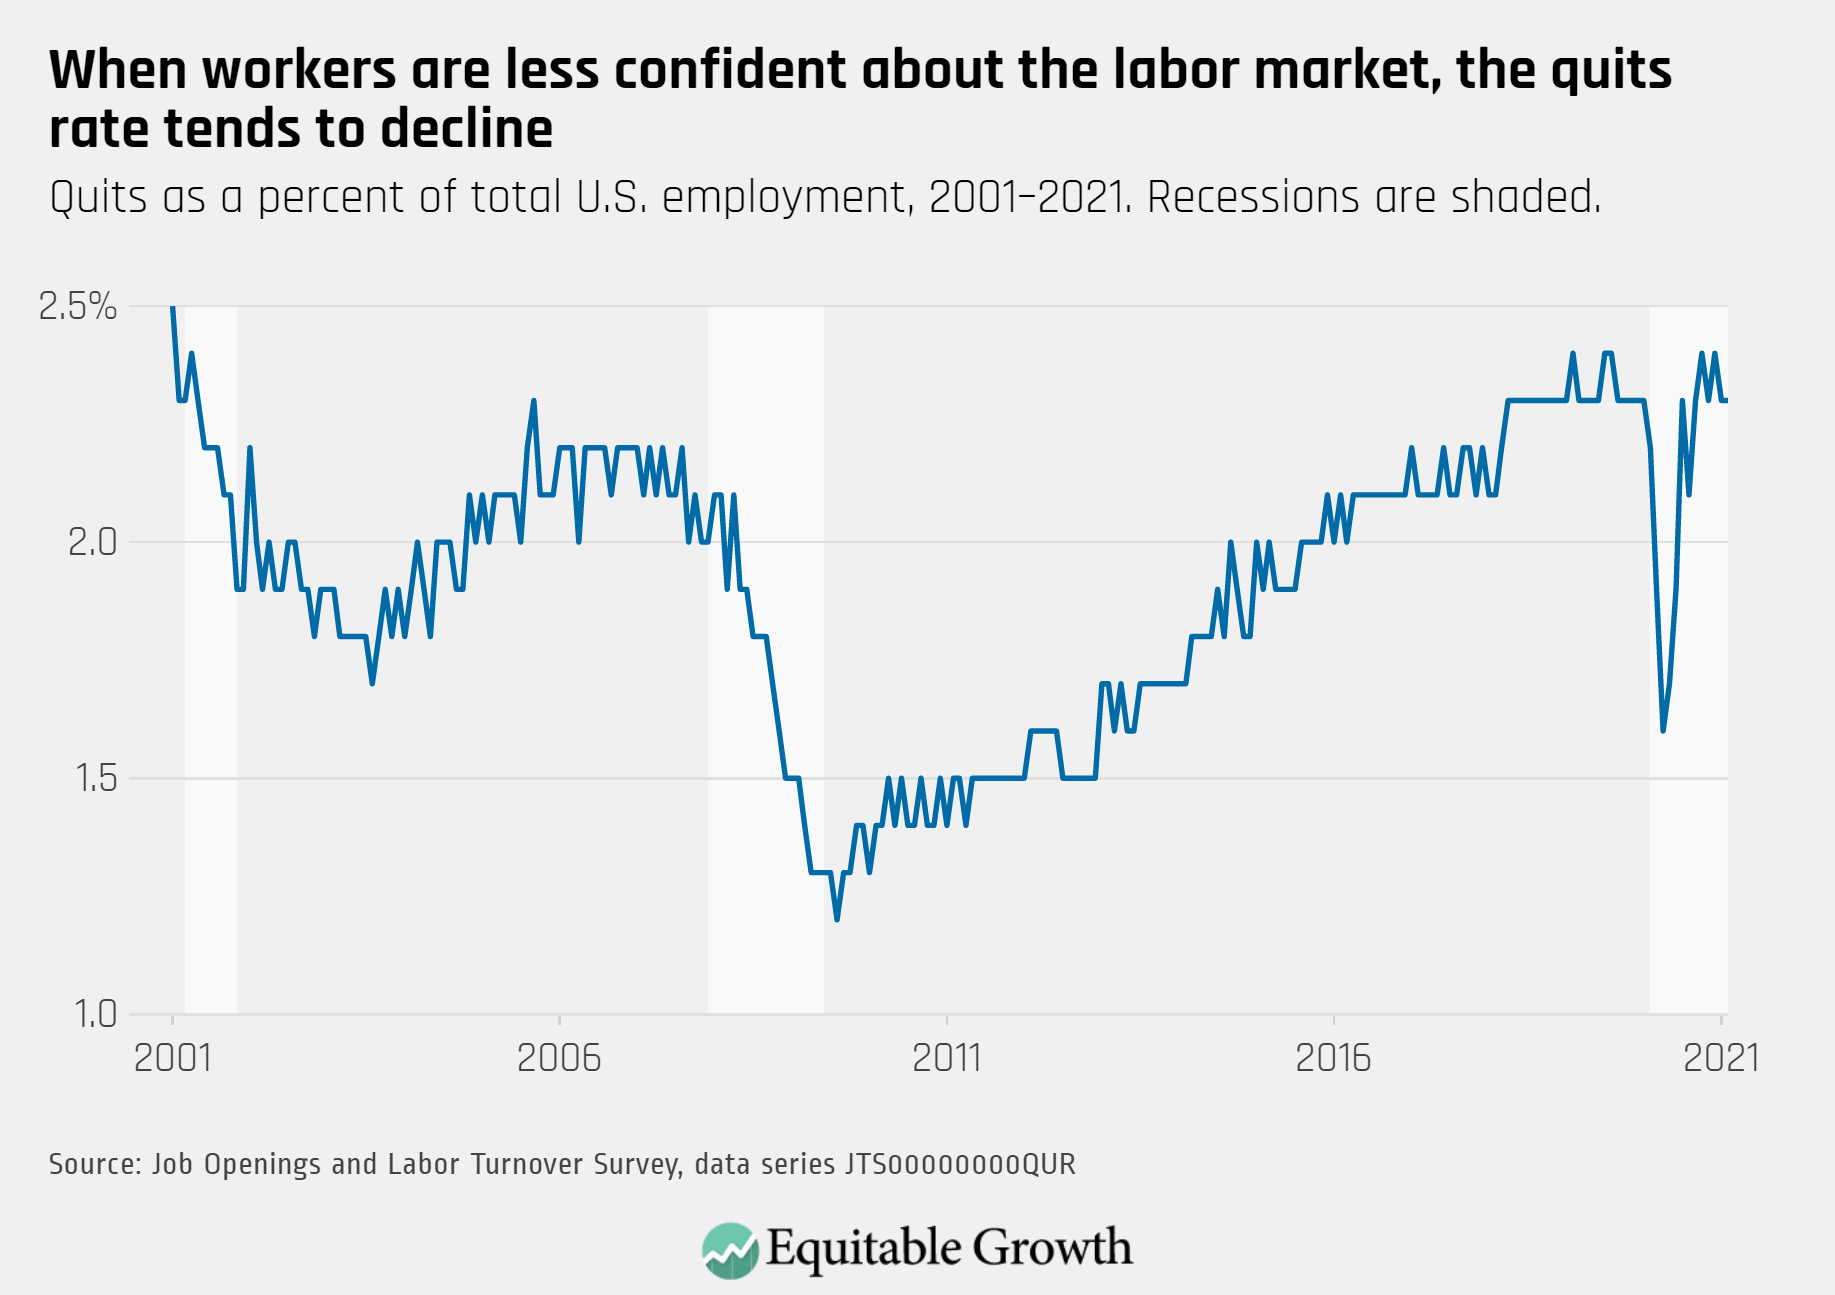
The quits rate remained near it’s pre-pandemic level at 2.3 percent in February.

Quits as a percent of total U.S. employment 2001-2021. Recessions are shaded.

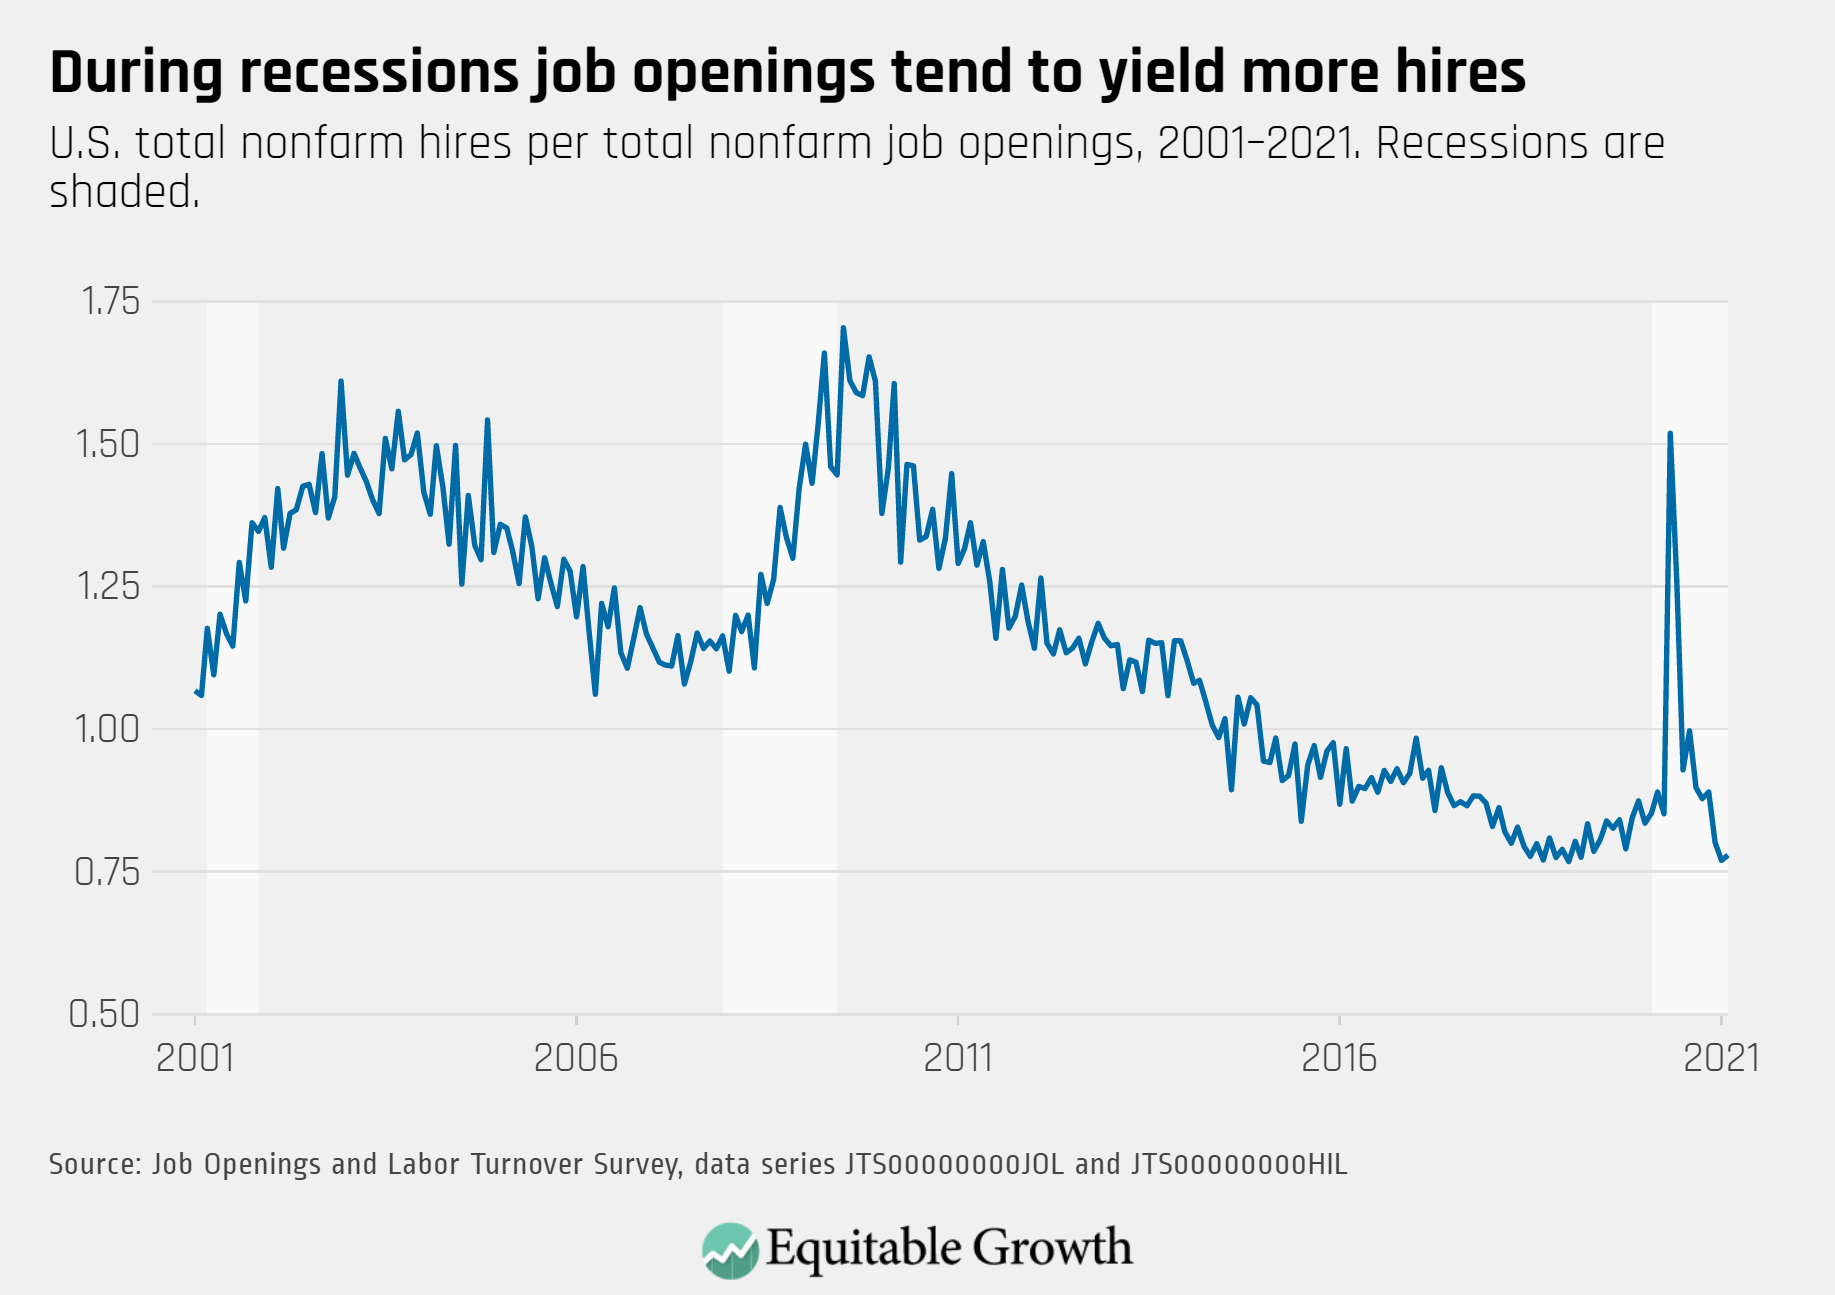
The vacancy yield for hires per job openings was 0.78 in February as the labor market continued to recover.

U.S. total nonfarm hires per total nonfarm job openings, 2001-2020. Recessions are shaded.

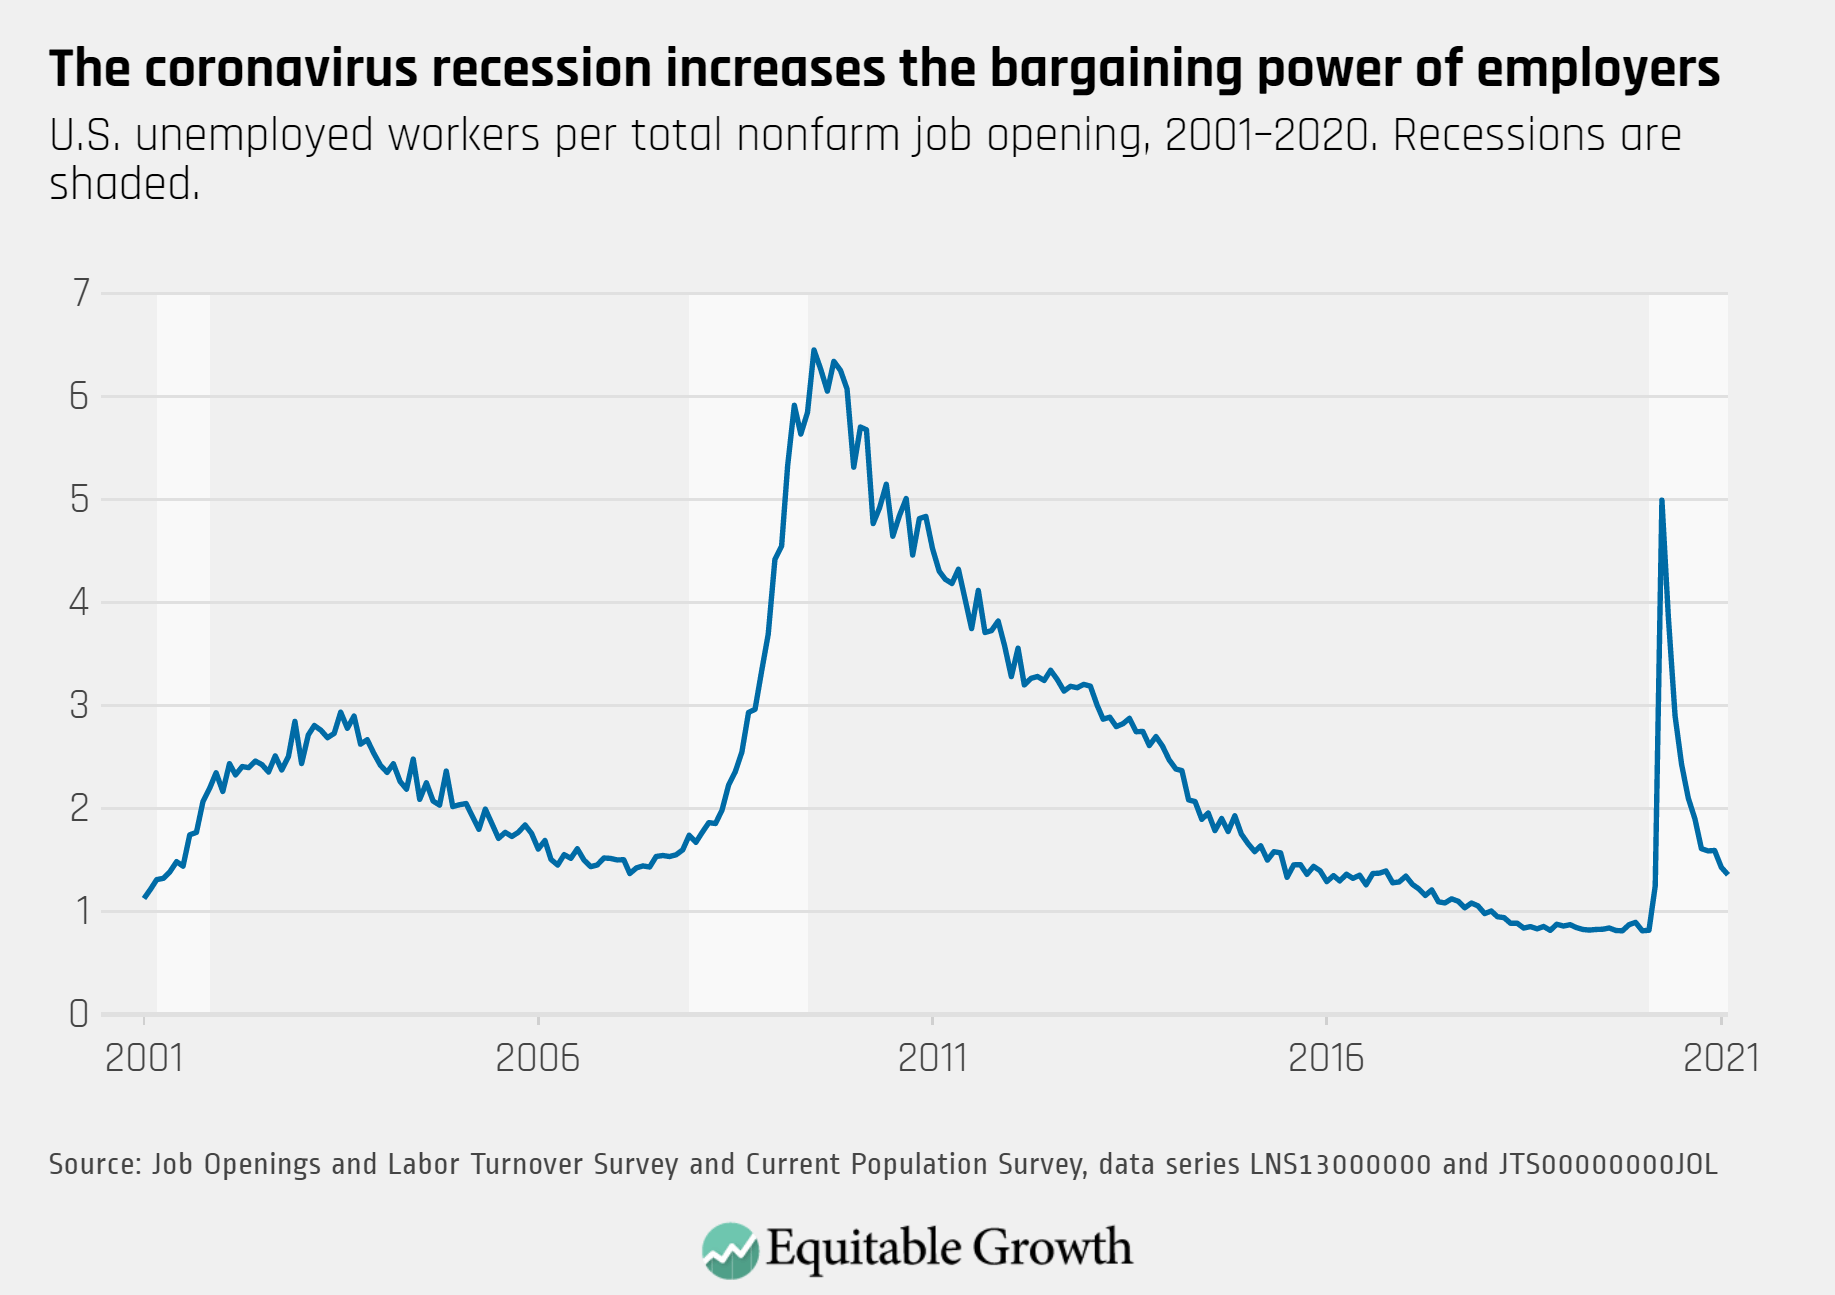
The job openings rate continued to increase to 4.9 percent while unemployment continued to decline to 6.2 percent, further decreasing the ratio of unemployed-worker-to-job-opening in February.

U.S. unemployed workers per total nonfarm job opening, 2001-2020. Recessions are shaded.

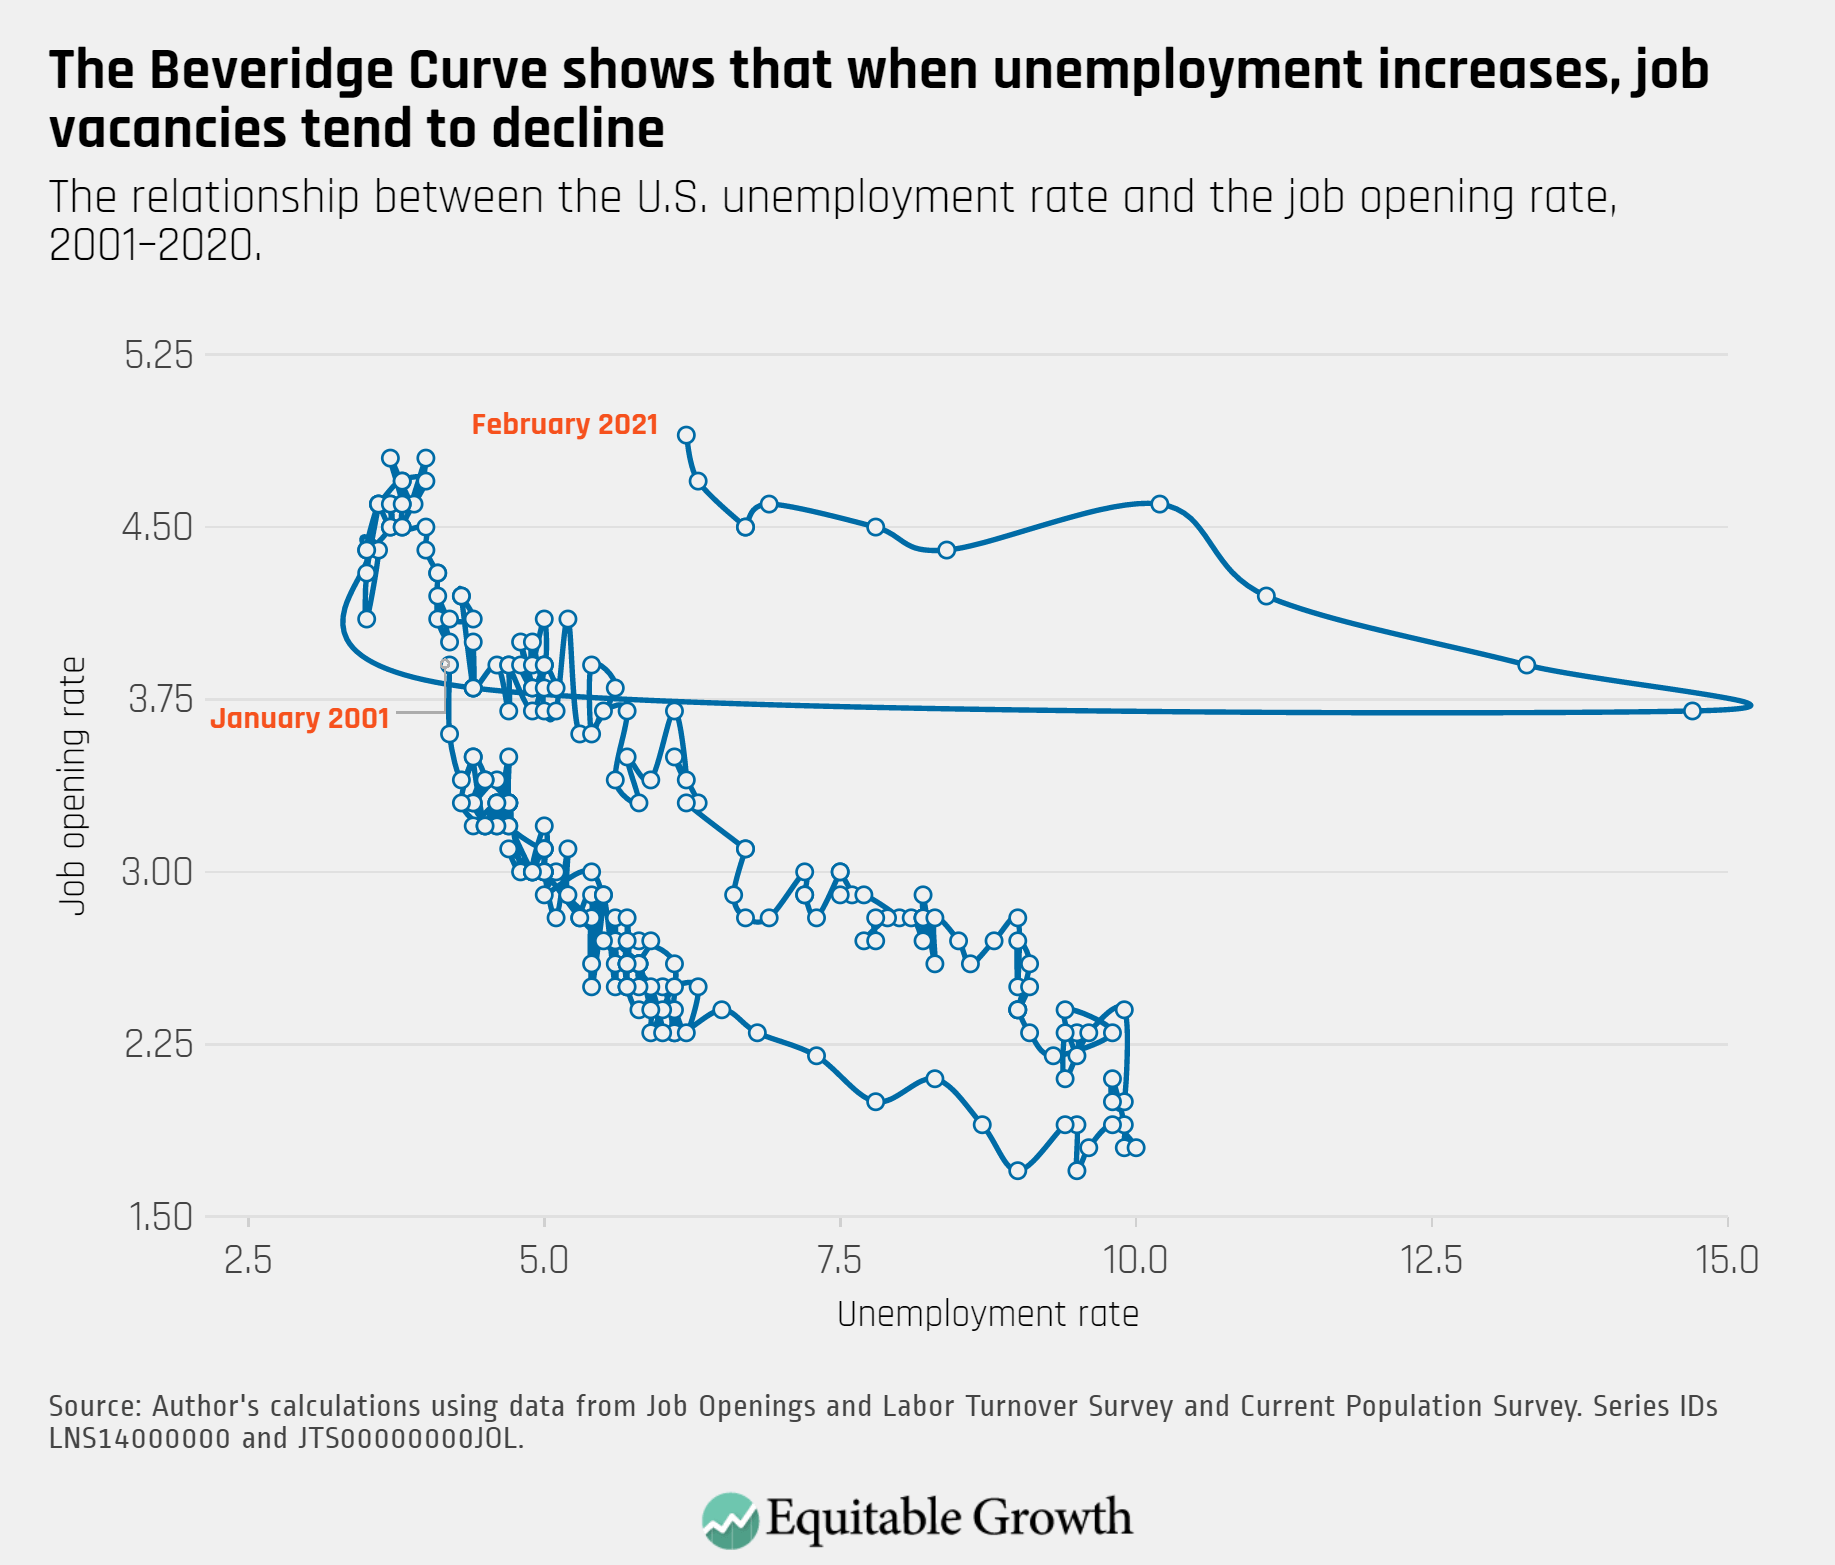
The Beveridge Curve moved upwards as job openings increased in February to levels typically seen at lower levels of unemployment.

The relationship between the U.S. unemployment rate and the job opening rate, 2001-2020.
Connect with us!

Explore the Equitable Growth network of experts around the country and get answers to today's most pressing questions!

Get in Touch