New research highlights the impact of COVID-era unconditional cash benefits for U.S. workers and families

""

The breadth of the economic impact of the COVID-19 pandemic ushered in sweeping, albeit temporary, changes to income support programs and tax policies in the United States. These changes include broadening and making more generous the Child Tax Credit—a move that, paired with other emergency programs, is credited with reducing U.S. child poverty by up to 40 percent—and expanding Unemployment Insurance to pay out at higher levels and for longer periods than before the pandemic, as well as to groups previously not eligible for UI benefits, such as gig workers.

Now, a few years later, researchers are taking a critical look at the impact of these temporary policies and what policymakers can learn for future implementation. Previous work has uncovered some drawbacks to the expansion of these income support programs, but there is no denying that they reduced poverty and hardship among U.S. workers and families because the unconditional nature of the cash allowed families to spend the money how they needed to stay afloat during the economic downturn.

This column will look first at new research on the Child Tax Credit and Unemployment Insurance amid the COVID-19 recovery, before turning to implications for future policymaking.

The expanded Child Tax Credit

Although efforts to make modest expansions to the Child Tax Credit failed in Congress earlier this year, the impact of the temporary CTC expansion in 2021 remains an active conversation in policy circles, especially as some of the 2017 changes to the credit are set to expire in 2025.

Recently, the Annals of the American Academy of Political and Social Science, a leading academic journal, published an entire publicly accessible issue on evaluating the effects of the 2021 expansion of the Child Tax Credit. Edited by Megan Curran of the Center on Poverty and Social Policy at Columbia University, Hilary Hoynes of the University of California, Berkeley, and Zachary Parolin of Bocconi University (also an Equitable Growth grantee), this issue provides a comprehensive look at several studies that assess the outcomes and impact of the expanded credit. The research in the volume examines the impact of the expanded Child Tax Credit on food insecurity, spending, parents’ psychological well-being, parents’ employment, racial and ethnic economic inequalities, and child developmental outcomes, along with estimating the effects of permanently expanding the credit.

Highlights from the issue include:

  • The expanded Child Tax Credit caused food insufficiency to decrease by around 25 percent and food insecurity to decrease by 15 percent, with stronger effects for the lowest-income households and those headed by a person of color, according to a survey of research by Equitable Growth grantee James Ziliak of the University of Kentucky and his co-authors.
  • The CTC expansion was associated with a narrowing of income inequality between Black and White households and between Latino and White households in the lower half of the income distribution, according to research by Equitable Growth grantee Bradley Hardy of Georgetown University and Charles Hokayem of the U.S. Census Bureau.
  • Higher-income households tended to save money from the expanded Child Tax Credit, while lower-income households tended to spend the money, according to a survey of research by Equitable Growth grantee David Johnson of the National Academies of Sciences, Engineering, and Medicine, Jonathan Fisher of the U.S. Census Bureau (Equitable Growth’s former Research Advisor), and Jake Schild of the Bureau of Labor Statistics. Among families who spent the money, it was mainly used for basic household needs (food and rent) and for their children (child care and school supplies).

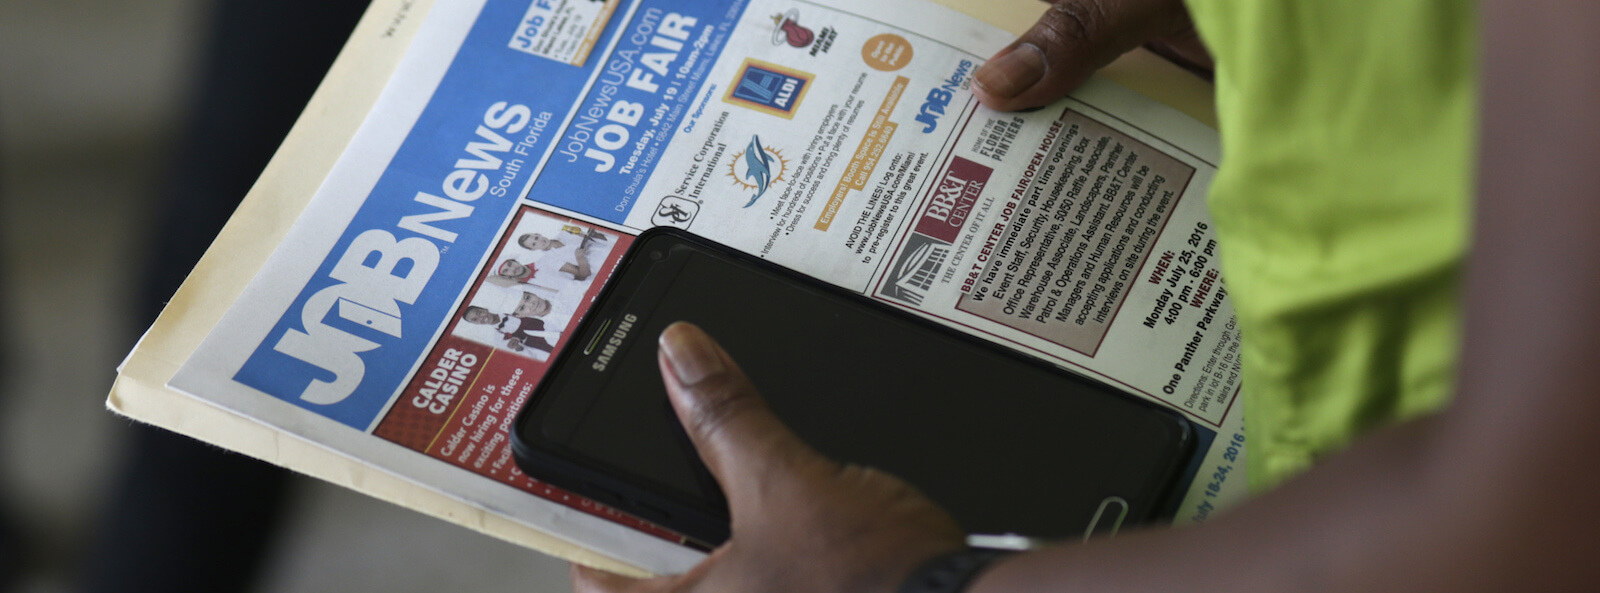
Expanded Unemployment Insurance

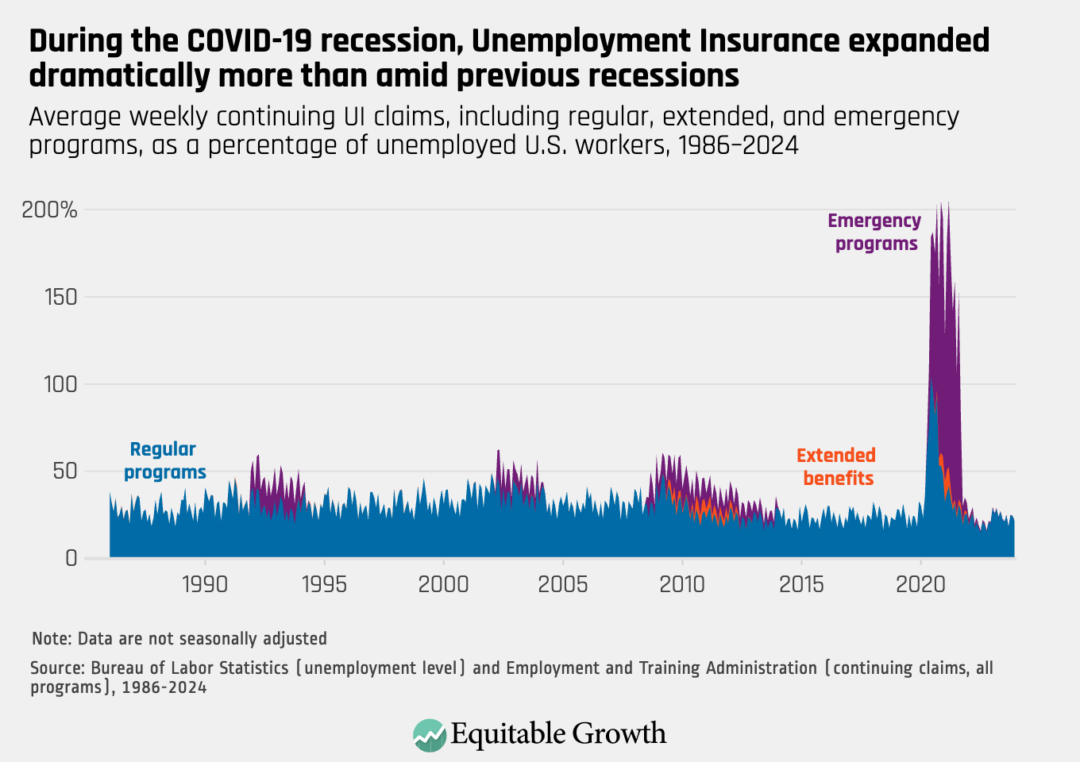
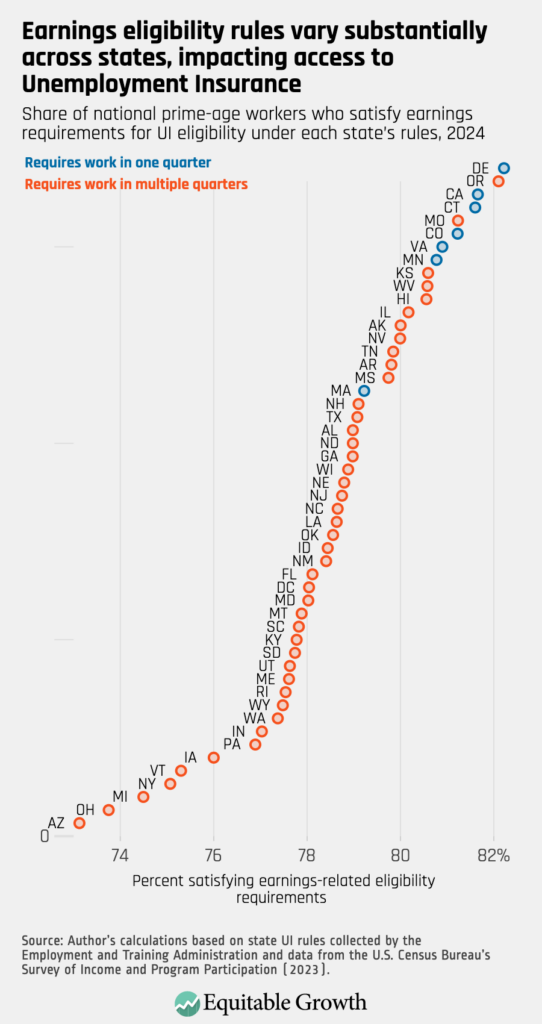
In response to the massive job losses early on in the COVID-19 pandemic, Congress passed several expansions to Unemployment Insurance benefits, including increased benefit amounts—a $600 per week increase from April 2020 to July 2020 and a $300 per week increase from late December 2020 through early September 2021—and expanded eligibility to self-employed and gig workers, who previously were not able to access this program.

Research by Equitable Growth grantees and University of Chicago professors Peter Ganong and Pascal Noel, along with their co-authors, finds that these expanded benefits had a significant impact on spending among unemployed households. While receiving the $600 supplement, for instance, unemployed households’ spending increased relative to when they were employed.

At the same time, the paper finds that the Unemployment Insurance expansion had a minimal impact on those workers finding employment because the benefits were temporary and were distributed in the context of a difficult job market. According to the researchers, these findings imply that countercyclical supports such as these should be considered during future economic downturns as a way to boost consumer spending.

Challenges with disentangling the impact of COVID-19 policies

Given the overlapping time periods of the expansions of the Child Tax Credit and Unemployment Insurance, along with three rounds of Economic Impact Payments in 2020 and 2021, disentangling the impact of these policies is challenging. It is hard to discern whether an improved outcome is the result of one policy alone or a combination of the expanded programs.

For example, Bruce Meyer of the University of Chicago and his co-authors contend in their recent study that some of the significant decrease in poverty in 2021 has been misattributed to the expanded Child Tax Credit. They argue that although the CTC expansion played a role, expanded Unemployment Insurance and the stimulus checks had a bigger impact on improving well-being among U.S. workers and families.

Conclusion

While it may be important when designing future policies to know exactly which COVID-era policy had the most impact for struggling Americans, the fact remains that overall U.S. poverty, and especially child poverty, decreased significantly in 2021 (using the Supplemental Poverty Measure) and increased again after the expiration of these programs in 2022. The common link is that each of these programs provided unconditional cash to families, which they were able to use for household necessities or to enrich their children’s lives, pay down debt, or save for future emergencies.

Research on both the expanded Child Tax Credit and guaranteed income programs (see, for example, findings from Stockton, California), indicates that unconditional cash has a significant impact on families’ well-being. Whatever the specific contours of future anti-poverty proposals that policymakers consider, this research shows that unconditional cash should be a key focus.


Did you find this content informative and engaging?
Get updates and stay in tune with U.S. economic inequality and growth!

Posted in Uncategorized

Addressing pervasive tax evasion by cryptocurrency users

""

The price of bitcoin and other cryptocurrencies reached record highs last week, buoyed by the U.S. election of Donald Trump, who is seen as friendly to this novel asset class, for president. But as the buying, selling, and using of cryptocurrencies increase, so too will the tax consequences—and, perhaps, the tax avoidance—associated with these so-called digital assets.

Indeed, noncompliance with cryptocurrency tax liability is believed to be pervasive across the globe. As a result, governments are ramping up efforts to combat tax evasion in the crypto industry.

In the United States, for example, the IRS has started issuing subpoenas to major cryptocurrency exchanges for transaction data and sending liability reminder letters to taxpayers engaged in cryptocurrency transactions, which, under current rules, likely trigger capital gains tax. Yet there is little scientific evidence whether these increased tax enforcement efforts will pay off through recouped tax revenue.

Our recent research seeks to address these gaps in knowledge. We quantify the extent of cryptocurrency tax evasion and assess the efficacy of tax enforcement interventions. To do so, we leverage rich data from Norway that links investors’ cryptocurrency transactions to their tax returns and demographic characteristics.

While Norway has a much smaller population than the United States, it is a similarly open and wealthy economy. In fact, its Gross Domestic Product per capita was 8 percent higher than that of the United States in 2023 and, according to our evidence alongside surveys from the United States, Norwegians and Americans both increased their cryptocurrency holdings considerably between 2018 and 2022, making Norway a helpful exemplar for U.S. policymakers in this area.

Our paper finds that cryptocurrency tax evasion in Norway is pervasive, even among those using crypto exchanges that share identifiable trading data with tax enforcement agencies. At the same time, we find that the tax liability on cryptocurrency assets tends to be quite low, so we urge enforcement agencies to consider either very targeted or inexpensive efforts to address this widespread problem.

We’ll discuss each finding next, before closing with policy suggestions.

Cryptocurrency tax evasion is pervasive

We find that 6.9 percent of Norwegians held some cryptocurrency in 2021. But of those cryptocurrency owners, 88 percent failed to declare their holdings in their tax returns. This means that 6 percent of the broader Norwegian population are cryptocurrency tax noncompliers in the sense that they hold undeclared cryptocurrencies.

This does not mean that all of these taxpayers owe taxes on their holdings, but instead that they have failed to declare these holdings, a requirement of Norway’s wealth tax—though that tax only applies to single or married taxpayers with net wealth more than roughly $150,000 for single payers or $300,000 for married taxpayers filing jointly (in U.S. dollars). These noncompliers may also owe taxes on realized capital gains from cryptocurrency trading.

Our paper also shows that the majority of cryptocurrency tax noncompliers are male, young, and urban residents. (See Figure 1.)

Figure 1

Percentage of Norwegians who hold cryptocurrency (blue bars) and percentage of Norwegians who hold undeclared cryptocurrency (orange bars), by subgroup, 2021

We find that this concentration among young men in cities is driven by differences in cryptocurrency adoption across individual characteristics, not by differences in tax noncompliance conditional on holding cryptocurrency. This is arguably good news for tax authorities because it means they can use survey data on cryptocurrency adoption to better target tax noncompliers.

Cryptocurrency tax noncompliance is pervasive even among those using exchanges that share identifiable trading data with tax authorities

We find that 80 percent of those investors trading on Norwegian cryptocurrency exchanges fail to declare their cryptocurrencies to tax authorities—even though these exchanges share identifiable trading data with the Norwegian Tax Administration. At the same time, the majority of Norwegian cryptocurrency tax noncompliers do not trade on the domestic exchanges, meaning their trades (on foreign exchanges or directly on blockchains) are not reported to Norwegian authorities.

This is, in part, a composition effect. Since many Norwegian crypto investors exclusively trade outside the domestic exchanges, we would expect a large portion of noncompliance to happen in that setting. Yet behavior also plays a role: Those who trade outside the domestic exchanges have an even higher rate of tax noncompliance, perhaps because these investors have less understanding of their reporting obligations or because the lack of third-party reporting emboldens them to withhold information with perceived impunity.  

Taken together, these results suggest that subpoenaing trading data from domestic exchanges by itself is not going solve the problem of tax noncompliance in the context of crypto.

Despite tax noncompliance, cryptocurrency investors owe a modest amount of taxes

We estimate that the average value of tax evasion across all cryptocurrency tax noncompliers is between $200 and $1,087 per person per year. This is largely a function of few taxable transactions and relatively small amounts of holdings.

This finding suggests that tax enforcement interventions need to be either well-targeted or cheap for the benefits to outweigh the costs.

Assessing the options for cryptocurrency tax enforcement

Building on these results, our paper then turns to the efficacy of two low-cost tax enforcement interventions. For each option, we compare the benefits in terms of increased cryptocurrency tax revenue against the cost of the intervention.

The first intervention involves indiscriminately sending letters to anyone who previously declared cryptocurrency in their tax returns but then stopped, reminding them that cryptocurrencies are taxable. We find that these reminder letters increase the probability of cryptocurrency tax compliance by about 25 percentage points and, on average, raise just enough tax revenue to cover the cost of the intervention.

The second intervention—a correspondence audit—involves sending letters to taxpayers requesting documentation (such as bank statements) to support the claims in their filed tax returns. We find that correspondence audits would be profitable if tax enforcement agencies could directly target cryptocurrency tax noncompliers. If tax authorities cannot directly identify cryptocurrency tax noncompliers, however, and must instead draw audit subjects from the broader population, we find that audits would be profitable only if targeted at a very narrow part of the population.

Indeed, we find that the optimal correspondence audit strategy is highly selective, targeting only individuals younger than 30 with incomes above the 98th percentile—a group that represents about 0.01 percent of the overall Norwegian population. Still, we find that the revenue gains from even such well-targeted audits would be modest and need to be weighed against the burden imposed on audited taxpayers, such as time costs and lawyer fees.

Conclusion

Our recent research finds that cryptocurrency tax noncompliance is pervasive, even among investors trading on centralized exchanges that share identifiable trading data with tax authorities. Yet because most crypto investors owe little in related taxes, tax enforcement needs to be either well-targeted or cheap for the benefits to outweigh costs. Current efforts to subpoena trading data from select cryptocurrency exchanges and to send reminder letters to suspected cryptocurrency tax noncompliers are, by themselves, unlikely to solve the problem of tax noncompliance in the crypto industry.


Did you find this content informative and engaging?
Get updates and stay in tune with U.S. economic inequality and growth!

Posted in Uncategorized

The U.S. labor market keeps beating projections

""

No single economic indicator fully describes the state of the U.S. labor market. Yet a range of commonly used measures, from the unemployment rate and the prime-age employment-population ratio to wage growth and the layoff rate, tells a consistent story of ongoing strength despite some cooling that has continued over the past year.

Data released last week show that many indicators remain stronger than the median levels observed since 2001, and some remain in the top 25 percent of values observed over that period or even higher. (See Figure 1.)

Figure 1

Percentile ranking of various labor market indicators, pervious three month and year prior

While some of the October indicators, including employment growth and labor force participation, may at least partially reflect temporary downward effects of recent hurricanes, these effects are likely to fade as we move past the immediate impact of those storms. A very similar picture emerges when using data that end in September.

These data are helpful for understanding where the U.S. labor market currently stands in historical context. Yet it is also useful to compare where the labor market is to where economic fundamentals and projections stand, especially considering the many significant and discrete policy changes and economic shocks in recent years.

Moreover, policymakers who want to make reasoned decisions face a difficult problem: They only get to see what follows from the choices they actually make in the circumstances they actually face. Incorporating what they see into future decision-making requires some understanding of what else could have happened, as does evaluating the performance of policymakers.

Looking at economic projections made by institutions such as the Congressional Budget Office at various points in time can help explore these economic roads not taken. Consider, for example, payroll employment. After a recession, it is common for commentators to note the point at which employment returns to its pre-recession level. Yet this overlooks the fact that employment likely would have been growing from that pre-recession level in the absence of the recession.

Following the COVID-19 recession, for example, we can see that U.S. employment returned to its pre-pandemic level of about 152 million in June 2022—faster than any recession since 1981. The Congressional Budget Office’s final pre-pandemic projection in January 2020 suggested employment would likely have grown to 155 million by that point. That projection also showed employment of about 155 million in the third quarter of 2024, when, in reality, employment reached nearly 159 million in that month. (See Figure 2.)

Figure 2

Actual payroll employment, compared to CBO projections from 2020 and 2023

Interestingly, much of the gap between the current level of U.S. employment and the level that the Congressional Budget Office projected before the pandemic has emerged since the beginning of 2023. As seen in Figure 2, when CBO updated its projections in February 2023, actual U.S. employment was between the pre-pandemic level and the pre-pandemic projected value for the beginning of 2023. The updated CBO projection, which incorporated the full fiscal and monetary policy response to the COVID-19 pandemic and recession, showed employment growth slowing sharply (likely due to substantial monetary tightening over the preceding year), leading the level of projected employment to remain roughly flat for about a year or so before resuming modest growth. Instead, employment growth slowed only slightly, and employment was nearly 4.7 million jobs above the level projected for the third quarter of 2024.

One reason employment growth has been more robust than expected is that the labor force has grown more quickly than expected, especially since early 2023. The U.S. labor force participation rate has defied consistent projections that it would decline significantly.

Those projections are not without foundation. Increasingly large numbers of baby boomers are reaching retirement age each year, putting significant downward pressure on labor force participation and leading pre-pandemic projections to expect that participation would have fallen by more than a full percentage point from its pre-pandemic level by now. (See Figure 3.)

Figure 3

Actual labor force participation rate, compared to CBO projections from 2020 and 2023

Following the sharp decline at the onset of the pandemic, the large, complicated model that the Congressional Budget Office uses to produce its economic projections did expect labor force participation to rebound meaningfully but only partially, and the model has consistently predicted steady declines that have not been seen. Instead, the recovery in labor force participation post-pandemic has continued, and, at 62.7 percent in the third quarter of 2024, it was only 0.6 percentage points below its pre-pandemic level, despite significant demographic headwinds.

Increased labor force participation in the United States has largely been driven by so-called prime-age workers, or those between the ages of 25 and 54 who have stronger attachments to the labor force. Analysts also find that faster population growth due to increased immigration has contributed to growth in the U.S. labor force.

The labor force has, in fact, grown faster than employment, leading the unemployment rate to drift up beginning in early 2023. Despite that increase, however, it remained below the levels the Congressional Budget Office projected in both January 2020 and February 2023 for the third quarter of 2024, at 4.2 percent. (See Figure 4.)

Figure 4

Actual unemployment rate compared to CBO projections from 2020 and 2023

At its current level, the unemployment rate is further from the 2023 projection than it is from the 2020 projection. In 2020, the Congressional Budget Office’s projections, which do not attempt to predict recessions or incorporate policy changes not already in effect, showed the unemployment rate vacillating around levels consistent with full employment for the next decade. In early 2023, however, CBO expected the unemployment rate to rise sharply, likely due to tight monetary policy, before declining gradually starting in early 2024.

While current labor market performance is strong in the context of recent history, it is remarkable in the context of what could have been. Surpassing repeated projections for worse labor market performance has concrete benefits for millions of people that mirror the costs inflicted on workers by the slow recovery from the Great Recession of 2007–2009.

While this column focuses on only a few labor market indicators, the fuller context is, if anything, more impressive. Faster employment growth was not supported by slow nominal wage growth or necessitated by slow productivity growth; those measures have also met or exceeded their projections, and signs point to another strong productivity estimate for the third quarter of 2024 and positive revisions in March 2025. While prices have also risen by more than the CBO projected at various stages, inflation-adjusted output and consumption measures have still beaten their projections as well.

The Congressional Budget Office issued its most recent economic projections in June 2024. While it is generally too early to assess the accuracy of those projections, we can compare them to previous vintages. To the extent that the June 2024 projections for measures discussed here differ from the February 2023 projections, it is generally in levels rather than trajectories. In other words, the most recent CBO projections essentially bank gains made relative to past projections on things such as employment, wages, and Gross Domestic Product, and predict that growth will proceed at similar rates from these higher levels.

While unexpected changes in economic policies or economic conditions—such as those that contributed to deviations from past projections—could certainly happen again, this pattern does not point to obvious obstacles to progressing toward the full employment labor market depicted in the out years of these projections: a soft landing, if we can keep it.


Did you find this content informative and engaging?
Get updates and stay in tune with U.S. economic inequality and growth!

Posted in Uncategorized

Changing earnings requirements for Unemployment Insurance could improve access and better support U.S. workers

""

Temporary changes to the Unemployment Insurance program played an enormous role in the U.S. policy response to the COVID-19 pandemic and resulting sharp-but-short recession in 2020. Typically, Unemployment Insurance replaces some portion of beneficiaries’ wages (up to a certain amount) for a period of time when they lose their jobs through no fault of their own, with the amount of benefits and their duration varying state by state. Yet amid the public health emergency and economic uncertainty in the early days of the COVID-19 pandemic, UI generosity and eligibility expanded in unprecedented ways to protect workers’ health—and pocketbooks—with impacts that could help inform changes to the program and its eligibility rules.

Pandemic conditions were extraordinary in many ways, and the UI system’s response reflected the need for urgent and sweeping action. The federal government initially provided a $600 per week supplement, on top of regular benefits, to all UI recipients. It also created the Pandemic Unemployment Assistance program to provide benefits (including the $600 supplement) to workers who are typically not eligible for Unemployment Insurance, such as self-employed workers. Early in the pandemic, lawmakers also temporarily modified rules requiring that UI beneficiaries actively search for work in light of the potentially adverse public health consequences that maintaining that requirement could have had.

As a result of all of these changes, far more people received UI benefits than would have received them under more normal circumstances, including many workers who had more than 100 percent of their weekly earnings replaced by Unemployment Insurance. These changes meant many workers who lost their jobs amid the pandemic recession were able to stay afloat, stabilizing local economies across the United States and helping to prevent a longer, more painful recession. This pandemic experience stands in stark contrast with how Unemployment Insurance typically serves workers, including during other times of economic crisis.

During times of economic expansion, the number of U.S. workers on Unemployment Insurance is fairly small, with about one-third or less of all people who are unemployed. During and immediately after the recessions that began in 1990, 2001, and 2007, during which the federal government created programs to extend the duration of UI benefits beyond the regular coverage period, the number of U.S. workers on Unemployment Insurance was larger. In each of those recessions, the number of UI claimants was about 60 percent of the number of unemployed workers at its highest point.

During the COVID-19 recession, however, the UI system expanded much more dramatically than it had amid previous recessions, as discussed above. The resulting effects on the number of U.S. unemployed workers applying for and receiving benefits were significant, compared to the three previous recessions in recent U.S. history. In some months, the average number of weekly continuing UI claims, an approximation of the number of people receiving UI benefits,1 significantly exceeded the total number of unemployed workers, surpassing 200 percent of workers at a few points in 2020 and 2021. (See Figure 1.)

Figure 1

Average weekly continuing UI claims, including regular, extended, and emergency programs, as a percentage of unemployed U.S. workers, 1986-2024

Federal emergency programs create variations in the degree to which the UI system serves unemployed U.S. workers over time. But there also are variations among the states in the share of unemployed workers who receive Unemployment Insurance, even under normal economic conditions. (See Figure 2.)

Figure 2

Distribution across states of average weekly continuing UI claims as a percentage of unemployed workers, 2004-2024

As Figure 2 shows, UI availability in the median state (depicted by the orange circles) fairly closely tracks average availability across the country, but there is otherwise substantial variation. In 2019, for example, when the labor market was fairly strong and UI claims stood at roughly 25 percent of unemployed workers nationwide, UI availability in the 90th percentile state—Rhode Island—was 38 percent, while it was 11 percent in the 10th percentile state of Georgia. At the furthest extremes, weekly continuing UI claims in 2019 corresponded to only 6 percent of unemployed workers in the state where that share was the lowest (North Carolina) and 52 percent of unemployed workers in the state where that share was the highest (New Jersey).

Diving deeper into the data, it becomes clear that across years, as macroeconomic conditions change, the same handful of states tend to have consistently high UI availability, while another group of states tends to have consistently low UI availability. This suggests that persistent policy differences regarding UI eligibility and access, rather than changes in economic conditions or population characteristics, are responsible for the gap between the states with the highest and lowest UI availability.

Perhaps the most significant UI eligibility rules in terms of barriers to access are those that deal with how much workers need to have earned (and when) in order to claim Unemployment Insurance when they are laid off. With very few exceptions, U.S. workers are required to earn somewhere between several hundred and several thousand dollars before becoming eligible for UI benefits. Typically, states also either implicitly or explicitly require that those earnings be spread out over at least two quarters.

These earnings-related eligibility rules have important consequences for workers’ access to Unemployment Insurance and UI availability in each state. As seen in Figures 3 and 4 below, states that have less stringent restrictions on earnings tend to have broader access to Unemployment Insurance. In order to focus on differences in policy across states rather than local economic conditions or population characteristics, the estimates in Figures 3 and 4 were calculated by applying 2024 UI earnings eligibility rules in each state to 2023 earnings for a national sample of so-called prime-age workers (those between the ages of 25 and 54, who tend to have stronger connections to the labor market).

These differences in access to Unemployment Insurance not only affect workers’ ability to stay afloat in times of hardship but also can have impacts on local economies in economic downturns. As one might expect, states that require workers to earn more before becoming eligible for Unemployment Insurance tend to see fewer workers meet those requirements. The magnitude of this relationship is economically meaningful. (See Figure 3.)

Figure 3

Share of national prime-age workers who satisfy earnings requirements for UI eligibility under each state’s rules and the base period earning required for eligibility, 2023

Consider Delaware and Arizona, the states with the highest and lowest earnings eligibility rates, respectively. In 2023, Arizona required workers to earn more than $8,100 to become eligible for UI benefits, while Delaware required them to earn only about $700. That difference could account for about 5.3 percentage points of the 9.1 percentage point gap between those two states’ UI eligibility rates.

Figure 3 also illustrates the importance of requirements related to when the income is earned. The seven states that do not require earnings over multiple quarters, seen in blue, tend to have higher eligibility rates than other states that require similar amounts of earnings to be accrued over two or more quarters. Six of these seven states are among the eight states with the highest UI eligibility rates, and the seventh, Massachusetts, has an above-average eligibility rate.

These varying earnings rules make eligibility for Unemployment Insurance vastly unequal based on where workers live. Figure 4 depicts this geographic inequality, showing the estimated share of U.S. prime-age workers who would meet earnings eligibility requirements under each state’s rules. (See Figure 4.)

Figure 4

Share of national prime-age workers who satisfy earnings requirements for UI eligibility under each state’s rules, 2024

Again comparing the most and least restrictive states, in Arizona (the most restrictive state) slightly more than 73 percent of U.S. prime-age workers would satisfy the state’s earnings eligibility requirements, while in Delaware (the most inclusive state) more than 82 percent of workers would qualify.

Conclusion

As we saw with the UI expansions that occurred amid the COVID-19 pandemic and other recent recessions, broader UI coverage can help unemployed workers weather the time it takes to find jobs that better match their skills and align with their career goals. While increasing UI coverage to levels seen under federal emergency programs would require substantial changes to a variety of eligibility rules, there is room for changes to state-level earnings requirements specifically.

Even though a number of other preconditions contribute to determining which workers are ultimately eligible for Unemployment Insurance, the most stringent earnings requirements exclude nearly 1 in 10 prime-age U.S. workers from the UI system, relative to the most inclusive requirements. Adjusting down the required earnings level and removing the requirement for these earnings to be made over multiple quarters would expand access to Unemployment Insurance, improving worker well-being in times of hardship.

Indeed, progress can be made without doing anything more dramatic than more broadly adopting rules that are already in place in some states. These changes would meaningfully enhance the degree to which this essential program serves unemployed workers.


Did you find this content informative and engaging?
Get updates and stay in tune with U.S. economic inequality and growth!

Posted in Uncategorized

Equitable Growth virtual event details how tax policies affect U.S. economic growth and could combat income and wealth inequality

""

The Washington Center for Equitable Growth recently held the second in a two-part event series on tax policies for congressional staffers interested in learning more about using persuasive, evidence-backed arguments for how the tax code affects economic growth. The virtual event, part of Equitable Growth’s Econ 101 series, featured Senior Policy Fellow Michael Linden and Senior Fellow for Tax and Regulatory Policy David S. Mitchell, as well as introductory remarks from Janelle Jones, Vice President of Policy and Advocacy at Equitable Growth.

Jones first discussed the importance of pro-growth tax policies ahead of the 2025 expiration of many provisions in the Tax Cuts and Jobs Act of 2017 and then highlighted the goal of the event—to provide a depth of knowledge about the tax code for congressional staff as they prepare their bosses for policy debates next year.

Mitchell then gave a brief recap of the first tax policy Econ 101 event in September, after which Linden turned to debunking trickle-down economic theory, which argues that tax cuts for the very wealthiest people eventually “trickle down” to benefit the overall U.S. economy. Linden explained data that show how private investment in the economy has declined for most of the 21st century, despite lower tax rates for the rich over that same time period. He also detailed how the corporate tax cuts from the Trump tax bill in 2017 largely failed to deliver wage gains for workers.

Mitchell and Linden then explained how policymakers can achieve real pro-growth tax reform, namely by reducing income and wealth inequality, raising more revenue, and incentivizing competition and innovation. They then took turns presenting each of these three mechanisms.

Mitchell detailed the underlying economics behind the idea that inequality is a drag on growth—specifically how it obstructs, distorts, and subverts the economy and impacts rates of intergenerational mobility—before detailing how tax policies can play a role in reducing inequality, particularly corporate and estate taxes.

Linden then discussed how high-return public investments, such as in early childhood education, physical and social infrastructure, climate change mitigation, and research and development, also have an impact on economic growth. As things currently stand, public investment is near historic lows in the United States, exacerbated by tax cuts that reduced revenue. Allowing these tax cuts to expire in 2025, Linden explained, would raise revenue for the government to invest in these important physical and social infrastructure programs, in R&D, and in mitigating long-term fiscal risks potentially harmful to economic growth.

A third way to use the tax code to achieve equitable economic growth is by encouraging competition and thus more innovation. Linden detailed how tax policies can be used by lawmakers to reduce monopoly power to boost innovation and to address complex and ineffective incentives for businesses that can also lead to wasteful efforts at tax avoidance and planning.

Mitchell then dove into several illustrative policy examples before taking questions from attendees.

Review the presentation slides for more information.


Did you find this content informative and engaging?
Get updates and stay in tune with U.S. economic inequality and growth!

Posted in Uncategorized

Equitable Growth renews collective bargaining agreement with Nonprofit Professional Employees Union

""

The Washington Center for Equitable Growth has renewed its 3-year collective bargaining agreement with the Nonprofit Professional Employees Union IFPTE Local 70. The agreement, which was signed on August 23, includes changes and improvements to paid leave, hybrid and remote work, and annual and promotional salary increases.

“I am thrilled how the labor and management teams collaborated quickly and productively on this collective bargaining agreement,” said Equitable Growth President and CEO Shayna Strom. “The end result is something we can all be proud of, and it is consistent with the organization’s broader commitment to advancing worker power.”

“I’m so proud of our members’ efforts to directly shape their working conditions, protect their rights, and contribute to a stronger labor movement,” said Christian Edlagan, president of the Equitable Growth chapter of the Nonprofit Professional Employees Union and a member of the unit’s bargaining committee. “This outcome is a testament to our collective dedication to progressive values and to a fair, supportive work environment. It also reaffirms the central role of worker voice and solidarity in ensuring Equitable Growth’s success.”

Highlights of the renewed agreement include:

  • A new hybrid/remote work policy that emphasizes purpose-driven in-person engagement
  • Twelve weeks of 100 percent paid parental and personal medical leave, representing an increase of 4 weeks
  • Ability to roll over up to $1,000 in unused professional development funds
  • Year-round half-days on Fridays
  • A new $40 monthly cell phone/internet stipend
  • A flat $3,000 yearly salary increase for all employees, plus a minimum 7 percent salary increase for job-grade promotions and a minimum 3.5 percent raise for promotions within job grades
  • No reductions in insurance benefits guaranteed in the previous contract

Equitable Growth first announced formation of the union in 2019 and previously ratified a collective bargaining agreement in 2021. The Nonprofit Professional Employees Union IFPTE Local 70 represents professionals employed at more than 50 nonprofit organizations, including the Economic Policy Institute, the Center for American Progress, and Community Change. NPEU gives nonprofit workers a voice to strengthen their workplaces and continue to do work that makes a difference in people’s lives. To read NPEU’s release announcing the contract, click here.

Posted in Uncategorized

End Ineffective Business Tax Breaks Before Creating New Ones

(This opinion piece first appeared in Tax Notes Federal on September 23, 2024.)

Vice President Kamala Harris recently proposed an expanded tax benefit for start-up businesses, aimed at helping fledgling entrepreneurs lower their tax bill.

That’s all well and good: With hard work, capital investment, and some luck, small, early-stage firms can become engines of economic growth and hiring. There is not great evidence that tax policy makes much of a difference in this regard. Business decisions are mostly based on immediate, real-world conditions, not on tax benefits that will take years to pay out, if at all. But narrow, targeted proposals, such as the vice president’s, can make a positive difference—and can do so without blowing a hole in the federal budget.

Yet Harris is not the first politician to try to use the tax code to appeal to Americans’ love of “small business.” The tax code is riddled with expensive and regressive provisions that are purportedly directed at small firms but today operate as large, unfair loopholes.

Take, for example, the qualified business income deduction, also known as section 199A. This highly complicated provision was included in the Tax Cuts and Jobs Act as a last-minute giveaway to passthrough businesses, non-C-corporation firms that pay taxes on their owners’ individual returns rather than as a separate entity. In the political debate, passthroughs are often invoked interchangeably with “small businesses,” but the truth is the big winners from this tax cut were extremely wealthy owners of relatively large firms. One such beneficiary was billionaire former New York City Mayor Michael Bloomberg—not exactly a local Main Street proprietor—who received nearly $68 million in 2018 thanks to section 199A.

The problems with section 199A are foundational. Not only are the guardrails that policymakers put in place to limit the benefit to low- and middle-income owners clearly not working, but the section by design also only helps already profitable companies, not nascent start-ups. The provision is incredibly expensive, costing roughly $60 billion per year—more than enough to fund a universal pre-K program. The provision’s proponents claimed that it would increase entrepreneurship and economic activity, but a rigorous evaluation of it has found zero impact on wages, output, or employment.

Thankfully, section 199A—which one expert called “the worst provision ever even to be seriously proposed in the history of the federal income tax”—is scheduled to sunset at the end of 2025. Policymakers would be wise to let it expire.

But section 199A is not the only wasteful tax policy ostensibly focused on small business owners. Congress should also get rid of the qualified small business stock exclusion, or section 1202. Despite having “small business” in the name, this provision has similarly failed to actually help small businesses, instead providing a windfall to already wealthy C corporation founders and venture capitalists.

Again, the rules have proven gameable: Although businesses with more than $50 million of assets when stock is issued are ineligible, there is a gray area around how those assets are valued. And while the limit on the capital gains exclusion is set at $10 million (or 10 times the price paid for the stock, whichever is higher), tax planners have devised schemes to spread qualified gains across trusts and family members, allowing for investors to shield many multiples of that limit.

One final loophole that policymakers should close before adding more small business benefits to the code is perhaps the most maddening, since it undermines the fiscal stability of some of our most critical and beloved government programs: Medicare and Social Security. To ensure parity between wage earners, who pay payroll taxes, and business owners, who do not, the self-employed in the United States pay what is called the self-employment tax, contributing their fair share to the Social Security and Medicare trust funds. High-income business owners also pay what’s called the net investment income tax to help fund Medicare. Yet many self-employed Americans get around these obligations by setting up S corporations or finding other loopholes, such as qualifying as “real estate professionals” or “limited partners” in a partnership.

The tax code should reward bona fide entrepreneurs who strike out on their own to start a small business, and Congress should welcome new ideas to encourage productive risk-taking. But tax policies that profess to help small businesses should be designed carefully so as not to create loopholes that can be abused by wealthy Americans with high-priced lawyers and accountants. The tax code is already riddled with such provisions, failing to encourage productive investment and costing the federal government billions of dollars.

Harris and other policymakers should clean up this underbrush of tax waste—by allowing section 199A to expire, doing away with section 1202, and closing the self-employment and net investment income tax loopholes—before planting new tax incentives for business owners.


Did you find this content informative and engaging?
Get updates and stay in tune with U.S. economic inequality and growth!

Posted in Uncategorized

Equitable Growth’s ‘Econ 101’ offered congressional staffers a rundown of the contours of U.S. tax policy

""

The Washington Center for Equitable Growth recently hosted a congressional briefing—part of a series we call “Econ 101”—for Hill staffers interested in learning more about the ins and outs of the U.S. tax code and various tax policy issues. Equitable Growth’s senior fellow for tax and regulatory policy, David S. Mitchell, and University of Maryland economics professor Daniel Reck led the briefing, which covered topics such as major U.S. federal taxes, individual versus business taxation, debates surrounding tax expenditures, and more.

Ahead of the expiration of many provisions in the 2017 Tax Cuts and Jobs Act in 2025, policymakers are gearing up for forthcoming tax policy debates. Understanding the U.S. tax code and being able to evaluate conflicting claims about the relationship between taxes and the economy will take on added importance next year.

Mitchell began the briefing with an overview of basic tax facts. He discussed how government revenues—funded mostly by the individual income tax and payroll taxes—currently are too low to handle federal spending demands and demographic shifts in the United States. Reck then explored payroll taxes in more detail, before Mitchell dove into individual income taxes and how they are calculated. Reck then discussed business income taxation, differentiating between the tax treatment of C corporations and pass-through businesses. Reck also discussed how the IRS taxes businesses’ international activities.

The pair then went through several major issues in tax policy. Mitchell first detailed tax expenditures, or spending through the tax code such as tax credits for higher education spending and retirement savings accounts. Reck defined both statutory incidence (which groups have a legal responsibility to remit taxes) and economic incidence (which groups bear the economic burden of a tax) and the relationship of these two incidences with the progressivity of the tax code.

Mitchell then turned to the main purpose of taxation—raising revenue for the federal government—and how to read a federal revenue table. He discussed the effects of tax cuts on the federal deficit and overall strength of the economy before turning it over to Reck to discuss behavioral impacts of tax policy.

Mitchell and Reck then took audience questions, many of which centered on the preference in the business code for private debt financing and private equity and tax treatment of pass-through businesses.

This Econ 101 was the first of a two-part series on the U.S. tax code and tax policy changes. The second, in mid-October, will focus on the most persuasive, evidence-backed arguments for how the tax code affects economic growth.

Review the presentation slides from the September 27 Econ 101 briefing to learn more.


Did you find this content informative and engaging?
Get updates and stay in tune with U.S. economic inequality and growth!

Posted in Uncategorized

New data show significant changes in racial and class mobility gaps in the United States

""

Past research shows that differences in intergenerational mobility between Black and White Americans have persisted since the 1880s. Current racial economic mobility gaps are rooted in historical discriminatory policies, such as segregation and redlining, and continue to this day even after many of these policies were outlawed. So, what can be done to change these long-term trends, and can shifts occur in a relatively short time horizon?

Important new research from economist Raj Chetty and his team at Harvard University’s Opportunity Insights delves into these two questions. Chetty and his colleagues find that changes in economic mobility from one generation to the next are possible and are driven by differences in children’s social environments at the community level. Most notably, the research shows significant shifts in the Black-White economic mobility gap and in class gaps for White children in the United States.

Looking at changes in economic mobility for U.S. children born between 1978 and 1992, Chetty and his team identify several key findings. First, over the past 15 years, the Black-White economic mobility gap decreased, while the mobility gap between White children from low- and high-income families increased. Average earnings decreased for White children born in 1992 to low-income families, compared to those born in 1978, while incomes went up for White children born to high-income families.

At the same time, the adult incomes of Black children born into households at all income levels went up. This resulted in a 27 percent decrease in the gap between average incomes for White and Black adults who grew up in low-income households from the 1978 cohort to the 1992 cohort—though the gap remains significant because of the large initial divide in the 1978 cohort.

Chetty and the Opportunity Insights team find that variations in the environments where children grow up drives the changes in U.S. economic mobility by race and class. The differences in adult economic outcomes correlate with changes in employment rates in their childhood communities, holding constant their parents’ employment situations. In other words, children raised in thriving communities with low unemployment have better outcomes in adulthood, regardless of their own families’ socioeconomic status.

The team also studies the impact of community-level social interactions on economic mobility, looking at both economic resources and social interactions as potential reasons that living in a community with higher employment leads to better economic outcomes for children in adulthood. Indeed, the researchers find that social interactions are the primary driver of greater economic mobility.

A deeper dive into the changing mobility gaps

One of the most eye-catching findings from the Opportunity Insights research is the decrease in the Black-White mobility gap. That’s partially because previous research from Opportunity Insights, among other studies, pointed to very limited intergenerational upward mobility for Black Americans.

In their new paper, Chetty and his team discuss the evolution of their findings, explaining that in this new research, they were able to disaggregate the data by race and parental income­—something they were not able to do in previous studies. Without that dual disaggregation, the increase in income for White adults who grew up in high-income households offset the decline in income for White adults raised in low-income households, which meant the White-Black mobility gap appeared essentially the same over time.

Even with the new approach to the data, there are several important things to keep in mind when considering the decrease in the Black-White mobility gap that Chetty and his team find in this research. Specifically:

  • Despite a decrease in the racial mobility gap between the 1978 cohort and the 1992 cohort, the average income of White adults from low-income backgrounds in the 1992 cohort is still 41 percent higher than the average income of Black adults raised in low-income households.
  • The decline in the Black-White mobility gap is not solely driven by improvements in Black adults’ economic outcomes. While the average incomes of Black individuals increased between the 1978 and 1992 cohorts, the mobility gap also declined due to lower average incomes for White adults from low-income households between the 1978 cohort and the 1992 cohort.
  • The increased mobility of Black children in the 1992 cohort, compared to the 1978 cohort, means that they are less likely to be in poverty. Yet their upward mobility was mainly into the working class or middle class—not into the top income quintile. 

As these points show, despite the Black-White mobility gap narrowing, it is still significant.

Conclusion

Overall, Chetty and his team’s recent work shows that economic mobility can change in a relatively short time, and these shifts are driven by changes in the communities and social environments in which children grow up. This finding has encouraging implications for enacting policies to improve mobility.

When communities experience economic shocks, for example, policymakers should focus government support on youth as well as adults, including investing in schools and youth job-training programs. Economic mobility policies also should combine providing financial resources with investments in social supports and increasing connectedness, such as connections with college counselors and housing navigators.

At the same time, looking solely at income misses how important the intergenerational transfer of economic resources is to children’s outcomes. The Black-White wealth divide is significantly larger than the income gap. Even closing the racial income gap will still leave a notable racial wealth divide, as Fenaba Addo of the University of North Carolina at Chapel Hill, Duke University’s William A. Darity Jr., and the University of Minnesota’s Samuel L. Myers Jr. discuss in their recent research. The broader context of this racial wealth gap needs to be considered to give a fuller picture of the policy changes needed to shift long-term outcomes around racial economic equity.


Did you find this content informative and engaging?
Get updates and stay in tune with U.S. economic inequality and growth!

Posted in Uncategorized

The unequal impact of the Federal Reserve’s monetary tightening and easing on firms in the United States

""

The easing of inflation in the U.S. economy beginning in 2022 and recent signs of weakness in the U.S. labor market over the past several quarters have led households and financial market participants alike to form expectations that the Federal Reserve might embark on an easing cycle over the rest of 2024. This potential shift would mark the first reversal after a rapid series of interest rate increases by the Fed in 2022 and 2023.

But the Fed’s expected decision to cut its benchmark federal funds rate later this month raises an important question: Do interest rate hikes affect the U.S. economy to the same extent as rate cuts? Existing economic research on the transmission of monetary policy decisions into the broader economy documents that monetary tightening tends to have stronger effects than easing, using aggregate historical data.

Yet few studies have explored these asymmetric effects at the micro-level, particularly how individual firms respond differently to monetary tightening and easing. In my recent working paper, I explore these asymmetries using firm-level data to provide a deeper understanding of how various types of firms respond differently to monetary tightening and easing. I find that tightening is more effective than easing at the firm level for monetary policymaking but also that heterogeneity among firms also impacts the effectiveness of monetary policymaking when the Fed tightens or eases the federal funds rate.

To explore the asymmetry in firms’ responses to monetary policy, I combine identified periods of monetary easing and tightening with quarterly Compustat firm-level data, spanning from the third quarter of 1980 to the fourth quarter of 2019. I chose this period of time because it was before the onset of the COVID-19 pandemic and the subsequently sharp, but short, recession in 2020.

This comprehensive dataset further allows me to explore a wide group of financial constraint proxies, such as firm size, dividend status, credit ratings, and age, and to examine whether firms with certain financial characteristics exhibit distinct responses to monetary policy shocks in the form of interest rate cuts or hikes.

My analysis first focuses on how periods of monetary tightening and easing differentially impact firm-level employment, sales, and investment rates. For employment, the results indicate that a 25 basis-point monetary tightening of the federal funds rate leads to an approximately 1.1 percent drop in employment 10 quarters after the policy change. In contrast, an equal-sized easing of the federal funds rate only leads to a maximum 0.3 percent increase in employment over the same period, and the effect is insignificant across the horizon. (See Figure 1.)

Figure 1

The effects on firms’ employees during periods of tightening or easing of the federal funds rate by the Fed over the subsequent 20 quarters

These findings suggest that monetary tightening easily transmits into more job destruction, yet monetary expansions produce less job creation. This difference may be attributable to factors such as firms’ hiring costs and a slower job-finding rate among workers caused by existing job-matching frictions across U.S. labor markets.

This result is also consistent with evidence of a downward nominal wage rigidity channel. Downward nominal wage rigidity occurs when wages fail to decrease during economic downturns due to worker resistance to wage cuts. As a result, firms may reduce hiring or cut jobs instead, leading to greater employment losses. For instance, I and my colleague at Bentley University, Laura E. Jackson, show that the employment impact of monetary tightening may be exacerbated in certain sectors with larger downward wage rigidity.

Consistent with these employment findings, I show in my recent working paper that firms’ sales show a peak decline of 2.9 percent over 13 quarters following monetary policy tightening. This effect is significant from quarter 4 to quarter 16, with sales beginning to recover only about 3 years after the shock. In contrast, a monetary expansion leads to a maximum increase in sales of about 1 percent a year after policy shifts, but this effect is less significant, consistent with the employment response to monetary easing. (See Figure 2.)

Figure 2

The effects on firms’ sales during periods of tightening or easing of the federal funds rate by the Fed over the subsequent 20 quarters

Overall, sales exhibit a stronger, and persistent, response to monetary tightening than easing, aligning with the observed impact on employment levels, as shown in Figure 1.

The investment response to monetary tightening or easing, however, exhibits less pronounced asymmetry, compared to the employment and sales results. In particular, a 25 basis-point monetary tightening results in a peak reduction of 0.7 percentage points in firms’ rate of investment, occurring 11 quarters after the shock. In contrast, monetary expansions have much weaker effects on investment. (See Figure 3.)

Figure 3

The effects of firms’ rate of investment during the periods of tightening or easing of the federal funds rate by the Fed over the subsequent 20 quarters

The asymmetry tests reveal that investment responses show a lower degree of asymmetry than the employment and sales responses. This lower degree of asymmetry might be explained by the firm specificity of capital and the irreversibility of investment decisions once they are made. Since capital has firm-level specificity, many firms may find limited benefits in selling their capital during periods of monetary tightening. In contrast, labor is relatively less firm-specific, making it easier for firms to adjust their employment levels following a monetary tightening.

In my working paper, I also trace alternative proxies for financial frictions and find considerable heterogeneity in firms’ responses to monetary policy shocks by the Fed. My results find significant heterogeneity depending on the size of firms, dividend statuses, their credit ratings, and age, corroborating earlier research on financial constraints.

Specifically, employment levels decline more sharply in response to monetary tightening, particularly among small firms, non-dividend-paying firms, those firms with low credit ratings, and younger firms. Similarly, I find that sales and investments by firms with low credit ratings respond significantly more to monetary tightening, compared to those with high credit ratings.

This suggests that firms with more severe financial constraints respond more to monetary tightening, which is consistent with the financial accelerator framework suggesting that firms with weaker balance sheets experience higher borrowing costs, thereby amplifying the negative effects of tighter monetary policy on economic activity.

My findings suggest that monetary tightening is more impactful than when the Fed eases its federal funds rate, particularly on firm-level employment and sales. These findings also show that the impact of monetary policy tightening and easing varies significantly across different types of firms. Overall, this paper highlights that monetary policy decision-making does not affect all firms equally, providing monetary policymakers with a practical rule of thumb for understanding the scope of their policymaking after accounting for the asymmetric effects on different types of U.S. firms.


Did you find this content informative and engaging?
Get updates and stay in tune with U.S. economic inequality and growth!

Posted in Uncategorized