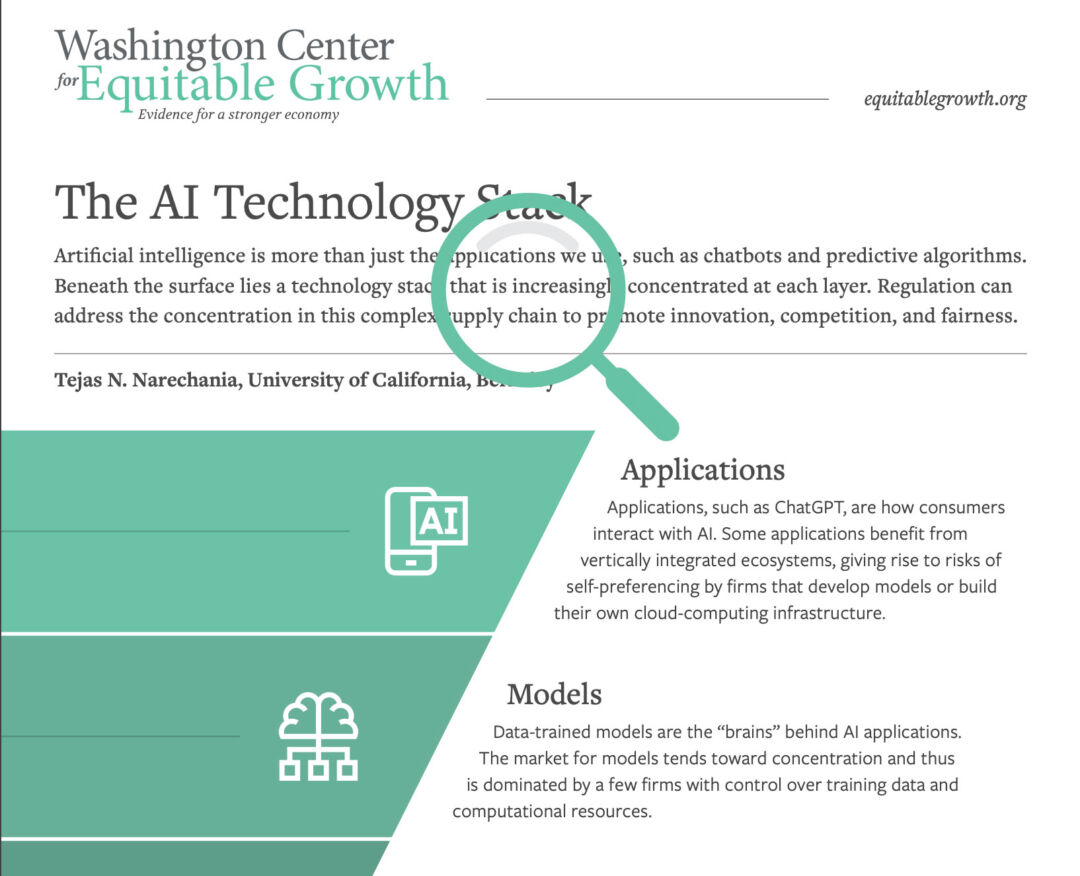
Artificial intelligence is more than just the applications we use, such as chatbots and predictive algorithms. Beneath the surface of AI lies a technology stack that is increasingly concentrated at each layer. (Click on the graphic below.)
Government regulation can address the concentration in this complex supply chain to promote innovation, competition, and fairness. Key considerations for policymakers include:
Subsidizing semiconductor production facilities to diversify supply chains and reduce reliance on a concentrated industry
Building public cloud services to provide competitive alternatives and set fair pricing baselines, as well as set clear interconnection and interoperability standards to help reduce switching costs and foster greater competition
Addressing vertical integration through nondiscrimination rules that ensure equal terms for access to proprietary AI models and hardware
Ensuring that vertically integrated applications compete fairly with their counterparts and do not benefit from favorable terms for accessing models, data, and computational resources
Tejas N. Narechania is a professor of law at the University of California, Berkeley, School of Law and a faculty co-director of the Berkeley Center for Law & Technology. His scholarly focus is on the institutions of technology law and policy, among other subjects. Before joining Berkeley Law, Narechania clerked for Justice Stephen G. Breyer of the U.S. Supreme Court and for Judge Diane P. Wood of the U.S. Court of Appeals for the Seventh Circuit. He also has advised the Federal Communications Commission on network neutrality matters and served as special counsel at the FCC from 2012–2013.
Did you find this content informative and engaging? Get updates and stay in tune with U.S. economic inequality and growth!
When President Donald Trump takes the presidential oath of office again on January 20, he will be inheriting a very different economy, with a very different outlook, than the one he left for President Joe Biden four years ago. Almost immediately after President Trump’s inauguration next week, important questions will arise about how to measure the success of the U.S. economy and the effect of the new administration’s economic policy interventions.
Evaluating future economic performance under a second Trump presidency demands both an evaluation of the current state of the U.S. economy as the next administration takes the helm and a sense of the economic expectations going forward. Concrete benchmarks such as these should serve as yardsticks for the U.S. economy over the next four years.
This issue brief presents a number of these benchmarks for evaluating the economy under the second Trump administration. It surveys the latest actual data, as well as forecasts from credible private and public sources, and comes to four main conclusions:
While the U.S. economy still has challenges, especially lingering inflation and poor consumer sentiment, many important economic metrics are outperforming the 2008 cycle (the most recent nonpandemic business cycle and the cycle in which the first Trump administration began), and some are even at historical highs.
Some measures have already met goals set by the incoming administration, even before Inauguration Day. Real Gross Domestic Product growth, for example, has averaged 3 percent over the past two years.
Expectations are for output growth to moderate to trend next year, inflation to take roughly two years to fully return to the Federal Reserve’s 2 percent target, and the unemployment rate to remain roughly at current levels.
Economic forecasts even one year or two years out are highly uncertain.
First, let’s turn to what the data say about the current state of the U.S. economy.
Current U.S. economic data show strength
Broadly speaking, the data indicate that the U.S. economy in the later part of 2024 was in a strong position. Growth in output, measured by real GDP, and nonfarm productivity were above estimates of trend, employment levels were at near-historic highs, and real wage and income growth was positive. Though inflation was not yet fully back to the Federal Reserve’s inflation target of 2 percent, it was generally thought to be in the “last mile,” or the phase when inflation declines tend to slow as inflation approaches 2 percent. The risk of inflation reaccelerating, however, remains a concern. And some measures of labor market momentum, such as quits and hires, softened in recent quarters off of their prior strong reads.
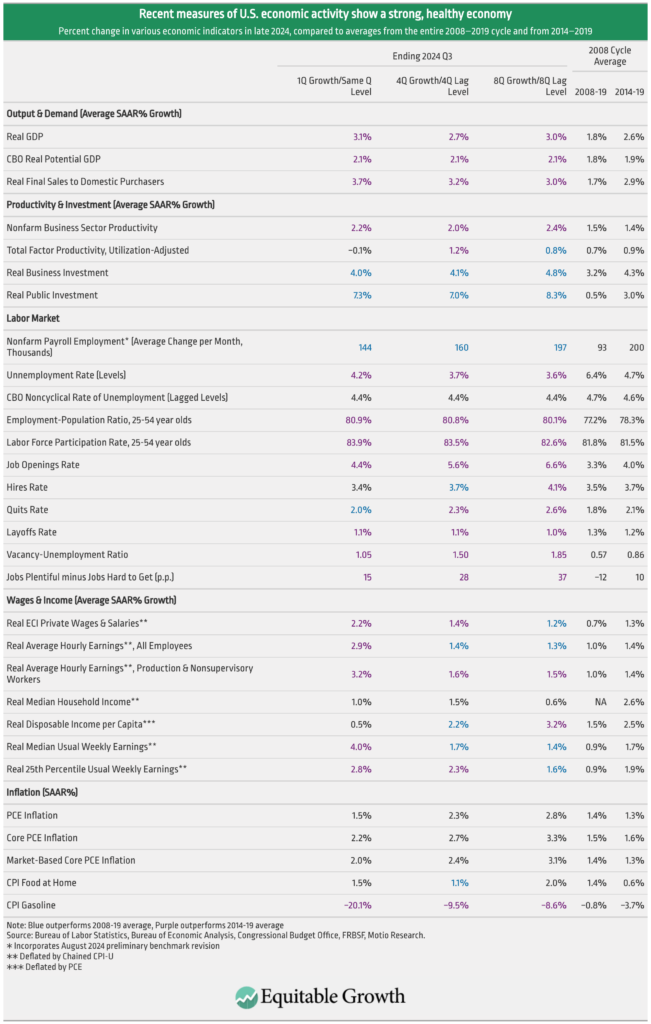
Table 1 below summarizes recent U.S. economic data and contrasts it with the performance over the 2008–2019 business cycle, which includes the Great Recession of 2007–2009 and the subsequent recovery prior to the onset of the COVID-19 recession in 2020. Numbers in blue are metrics that outperformed the average over the entire previous business cycle, while numbers in purple indicate metrics that outperformed the second half of the previous cycle, from 2014 to 2019, when the Great Recession recovery accelerated. (See Table 1.)
Table 1
As a caveat, economic aggregates are, by their nature, summary statistics that do not represent all lived experiences. Indeed, by definition, half of people are above and below the median. No one economic measure or set of measures perfectly encapsulates all the positives and negatives of the U.S. economy. With that said, were one to compare U.S. outcomes in 2025 and 2026 to those coming out of 2024, Table 1 gives a sense of what the most prominent metrics look like at the end of President Biden’s term in office.
Let’s now dive into some highlights from these data.
This is notable for a few reasons. First, the incoming Trump administration has set a goal for 3 percent growth, yet the economy of late is already performing in the vicinity of 3 percent. Second, private-sector expectations in 2022 were broadly for little to no growth the following year, which clearly turned out to be inaccurate.
As Table 1 shows, this year’s average GDP growth is not only faster than the average over the entire 2008–2019 Great Recession business cycle, when it was 1.8 percent, but also is faster than the average GDP growth over the latter half of the Great Recession recovery from 2014 to 2019, when it was 2.6 percent. Similarly, it is faster than the Congressional Budget Office’s latest estimates of potential GDP growth of 2.1 percent.
Productivity
The surprisingly high growth in U.S. output reflects upside surprises to both productivity and labor supply growth, but the productivity surprise has been the bigger recent driver. Over the past two years, productivity has averaged 2.4 percent annualized, versus 1.5 percent in the previous cycle, as seen in Table 1. Some of this strength reflects pandemic trend normalization, but this cannot account for all the surprise growth in productivity since the level of U.S. nonfarm business productivity is now above the Congressional Budget Office’s pre-pandemic projections.
As Table 1 shows, two key drivers of productivity growth are business and public investment. Real private nonresidential fixed investment has grown faster in recent quarters than the Great Recession average: It grew 4 percent over the past year, compared to 3.2 percent annualized between 2008 and 2019. Real public investment has even more significantly outpaced the previous cycle, with 6.8 percent growth over the past year versus 0.5 percent annualized over the Great Recession cycle.
The labor market
The U.S. labor market at the end of 2024 is the subject of much debate among both policymakers and workers themselves. On the one hand, many “level” measures of employment and labor utilization are at healthy, and even historic, reads. For instance, the employment-to-population ratio and the labor force participation rate for prime-age workers—25- to 54-year-olds, who tend to have the strongest ties to the labor market since they are the least likely to be in school or to retire—were both the highest in the third quarter of 2024 that they had been since the beginning of 2001.
Similarly good, the pace of nonfarm payroll employment growth (the most widely-followed measure of new jobs added to the labor market) averaged 144,000 per month during the third quarter of 2024—higher than the 2008 cycle average, despite being temporarily affected by labor strikes and October’s hurricanes in the South. And although the unemployment rate has risen recently from its cycle lows of around 3.5 percent, it is still around levels economists deem sustainable.
On the other hand, different measures of the labor market, especially “momentum”measures that look at trends in the labor market, are weaker or less extraordinary. Rates of hires, quits, and job openings are still broadly better than their 2008–2019 averages but have lost ground in recent quarters, which has been one of the rationales for the Federal Reserve’s decisions to cut interest rates. The job vacancies-to-unemployment ratio, at 1.05, is similarly tighter than the previous cycle’s average, signaling a strong labor market in which there is a job opening for almost every unemployed worker, but it has softened over the past two years.
For their part, U.S. consumers seem to be noticing the soggier labor market data. Nonprofit economic forecaster The Conference Board’s “Labor Market Differential,” which takes the share of survey respondents who sees jobs as plentiful and subtracts the share of respondents who sees jobs as hard to get, is still positive but at only half of the net share of two years ago.
Nevertheless, the current slow-hiring labor market is also a low-firing one, with the layoff rate near all-time lows.
Wages and income
Inflation-adjusted measures of wage growth, which had been negative for much of the COVID-19 pandemic, turned positive over the past two years as inflation fell while nominal income growth remained stable. In particular, real earnings measures have been positive in recent quarters, reflecting a combination of the tight labor market and strong productivity growth mentioned above. This is true of hourly measures (average hourly earnings), weekly measures (median usual weekly earnings), low-wage measures (25th percentile usual weekly earnings), and compositionally adjusted measures (the Employment Cost Index).
At the same time, real median household income—which is a broader measure of income that includes both wage and capital income, as well as some transfers such as Social Security—has generally grown more slowly than wages alone in recent quarters, albeit still positively.
Inflation
The Federal Reserve has an inflation target of 2 percent annualized growth in the personal consumption expenditures, or PCE, price index. Falling energy prices helped pull headline PCE inflation down to 1.5 percent annualized in the third quarter of 2024 alone. Over the past year, inflation has remained above but close to the Fed’s target: 2.3 percent headline PCE, 2.7 percent for PCE excluding food and energy (a measure of trend inflation that excludes volatile food and energy categories), and 2.5 percent for market-based PCE excluding food and energy (further excluding volatile financial services and other imputations).
Recent inflation reads are consistently above 2008–2019 cycle averages, though it is important to note that the Federal Reserve has been criticized for letting inflation come in too low during the previous cycle at the expense of the labor market.
Current U.S. economic expectations and forecasts
All of the recent data surveyed in Table 1 are unlikely to endure at the same pace going forward. For instance, average productivity growth of more than 2 percent over the past two years has been a welcome surprise, yet it is not clear that underlying potential productivity has risen in tandem with actual productivity. Indeed, the Congressional Budget Office estimates that potential productivity is currently only 1.3 percent. As such, a reasonable expectation could be for productivity to revert back to trend over time—although, of course, trend estimates themselves are prone to error.
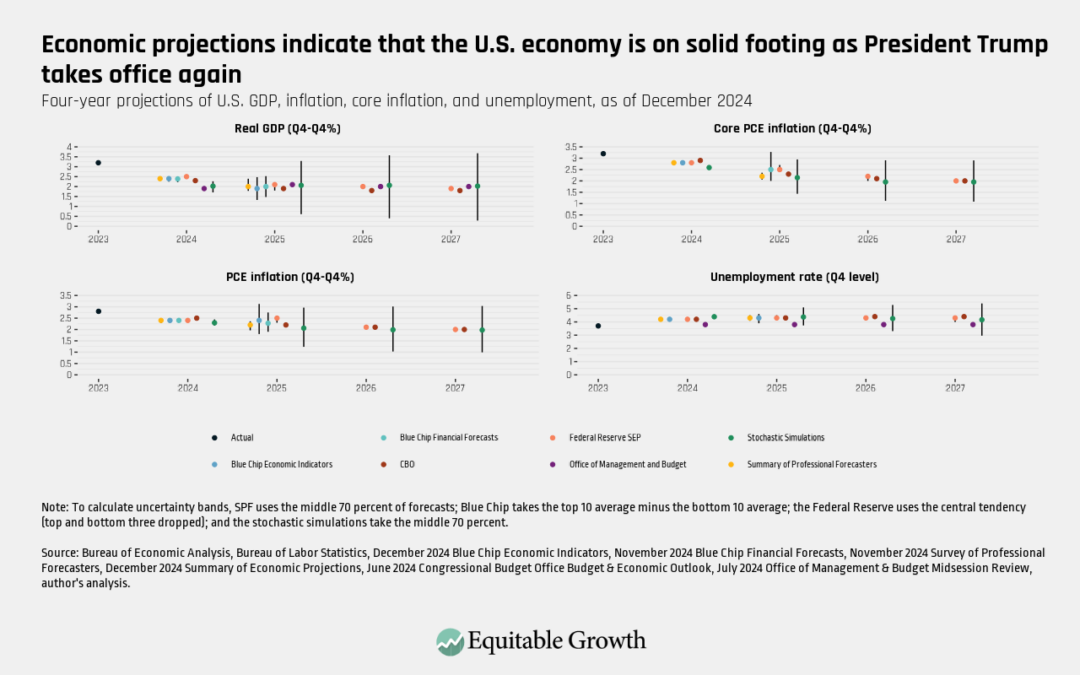
As policymakers and researchers set benchmarks for economic performance over the next four years, therefore, in addition to looking at recent actualdata, it is useful to also review current expectations and forecasts of where many of these indicators will go as we head into 2025 and beyond. (See Figure 1.)
Figure 1
As Figure 1 shows, the forecasts—from seven private- and public-sector sources, along with a stochastic simulation I performed to map near-term uncertainty—paint a consistent picture of how observers expect the U.S. economy to evolve over the next few years.1 (See endnote for a description of the sources and the stochastic simulation.)
Output
Private forecasters see real GDP growth of roughly between 1.5 percent and 2.5 percent over 2025 (measured between Q4 2024 and Q4 2025), with virtually all the forecasters converging on a central estimate of 1.9 percent to 2 percent. This would be a meaningful step down from 2024’s growth rate—broadly seen as coming in at 2.4 percent—and a reconvergence of the economy with trend.
Interestingly, the Philadelphia Fed’s Summary of Professional Forecasters sees the balance of growth risks as weighted more to the upside than downside (meaning there is slightly more of a chance that their central estimate is too low, rather than too high), whereas Blue Chip forecasters are much more symmetric in their assessment of the risks around growth. The Federal Reserve, meanwhile, sees slightly more downside risk against its median forecast for 2025.
Likewise, the simulations I performed are symmetric around 2 percent growth beginning in 2025 but do see a roughly 15 percent risk of 3.5 percent growth over 2025, 2026, or 2027—and about the same risk of 0.5 percent real growth in those years.
Unemployment
Private-sector forecasters see the unemployment rate at the end of 2025 anywhere from 3.9 percent to 4.6 percent, centered around 4.3 percent, implying an essentially flat unemployment rate all throughout 2025.
At the same time, the median participant in the Federal Open Market Committee—the Federal Reserve entity that sets the federal funds interest rate—sees 4.3 percent unemployment at the end of 2025, only slightly more of an increase than the private sector and a near-convergence with the CBO estimate of the noncyclical rate. Rates then tick down in 2026 and 2027, respectively.
The simulations I ran suggest that risks around these outcomes are wide, with the 70 percent confidence band in 2025 between 3.7 percent and 5.1 percent unemployment.
Inflation
The Blue Chip Economic Indicators forecast shows a wide range of disagreement over inflation outcomes in 2025, with PCE inflation ranging from 1.8 percent to 3.1 percent, centered at 2.4 percent. This represents essentially no headline disinflation, compared to 2024. The forecast also has core PCE inflation almost as tenacious, only falling to 2.5 percent in 2025 from 2.8 percent in 2024. The Federal Reserve’s SEP has similar levels of PCE and core PCE inflation in 2025.
It is important to note that these Blue Chip and Federal Reserve forecasts, published in December 2024, may incorporate expectations of the incoming Trump administration’s proposed policies, including around introducing broad new tariffs and plans for sweeping deportations of undocumented immigrants, both of which are generally expected to put upward pressure on prices in the United States.
Other private forecasters generally came in lower on inflation. The median Summary of Professional Forecasters headline PCE projection for 2025 was 2.2 percent, while the Blue Chip Financial Forecasts has a median of 2.3 percent for 2025. Both forecasts also have core inflation at 2.2 percent and 2.1 percent, respectively; both of these composites were published in November 2024.
The incoming Trump administration is taking the helm of a U.S. economy largely on solid footing—one with near-3 percent real GDP growth and greater than 2 percent productivity growth, positive real wage growth, high employment levels and low layoffs, and inflation that is largely seen to be in its last mile and expected to moderate over the next couple of years. The evolution of the U.S. economy over the next several years therefore should be measured against this extraordinary starting point and the expectations of observers currently living through it.
In the aftermath of the presidential election in 2024, it’s clear that many Americans feel like the U.S. economy is not working for them. Even though policymakers on both sides of the aisle have promised to improve people’s living standards, a lot depends on the outcome of one important debate this year.
In 2025, many provisions of the Trump-era tax cuts are set to expire. What Congress does in response could make a real difference in whether the United States has robust economic growth in the coming years.
Beginning as soon as this month, Congress may start to debate whether and how to extend the expiring provisions of the 2017 Tax Cuts and Jobs Act. This law delivered large benefits to wealthier people and to corporations under the old (and oft disproven) theory that tax cuts for those at the top of the income distribution would “trickle down” and spur stronger economic growth. Instead, by most accounts, those tax cuts were a disaster for the economy: They added $2 trillion to the national debt and did not benefit the vast majority of Americans.
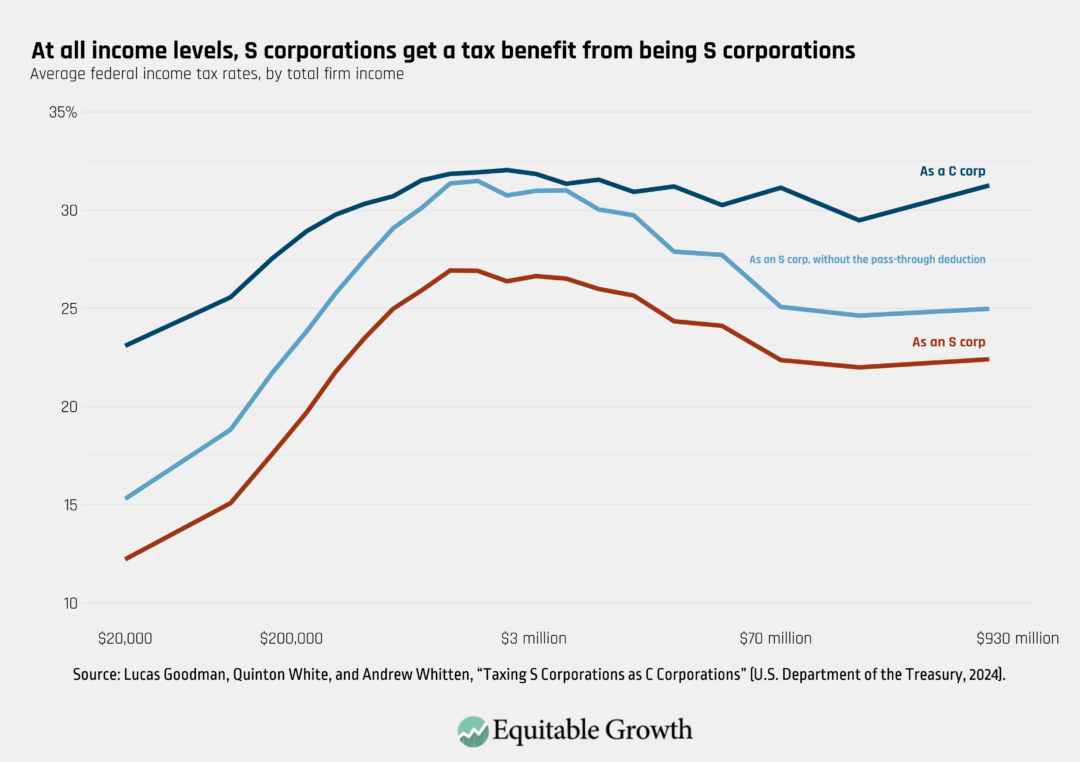
So, who did benefit? The research shows that nearly all of the $1.3 trillion in C-corporation tax cuts benefited high-income executives and shareholders, not working families. The tax reform debate presents an opportunity not only to address the expiring provisions of that law, but also to reimagine how the tax code can actually foster shared prosperity and a thriving economy.
In a recent report, I and my Equitable Growth colleagues Michael Linden and David S. Mitchell outline the academic evidence that a well-designed tax code can yield equitable economic growth and help secure an economy that works for more people. (See the video below for a brief overview of our report’s findings and the stakes of this debate.)
There are three main ways that progressive and pro-growth reform could ensure broadly shared economic growth. First, progressive taxes would help reduce the economic drag of extreme concentrations of wealth and income. Excessive inequality is itself a barrier to strong and durable growth. Inequality obstructs the supply of people and ideas into the economy and limits opportunity for those not already at the top, both of which slow productivity growth over time.
In addition, inequality distorts economic demand, siphoning resources away from the broad middle-class consumer base. In fact, economist Alan Krueger estimated that because of increasing inequality between 1979 and 2007, aggregate consumption was about $440 billion lower every year than it would have been if lower-income consumers had grown more prosperous. And when everyday consumers do not have as much money to spend, businesses are less incentivized to make robust investments. Taxes can be used to reduce inequality and remove those barriers to inclusive growth.
Second, taxes generate revenue that can be used to fund growth-enhancing public investments, such as universal child care and climate change mitigation, and to reduce long-term fiscal risks. Indeed, returns to the greater economy from public investment in children alone are significant, with some programs returning $10 for every $1 invested in children back to society. Lack of revenue, conversely, can lead to underinvestment and a riskier fiscal trajectory. The United States has a lower revenue-to-GDP ratio than any other country in the Group of Seven peer leading industrial nations and taxes well below the Organisation for Economic Co-operation and Development average. A stronger tax code that generates more revenue could address underinvestment and fiscal trajectory challenges.
Third, taxes can encourage productive economic behavior and address market distortions and inefficiencies that diminish growth. For example, when extremely large companies use their power in the marketplace to extract extra profits far beyond what they could earn through fair competition, tax cuts for those companies only serve to reward and incentivize that behavior. That may be good for that one company’s bottom line, but it is bad for the economy as a whole because it leads to less innovation, less competition, and less dynamism. The tax code could remove incentives to accumulate the most power in a marketplace and instead reward companies that genuinely have the best ideas, the most productive workers, or the most innovative business practices.
There are many important issues at stake in the coming tax fight, but at the heart lies this question: Will we once again cut taxes for the rich, or will we raise taxes on the rich to help the rest of society and the overall economy? The answer to that question will have an outsized impact on the U.S. economy for decades to come.
Did you find this content informative and engaging? Get updates and stay in tune with U.S. economic inequality and growth!
Yesterday was the third and final day of the 2025 annual meeting of the Allied Social Science Associations, which is organized by the American Economic Association. The 3-day conference, held in San Francisco, California, this year, features hundreds of sessions covering a wide variety of economics and other social science research. Equitable Growth’s vast academic network, including grantees and Nonresident Scholars, and our Steering Committee are well-represented throughout this year’s program, featured in at least 62 different sessions of the conference.
Below are lightly edited abstracts from some of the papers and presentations that caught the attention of Equitable Growth staff during the third day of this year’s conference, with links to the sessions in which the papers were presented. Many of these papers are closely related to the research areas we are interested in funding.
Christopher S. Carpenter, Vanderbilt University; Lucas Goodman, U.S. Department of the Treasury; Maxine Lee, San Francisco State University
Abstract: We provide the first evidence on transgender earnings effects in the United States using administrative data on more than 55,000 individuals who changed their gender marker with the Social Security Administration and had gender-consistent first name changes on tax records. The transgender sample has increased in size over time and has younger female-to-male than male-to-female transitions, both consistent with true gender affirmations. A within-person panel design and a siblings design both return evidence of a transgender earnings penalty of 6 to 12 log points.
Nisha Chikhale, University of Wisconsin-Madison, Equitable Growth grantee; Natalie Duncombe, University of Wisconsin-Madison; Birthe Larsen, Copenhagen Business School
Abstract: We document new facts about the sources and consequences of sexual harassment in the workplace using administrative and survey data from Denmark. We estimate that following workplace sexual harassment, victims see earnings losses. Losses are higher when workplace harassment is due to co-workers rather than clients and for those who move jobs. We also find that labor market tightness plays a key role in an individual’s ability to escape workplace sexual harassment. We then incorporate workplace sexual harassment into a labor search model and examine the degree to which labor market friction affects the cost of workplace sexual harassment. We use the model to analyze policies targeted at reducing workplace sexual harassment in the presence of labor market frictions.
Note: This research was funded in part by Equitable Growth.
Dmitri Koustas, University of Chicago, Equitable Growth grantee; Michael Weber, University of Chicago, Equitable Growth contributing author; Constantine Yannelis, University of Chicago
Abstract: Government statements about future actions can influence agents’ economic choices today. How do beliefs about future government policy affect households’ borrowing, spending, and debt-paydown behavior? We study this through the lens of student loan forgiveness, which, following electoral promises, was announced in 2022 but never implemented due to judicial rulings. We conduct a novel survey eliciting beliefs about future debt forgiveness and repayment. We document considerable heterogeneity in beliefs and show that households act on these beliefs: Those most optimistic about future forgiveness are less likely to make student loan payments. They also delay durable purchases, consistent with optimistic households waiting for uncertainty to resolve. Our results provide micro-evidence on the role of policy uncertainty in household decision-making and have implications for forward guidance through fiscal policy.
Abstract: Displaced workers experience long spells of unemployment and persistent changes in their earnings, compared to nondisplaced workers. Analyzing the effects of involuntary job separation on labor market outcomes has drawn the attention of labor economists and policymakers for decades, and prior research has studied this matter extensively. Most research in this area has focused on men or briefly discussed women’s experiences. Yet the effects of job loss are more severe and long-lasting for women. On the other hand, not many studies focus on the gender disparities in the earning losses after job displacement, and none of them investigate the gender inequality in the distribution of earning losses after involuntary job loss in the United States. Distributional treatment effect analysis is important to understand how men and women respond differently across the earning distribution to a labor market shock such as job displacement. It can also be helpful to learn more about gender inequality in the labor market more broadly. Displaced workers at the top of the earnings distribution may not experience the same loss as those at the lower tail. A significant negative impact at the higher end indicates reduced wages for displaced workers finding similarly high-paying jobs, while a pronounced effect at the lower end signals a risk of prolonged unemployment or low-wage work. This study analyzes gender differences in the distribution of earning losses upon job displacement and answers how women’s responses vary across the earning distribution, compared to men, and how decomposing this gap enhances our understanding of gender inequality in the labor market. We extend the job displacement analysis by estimating the distributional effect on weekly earnings for U.S. women to capture heterogeneity across the earnings distribution. The second contribution focuses on the gender disparity in earnings loss distribution among displaced men and women.
Randall Akee, University of California, Los Angeles, Equitable Growth grantee; Maggie R. Jones, U.S. Census Bureau; Emilia Simeonova, Johns Hopkins University
Abstract: The effects of public policy on intergenerational social and economic mobility in the United States are not well-understood. We study how the largest federal tax-based policy intended to promote work and increase incomes among the poor—the Earned Income Tax Credit—affects the socioeconomic standing of children who grew up in households affected by the policy. Using the universe of tax filer records for children linked to their parents and demographic and household information from Census demographic data, we exploit exogenous differences by children’s ages in the births and “aging out” of siblings to assess the causal effect of EITC generosity on child outcomes—specifically, upward mobility in the child income distribution. Our findings suggest significant and mostly positive effects of more generous EITC refunds on the next generation that vary substantially depending on the age at first exposure to increased Earned Income Tax Credits and the duration of exposure. Evidence also suggests that exposure to more generous EITC refunds strengthens labor force attachment.
Sean Wang, U.S. Census Bureau; Samuel Young, Arizona State University, Equitable Growth grantee
Abstract: In this paper, we estimate which individuals benefit when firm demand increases and whether these are the same individuals who bear the costs when firms do poorly. We use novel linked worker-owner administrative data from the United States. Specifically, we use data covering the universe of pass-through firms in the United States to identify each firm’s workers and owners and measure their total compensation from the firm. We link these data to quasi-experimental, firm-specific demand shocks to estimate the distributional effects of these shocks. This analysis extends our understanding of how demand shocks affect workers and owners in three ways. First, by observing who receives each dollar of firm surplus, we open the black box of who the owners are and analyze the full distributional impact of firm-specific demand changes. For example, we calculate the share of the gains from these shocks that goes to each part of the income distribution. Second, the linked worker-owner data allows us to analyze whether the unequal distributional effects of demand changes are symmetric for positive versus negative shocks. Specifically, we analyze whether owners also bear most of the risk of negative shocks. Third, since we can identify all workers and owners, we test for asymmetry in which demographic groups bear the benefits and costs of demand changes (e.g., by race/ethnicity and gender). (Results pending Census disclosure)
Note: This research was funded in part by Equitable Growth.
Matthew Johnson, Duke University, Equitable Growth grantee; Nicholas Bloom, Stanford University; David Levine, University of California, Berkeley, Equitable Growth grantee; Alison Pei, Duke University
Abstract: Workplace injuries are a massive economic burden, yet they persist across a wide range of workplaces. Why? Reducing injury risk entails financial and opportunity cost, but it may also require adoption of management practices that are slow to diffuse. Linking confidential data from the Census Bureau with data on workplace injuries, we find that establishments with more structured management practices (monitoring production, setting targets, and establishing incentives) have substantially lower injury rates—a relationship that holds within industries and within establishments over time. We then examine how this variation in management influences the effects of government safety regulations on workers and firms. Enforcement inspections by the Occupational Safety and Health Administration reduce injuries but only at establishments with few structured management practices; the effect on well-managed workplaces is statistically indistinguishable from zero. Inspections also lead establishments to adopt more structured management practices. Inspections have no detectable effect on establishment survival, investment, or productivity.
Yesterday was the second day of the 2025 annual meeting of the Allied Social Science Associations, which is organized by the American Economic Association. The 3-day conference, held in San Francisco, California, this year, features hundreds of sessions covering a wide variety of economics and other social science research. Equitable Growth’s vast academic network, including grantees and Nonresident Scholars, and our Steering Committee were well-represented throughout this year’s program, featured in at least 62 different sessions of the conference.
Below are lightly edited abstracts from some of the papers and presentations that caught the attention of Equitable Growth staff during the second day of this year’s conference, with links to the sessions in which the papers were presented. Many of these papers are closely related to the research areas we are interested in funding.
Check out highlights from Day 1 here and come back tomorrow morning for highlights from Day 3.
Gordon Hanson, Harvard University and National Bureau of Economic Research, Equitable Growth Working Paper Series contributor; Dani Rodrik, Harvard University and National Bureau of Economic Research, Equitable Growth Working Paper Series contributor; Rohan Sandhu, Harvard University
Abstract: Industrial and place-base based policies are back in vogue. In the United States, local, state, and federal government actors have expanded efforts to recruit large companies, invest in low-income communities, promote small business, and train workers. Although recent literature provides causal analysis of specific policy interventions, we still know little about the overall design and implementation of industrial and place-based policies, the magnitude and targeting of policy resource flows, and the coordination of policies across levels of government. Using newly constructed data on industrial and place-based policies in the United States over the past 25 years, we chart policy resource flows across industries and regions, identify the local, state, and federal actors that manage the flows, and estimate the implied policy functions that allocate the flows. Although there is wide regional variation in policy experimentation, funding for most policies tends to concentrate in already-successful regions. This outcome appears to be the result of the fragmentation of policy responsibility across government agencies and federal spending rules that effectively penalize regions with low administrative capacity.
Abstract: Recent wage growth at the bottom of the earnings distribution in the United States has reversed a decades-long trend of widening wage inequality. Numerous state and local minimum wage increases have overtaken an increasingly nonbinding federal minimum wage, and robust labor demand in the post-pandemic recovery drove substantial wage growth in the low-wage sector. An increasingly pervasive phenomenon during this period is the use of voluntary, companywide minimum wages by private employers, including some of the largest retailers in the United States. We use administrative payroll data to study the effects of large retailer voluntary minimum wages since 2014 on their own wages and employment, as well as spillover effects on other employers. Voluntary minimum wages result in sizable wage increases and reductions in turnover at the companies that implement them. Despite the decline in separations from companies with voluntary minimum wages, overall hiring rates at other companies do not decline, and wages at other companies do not increase. Thus, while voluntary minimum wages have affected more than 3 million jobs among the largest retailers with policies, their impact on the broader market is limited.
Note: This research was funded in part by Equitable Growth.
Won Fy Lee, First 5 California; Aaron Sojourner, W.E. Upjohn Institute, Equitable Growth grantee; Elizabeth Davis, University of Minnesota, Equitable Growth grantee; Johnathan Borowsky, University of Minnesota, Equitable Growth grantee
Abstract: Workforce participation among mothers with children under the age of 6 has increased in recent decades, with about 7 in 10 mothers participating in the labor force in 2022. Despite the need for accessible child care services, a significant majority of families with young children find themselves residing in what has been called a child care desert. Regulations tend to increase child care quality at the cost of the quantity of slots, disproportionately impacting local markets with higher concentrations of low-income parents. Building upon previous research, this study aims to estimate the effects of child care regulations on child care market supply using a different methodology than prior work. Variation in state licensing regimes makes comparisons across states based on public licensing data challenging to interpret. Instead, to get a nationwide, cross-state consistent measure of provider locations and sizes, this study uses a Dunn and Bradstreet provider panel from 2011 to 2017. It is combined with state-year regulation policy data sourced from the National Association for Regulatory Administration’s Child Care Licensing Programs and Policies Survey. The survey allows us to create a composite index of regulatory stringency based on multiple dimensions of regulation, including building/environmental safety, teacher-to-child ratio, teacher quality, training requirements, and so forth. This paper exploits policy discontinuity around state borders and uses a regression discontinuity design framework to investigate how differing levels of regulatory stringency impact supply in geographically proximate regions.
Andrew Weaver, University of Illinois-Urbana-Champaign; Richard Benton, University of Illinois-Urbana-Champaign
Abstract: The question of what impact finance and financial processes have had on the structure and quality of jobs has attracted increased attention in recent years. Some analysts have argued that financial pressures and financialized management strategies, often referred to by the general term financialization, have led to firms adopting a short-term orientation in which fewer investments are made in human capital and job quality is diminished. At the same time, some researchers have defended the impact of financial processes and investors on employment. In this study, we examine the relationship between prior financialization events and job quality using nationally representative surveys focusing on three target industries: computer/engineering services, retail, and computer/electronic manufacturing. We pair this original survey data with financial data from Capital IQ. The results show considerable heterogeneity by industry. We draw policy-relevant lessons for the relationship between financial activities and establishment-level job characteristics.
Tatiana Homonoff, New York University; Jacob Goldin, University of Chicago; Neel Lal, University of Chicago; Ithai Lurie, U.S. Department of the Treasury; Katherine Michelmore, University of Michigan, Equitable Growth grantee; Matthew Unrath, University of Southern California
Abstract: The largest tax-based social welfare programs in the United States limit their benefits to taxpayers with labor market income. Eliminating these work requirements would better target transfers to the neediest families but risks attenuating tax-based incentives to work. We study changes in labor force participation from the elimination of a work requirement in a tax credit for parents of young children, drawing on quasi-random variation in birth timing and administrative tax records. To do so, we develop and implement a novel approach for selecting an empirical specification to maximize the precision of our estimate. The unique design of the policy along with its subsequent reform allow us to isolate taxpayers’ sensitivity to conditioning child tax benefits on work—the parameter at the center of recent debates about the labor supply consequences of reforming federal tax policy for children. We estimate a precise null result, with a 95 percent confidence interval excluding labor supply reductions of one-third of a percentage point or greater. Our results suggest expanding tax benefits for low-income children need not meaningfully reduce labor force participation.
Micah Villarreal, University of California, Santa Barbara, Equitable Growth grantee
Abstract: Can temporary windfalls narrow racial wealth disparities? Can they address other racial inequalities? In this project, I leverage quasi-random oil discoveries on Black-owned land in the early 1900s to study how large positive wealth shocks may have affected Black economic progress in the short and long-term. In preliminary work, I find that wealth has a positive effect on the human capital of the first generation. Landholders who find oil are more geographically mobile and select into higher-status occupations. Work on longer-term outcomes, including intergenerational outcomes, is still in progress.
Note: This research was funded in part by Equitable Growth.
Lena Song, University of Illinois-Urbana-Champaign, Equitable Growth grantee
Abstract: Product positioning is a crucial strategic decision for firms. Using a novel dataset of all commercial radio stations across the United States, I study the positioning choices of radio stations and their profitability in the post-war Jim Crow era. There was less content available for Black audiences, compared to White audiences, while stations offering more programming for Black audiences were significantly more profitable. Similar patterns are not observed for stations with foreign-language programming. Viewed through the lens of an entry model, these results suggest that firm-owner discrimination may influence product positioning in the media market.
Note: This research was funded in part by Equitable Growth.
Felipe del Canto, PUC-Chile; John Grigsby, Princeton University; Eric Qian, Princeton University; Connor Walsh, Columbia Business School, Equitable Growth grantee
Abstract: We develop a framework to measure the welfare impact of inflationary shocks throughout the distribution. The first-order impact of a shock is summarized by the induced movements in agents’ feasible sets: their budget constraint and borrowing constraints. To measure this impact, we combine estimated impulse response functions with microdata on household consumption bundles, asset holdings, and labor income for different U.S. households. We find that inflationary oil shocks are regressive, but monetary expansions are progressive, and there is substantial heterogeneity throughout the life cycle. In both cases, the dominant channel is the effect of the shock on the cost of accumulating assets, not movements in goods prices or labor income.
Hunt Allcott, Stanford University; Joseph S. Shapiro, University of California, Berkeley; Felix Tintelnot, University of Chicago
Abstract: We provide the first ex-post microeconomic welfare analysis of a central component of the Inflation Reduction Act, the largest climate change policy in U.S. history. The act reshaped electric vehicle tax credits by merging elements of environmental and trade policies through “Buy American” domestic content requirements. Over the law’s inaugural year, we analyze these credits’ pass-through to consumer prices and their impacts on vehicle registrations, domestic content, environmental externalities, and social welfare. Our event study analyzes exploit changes in credit eligibility, and the resulting estimates provide moments to identify and estimate an equilibrium model of new vehicle markets. Four conclusions emerge. First, transaction prices for vehicle purchases and lease contract terms imply large and possibly complete pass-through of credits to consumers. Second, the EV credits had muted effects on EV registrations. Third, supply constraints and a leasing loophole contribute to the modest registration impact and also to a nearly unchanged market share of electric vehicles produced in the United States. A removal of the leasing loophole would increase the U.S. assembly share of sold electric vehicles by 6 percentage points. Fourth, the Inflation Reduction Act’s electric vehicle credits modestly decrease social welfare, with an estimated benefit/cost ratio of 1/3, since the credits’ fiscal costs exceed their associated environmental benefits.
Kyle Moore, Economic Policy Institute, Equitable Growth grantee and former Dissertation Scholar
Abstract: This study will investigate the relationship between parental union membership and the contemporary wealth and health outcomes of children in adulthood across race using the 2022 Panel Study of Income Dynamics. The working hypothesis is that parental union membership would have a protective effect on wealth and health for children through three pathways: an intergenerational transmission of union membership, and a positive contemporary effect of union membership on wealth and health outcomes; a positive effect of union membership on contemporary wealth through its positive effect on parental wealth and the intergenerational transmission of wealth; and a protective effect of union membership on contemporary health through the protective effect of parental wealth on contemporary health. Of particular interest is whether the effects of parental union membership on contemporary wealth and health differ for Black and White adults.
Yesterday was the first day of the 2025 annual meeting of the Allied Social Science Associations, which is organized by the American Economic Association. The 3-day conference, held in San Francisco, California, this year, features hundreds of sessions covering a wide variety of economics and other social science research. Equitable Growth’s vast academic network, including grantees and Nonresident Scholars, and our Steering Committee are well-represented throughout this year’s program, featured in at least 62 different sessions of the conference.
Below are lightly edited abstracts from some of the papers and presentations that caught the attention of Equitable Growth staff during the first day of this year’s conference, with links to the sessions in which the papers were presented. Many of these papers are closely related to the research areas we are interested in funding. Equitable Growth also was excited to organize our own session this year, on “Discrimination in Economics and the Labor Market,” which took place on Day 1 of the conference.
Come back tomorrow morning for highlights from Day 2 and Monday morning for highlights from Day 3.
Robert Hahn, University of Oxford; Nathaniel Hendren, Massachusetts Institute of Technology, Equitable Growth grantee; Robert Metcalfe, University of Southern California; Ben Sprung-Keyser, Harvard University
Abstract: What are the most effective ways to address climate change? This paper extends and applies the marginal value of public funds framework to help answer this question. We examine more than 50 U.S. environmental policy changes studied over the past 25 years. These policies span subsidies (wind, residential solar, electric and hybrid vehicles, vehicle replacement, appliance rebates, weatherization), nudges (marketing and energy conservation), and revenue raisers (fuel taxes, cap and trade). For each policy, we draw upon quasi-experimental or experimental evaluations of causal effects and translate those estimates into an marginal value of public funds. We apply a consistent translation of these behavioral responses into measures of their associated externalities and valuations of those externalities. We also provide a new method for incorporating learning-by-doing spillovers. The analysis yields three main results. First, subsidies for investments that directly displace the dirty production of electricity, such as production tax credits for wind power and subsidies for residential solar panels, have higher marginal values of public funds (generally exceeding 2) than all other subsidies in our sample, with values generally around 1. Second, nudges to reduce energy consumption have large welfare gains (marginal values of public funds of more than 5) when targeted to regions of the United States with a dirty electric grid. By contrast, policies targeting areas with cleaner grids, such as California and the northeast, have substantially smaller marginal values of public funds (often less than 1), despite larger treatment effects in those areas. Third, gas taxes and cap-and-trade policies are highly efficient means of raising revenue (with marginal values of public funds less than 0.7) due to the presence of large environmental externalities. We contrast these conclusions with those derived from more traditional cost-per-ton metrics used in previous literature.
Abstract: Many universities and companies use diversity scholarships and awards for impression management and recruiting purposes. In contrast to race-conscious affirmative action measures, these contemporary diversity initiatives emphasize merit and conceptualize contributions to diversity in a broad, colorblind manner. Diversity initiatives can enhance organizational status and reputation, but less is known about how these signals are perceived when they are associated with individuals. This paper investigates the reputational effects of diversity scholarships for male college graduates seeking entry-level jobs. Using a national audit study (N = 3,456), I compare the rate at which employers call back applicants with diversity merit scholarships, applicants with merit scholarships that do not mention diversity, and applicants without scholarships. I also examine how award signals differ when applicant names have Black racial cues versus White racial cues. I find that diversity and nondiversity merit scholarships both increase call-back likelihood for putatively White applicants, but putatively Black applicants receive no reputational benefits from either type of award. Accompanying survey experiments probe possible mechanisms, such as the perceived selectivity of diversity awards and racial status threat. Overall, results suggest that uneven reputational gains from symbolic awards can exacerbate existing racial discrimination, and that status-based cumulative advantage processes may differ for demographic groups.
Note: This research was funded in part by Equitable Growth.
Leonid Kogin, Massachusetts Institute of Technology; Dimitris Papanikolaou, Northwestern University; Larry Schmidt, Massachusetts Institute of Technology; Bryan Seegmiller, Northwestern University, Equitable Growth grantee
Abstract: We develop measures of labor-saving and labor-augmenting technology exposure using textual analysis of patents and job tasks. Using U.S. administrative data, we show that both measures negatively predict earnings growth of individual incumbent workers. While labor-saving technologies predict earnings declines and higher likelihood of job loss for all workers, labor-augmenting technologies primarily predict losses for older or highly paid workers. Yet we find positive effects of labor-augmenting technologies on occupation-level employment and wage bills. A model featuring labor-saving and labor-augmenting technologies with vintage-specific human capital quantitatively matches these patterns. We extend our analysis to predict the effect of AI on earnings.
Nirupama Rao, University of Michigan, Equitable Growth grantee and Nonresident Scholar; Max Risch, Carnegie Mellon University, Equitable Growth grantee
Abstract: A common concern surrounding minimum wage policies is their impact on independent businesses, which are feared to be less able to either bear or pass on cost increases. We examine how independent firms accommodate minimum wage increases along product and labor market margins using a new matched owner-firm-worker panel dataset drawn from the universe of U.S. tax records over a 10-year period. We find that, on average, firms in highly exposed industries do not substantially reduce employment but instead fully finance the added labor costs with new revenues. Among surviving firms, we even observe small average increases in owner profits. We show, however, that these average gains belie significant heterogeneity by industry and productivity. Among restaurants, the most acutely impacted industry, the minimum wage causes firm exits. Exits are concentrated among the least productive small firms, while the observed profit gains stem from the more productive surviving small restaurants. These findings are consistent with a model of Cournot competition with heterogeneous productivity and fixed production costs. The cost shock and resulting exits winnow the productivity distribution of surviving and entrant firms with demand and workers reallocated to more productive survivors. Following low-earning and young workers, we find that their earnings increase on average, they are no less likely to be employed, and their turnover rates decline when minimum wages rise.
Note: This research was funded in part by Equitable Growth.
Konstantinos Gavriilidis, University of Stirling; Diego Kaenzig, Northwestern University; Ramya Raghavan, Northwestern University; James H. Stock, Harvard University
Abstract: Recent years have seen a lot of uncertainty about the future path of climate policy. How does this uncertainty affect the economy and the environment? In this paper, we construct a new measure of climate policy uncertainty based on newspaper coverage. Our index spikes near important events related to climate policy, such as major developments in emissions legislation, presidents’ statements about climate policy, or global strikes about climate change, among other developments. We find that climate policy uncertainty has significant macroeconomic effects: Increased uncertainty leads to a significant fall in industrial production, and thus emissions, and an increase in unemployment. Importantly, it also causes an increase in commodity and consumer prices. Thus, climate policy uncertainty shocks transmit to the economy as supply shocks. This stands in stark contrast to other uncertainty shocks, which have been found to propagate as aggregate demand shocks.
Anna Stansbury, Massachusetts Institute of Technology, Equitable Growth grantee; R. Jisung Park, University of Pennsylvania, Equitable Growth grantee; Michael Davies, Massachusetts Institute of Technology
Abstract: Using the universe of workers’ compensation claims from California between 2001 and 2020, we investigate the impacts of state and local minimum wage increases on injury rates. Using a variety of empirical strategies, we estimate that increased minimum wages increased workplace injury rates for affected low-wage workers. These increases were particularly large in injury types consistent with repetitive motion or repetitive strain, suggestive of work intensification as a mechanism.
Manasi Deshpande, University of Chicago, Equitable Growth grantee; Alessandra Voena, Stanford University; Jason Weitze, Stanford University
Abstract: We use three sources of variation in childhood Supplemental Security Income receipt to identify the effects of receiving these benefits in childhood on adult outcomes and the channels through which these effects operate. We find heterogeneous effects of Supplemental Security Income that vary with the parental earnings response to SSI benefits: Supplemental Security Income has positive effects on children when parents do not adjust their labor supply in response to SSI income but has zero or negative effects on children when parents reduce their earnings in response to SSI income. These results suggest that consumption is important in human capital production, relative to parent time. We estimate a model of maternal labor supply and child human capital formation to decompose the effect of Supplemental Security Income into channels and quantify the relative importance of those channels. Our findings indicate that the income effects of Supplemental Security Income on children’s human capital are substantial, while the perverse incentive effects are relatively small, and that parent work, on net, improves children’s outcomes by increasing household consumption, despite the potential decrease in parental time.
Abstract: Drawing on work spanning economics, public health, education, sociology, and law, I formalize theoretically what makes systemic discrimination “systemic.” Injustices do not occur in isolation but within a complex system of interdependent factors, and their effects may amplify as a consequence. I develop a taxonomy of these amplification mechanisms, connecting them to well-understood concepts in economics that are precise, testable, and policy oriented. This framework reveals that these amplification mechanisms can either be directly disrupted or exploited to amplify the effects of equity-focused interventions instead. In other words, it shows how to use the mechanics of systemic discrimination against itself. Real-world examples discussed include but are not limited to reparations for slavery and Jim Crow, vouchers or place-based neighborhood interventions, police shootings, affirmative action, and COVID-19.
Jason Sockin, IZA Institute for Labor Economics; Aaron Sojourner, W.E. Upjohn Institute, Equitable Growth grantee
Abstract: In theory, binding minimum wage increases may lead employers to offset new wage costs by reducing their provision of nonwage job amenities in order to keep the value of the job positive for both parties while retaining employees. Empirically, we have little evidence of adjustment along nonwage margins, in particular nonpecuniary ones. This study harnesses standardized measures of job satisfaction, wage, and nonwage amenities available across millions of workers over the past decade collected by Glassdoor, a job review website. We analyze how workers’ reviews change in response to minimum wage hikes.
Jessica Forden, The New School; Anastasia Wilson, Hobart and William Smith Colleges
Abstract: Growing demand for home and community-based long-term services and supports has attracted private-sector investments to the direct care sector. Limited literature suggests increased concentration and private equity are key trends to consider. This paper adds to the nascent literature by providing a mapping of the current landscape of the direct care services industry, with a focus on understanding the recompositioning of the sector among private-sector players and current trends in private equity leveraged buyouts, mergers, and acquisitions. Through examination of trade publications, private financial markets data, and individual interviews, we consider the impact of these industry shifts on the flow of public funds to direct care workers and on the impacts to working conditions, worker power, and the labor process.
It is hard for policymakers to ignore today’s “AI arms race” and the public debate on the economic and social significance of generative artificial intelligence. The discourse is fueled in part by dramatic advances in the technology, as well as competingnarratives on AI’s likely trajectory and how much its impact on the economy and society will ultimately matter.
Many companies espouse generative AI’stransformationalbenefits, while technology accountability groupswarn of its dangers—bothrealized andexistential, as well asecological. What is more clear is that AI-driven technologies are being produced largelyoutside the purview of public authorities and academic research institutions.
Whether the current excitement over generative AI fades should developers and users discover that itsdrawbacks are insurmountable or governments and firms prove unwilling to overcome computing and data constraints, AI-enabled firmscurrently are poised to upend not only the tech industry in the United States butalso wide swaths of our nation’s workforce across sectors. This uncertain landscape leaves policymakers unsure of how to effectively govern technology that is increasingly embedded into our digital and social infrastructure or, more fundamentally, how to reliably assess its current and future impact on the U.S. economy and society.
Past technologies are not a clear guide for forecasting the potential effects of generative AI. Yet many current policy challenges—with media disinformation, election security, and data privacy, to name a few—stem from the failure to thoughtfully regulate digital products emerging from a tech industry known for its “move fast and break things” mentality. So far, that industry, with its considerable resources, continues to dominate research and development on AI, leaving many critical questions either unaddressed or unanswered.
Indeed, massive investments in new AI applications, spurred by advancedcomputing power butdependent on larger tech companies’ capital and infrastructure, mean that only firms that already dominate the Fortune 100 boast the capacity to conduct the most powerful, novel research. In contrast, public research institutions face entry barriers in a resource-intensive space and are disadvantaged when competing with the tech sector for talent.
Furthermore, tech lobbyists that predominately represent larger companies are racing to fill in knowledge gaps in Washington. In the absence of comprehensive federal legislation, AI firms have largely been left toself-regulate and, at best, adopt voluntary standards.
That said, there are broad efforts afoot to understand howto structure regulatory guardrails and economic incentives that steer AI innovation toward the public good. Executive orders from 2019 and 2023 attempt to navigate the known bureaucratic challenges of tech governance at the federal level, though it is too early to evaluate their effectiveness and impacts. There also are efforts at the state and local levels that are mostly focused on privacy, surveillance, and transparency in AI development, as well as on the high-risk use of AI affecting consumers with regard to housing, health care, and employment.
Policymakers need a common knowledge base to govern complex, rapidly evolving, and widely applicable system AI systems, and they should not have to rely solely on evidence provided by the corporations commercializing this new technology. To help fill this knowledge gap, independent researchers must play a critical role in creating evidence-based frameworks and resources to guide current policy implementation and spur policy innovation.
This issue brief takes stock of what we already know about AI and its economic and social impacts to discern how researchers can best support policymakers in ensuring that the benefits of AI are broadly realized and shared. It will also detail the known and potential harms of AI to workers, communities, and the broader U.S. economy, so that those effects are mitigated efficiently and equitably. We close with a series of recommendations that call for policymakers to:
Broaden the sources of independent research and analysis and not rely solely on dominant tech firms for information on AI
Approach governance with both flexibility and sensitivity to specific sectors and uses of technology
Advance policies that address underlying uncertainty and anxiety caused by economic inequalities that could be prolonged or exacerbated by AI
In these ways, leaders can embrace AI policymaking that promotes competitive and innovative markets, drives economic productivity, and supports workers while addressing the structural inequalities exacerbated by AI-driven technologies.
An emerging understanding of AI and its impacts
Underpinning an emerging base of knowledge on artificial intelligence, which has been around for years but only recently has made some notable advances, are definitions that continue to vary across fields and purposes and will need to be updated to reflect technological shifts. Our society’s understanding of AI is partly based on past technological impacts on the economy and projections of a theoretical future AI, compared to AI as it currently exists—AI that is neither “magical” nor “sentient.”
Today, AI systems areviewed by some as novel, distinct technologies that will become a general purpose technology, much like electricity, affecting all sectors of the U.S. economy. Opinions vary on the scale and speed of its development, as well as the nature and scope of its impacts on the U.S. economy and our society. “The actual state of the technology seems like the biggest source of uncertainty, rather than the effects of its most extreme form,” observes Daron Acemoglu, a Massachusetts Institute of Technology economist and an Equitable Growth Steering Committee member. Acemoglu argues that the effects of AI are not so different from past eras of technological change or even current ones, such as still-rising automation, when problems of inequality, stagnation, and unemployment were and continue to be as much a function of policy choices and power dynamics in the U.S. economy as they are of scientific progress.
In our view, a useful set of definitions come from Stanford University’s Human-Centered Artificial Intelligence Institute, which helps to distinguish between AI, components or specific types of AI, and terms sometimes used interchangeably with AI by nontechnical audiences.
We also can look to Executive Order 14110, issued in 2023, as a resource on AI across the federal government. This executive order:
Defines artificial intelligence as a machine-based system that can, for a given set of machine- and human-based objectives, make predictions, recommendations, or decisions influencing real or virtual environments in an automated manner
Defines an AI model as something that “implements AI technology and uses computational, statistical, or machine-learning techniques to produce outputs from a given set of inputs”
Classifies generative AI as a class of AI models that emulate the structure and characteristics of input data to generate derived synthetic content, including images, videos, audio, text, and other digital content
Additionally, the White House Council of Economic Advisers’ 2024 report (on page 246) describes how data/inputs, algorithms, and computing power are used to “train” a predictive AI model that interacts with traditional automation in order to produce an action that emulates human-derived creativity and output. (See Figure 1.)
Figure 1
While our national data infrastructure must be modernized to be able to properly measure the state of AI and evaluate AI policies and programs, government agencies and academics have started to tackle how to reliably measure the actual state of AI diffusion in the economy.
In addition, economists have been calling for more analysis of the macroeconomic impacts of AI. The reason: AI-induced economic growth is likely to be heavily dependent on the rate at which that growth continues to produce new innovations rather than simply by virtue of ever-increasing computational or data resources.
As we navigate this transformative era, policymakers will need a working set of metrics for how to wholistically evaluate the impact of AI on the productivity of firms and workers, on the well-being of workers and communities, and on inequality, market competition, innovation, and other critical indicators. A central political and cultural challenge will be how to center worker and competition concerns in an area dominated by national security and financial interests.
Let’s now consider these key policy areas briefly in turn and the evidence gaps that policymakers face in each area.
Competition challenges in the face of AI
There is an economic upside for policymakers to take a proactive approach to regulating an upstart and strategic industry such as AI: Doing so can promote efficiency and consumer benefits, reduce costs of enforcement, and increase incentives for new firms to enter the AI marketplace. But this approach will be tricky to navigate.
Historically risk-averse antitrust and procurement bodies need to more closely scrutinize how AI adoption is changing the competition dynamics within and beyond digital markets. At the same time, there are geopolitical incentives for the United States to be a leader in AI, which makes it challenging for policymakers who see the merit in competition in the long term but do not want to be seen as putting restrictions on innovation, domestic market growth, and a competitive edge over other countries.
For policymakers to right-size their regulatory efforts, it is critical to understand the unique costs and barriers to the adoption of AI, why the AI sector is dominated by just a handful of major technology firms in the United States, and why it is particularly susceptible to “market failure” (antitrust parlance for allowing monopolies to form to the detriment of robust competition and consumers). Because of the new technology’s voracious need for computing power and data collection, thehigh costs of ensuring the quality of the inputs and outputs of AI products and services, and the limited supply of technical labor, large firms are more able to invest in producing and adopting AI models, while taking on certain risk and liabilities from investing in a novel technology.
This intense market concentration has, in turn, resulted inpower imbalances andaccusations of monopolistic behaviors, and antitrust authorities around the world have expressed concern with the scaling market power of dominant firms. Policymakers need new frameworks and tools, as well as more in-house and external technical expertise, to properly discern whether and how the well-documented negative consequences of reduced competition—including higher prices, higher inequality, and lower rates of innovation—apply in the AI context and if the current regulatory landscape can adequately address this challenge.
Currently, basic supply chain mapping of artificial intelligence is nonexistent, and a more nuanced understanding of the flow of capital and investments could provide insight into how markets are taking shape and where policymakers should focus their attention. Since traditional tools may be insufficient to meet the speed of technological progress and existing levels of concentration, researchers and policymakers also should consider the proposals for enhanced data disclosure, public investments and public-private partnerships in AI infrastructure and R&D, and digital taxes to address the unique tendency toward concentrated market power in digital markets.
Other questions that need to be broadly answered include:
What regulatory or oversight mechanisms have worked in the technology sector and other industries that can be applied to the AI market?
Do existing firms in the “tech stack” (or the various technologies needed to deploy AI) have too much market power? If yes, what are the implications for workers, innovation, and competition?
What are the investment relationships or partnerships between firms in the AI space, and what are the implications for market structure and competition?
What barriers to entry and network effects (or when the market value of a product or service increases based on the extent of its use) exist that could stifle innovation or competition in the AI market?
What are the relationships between different markets in the tech stack, and what are the implications for market power and structure across various points in the AI supply chain?
AI is already reshaping the U.S. labor market
The growing use of artificial intelligence in the workplace has already had profound consequences for the U.S. labor market. Policymakers are grappling with how best to regulate AI-driven technologies that are used to surveil and manage workers, determine wages, and shape job search and hiring decisions—all of which have implications for data privacy, proprietary interests, safety and health, and workplace organizing, and can lead to bias, discrimination, and other harms. Meanwhile, businesses and researchers are exploring beneficial use cases of AI for workers in caregiving, weather and climate disaster forecasting, and supply chain management.
Researchers have documented how the adoption of AI replicates existing workplace inequalities and threatens workers’ bargaining power. Research also suggests that generative AI—which has been more rapidly adopted at work, compared to past technological changes such as the internet and the personal computer—can improve the productivity of less-skilled employees within an occupation or organization, and flatten firm hierarchies. These effects, at least in the short term, narrow the productivity gap while reducing inequality, without harming higher-skilled workers.
Frameworks for understanding the impact of technology on the labor market using historical data also are available. They include the evolution of economic thought on the impact of technological change in the labor market, the role of automation in workplaces, and how unions can moderate the impacts of automation. Several policy research and grassroots groups are actively engaged in collecting data and sharing policy resources for tech accountability and workplace protections. Yet there is limited nonindustry analysis on which jobs and demographics would be most exposed to AI deployment and how those impacts will complement the existing U.S. labor force and substitute AI for workers.
Then, there is the necessary work to be done in scenario planning. This includes updating social programs to offset the workforce implications of more disruptive AI and what kind of investments in human capital and workforce training would best serve a more AI-reliant U.S. economy, while also ensuring opportunity and security for those displaced by technological changes.
Policymakers will require a clear, easy metric of job quality for measuring AI’s impact and its potential role in the growth of “good jobs,” as well as a more sophisticated and innovative suite of tools to ensure worker safety and voice in the adoption of productivity-enhancing AI in the workplace. Questions that need to be broadly answered include:
How are employers deploying artificial intelligence, and for what purposes? Are there notable gaps in employers’ understanding of AI technology that affect how they are using it, and what role do tech vendors play in addressing or not addressing any knowledge gaps?
How do employees perceive the purpose of AI adoption, and do those views converge or diverge from employer perspectives? Can employers learn from employees that may already be engaging with AI tools?
How and why will AI adoption vary across occupations, sectors, and geography?
What institutions, including and beyond unions, are associated with successful mediation of how AI is being adopted and deployed?
How will AI adoption impact bargaining power, health, safety, productivity, authority, job satisfaction, and other measures of worker well-being?
Conclusion and key takeaways for policymakers
AI is developing without the infrastructure to ensure the gains from its transformative growth are broadly shared. Already, serious harms and risks with AI technologies are growing and wide-ranging. While we are in the early days of understanding the myriad ways that artificial intelligence will change the U.S. economy and society, our nation is behind in investing in credible research and policy resources to help policymakers navigate this nascent, but fast-growing technology.
What’s more, the loss of the Chevron deference—the decades-long legal precedent arguing that government agencies could interpret and enforce congressionally enacted legislation, which the U.S. Supreme Court earlier this year struck down—means that there is an urgent need for more sophisticated technical knowledge within regulatory agencies. Without comprehensive federal AI legislation and public investments, tech and financial companies with a documented interest in consolidating both market and political power will have greater latitude to challenge new AI regulation and less incentive to invest in socially optimal products.
Policymakers will need new tools, metrics, and research to make both an evidence-backed and compelling case for AI oversight. They can do so in three broad ways.
First, policymakers should broaden the sources for research and analysis, and governments should not cede all the research incentives and opportunities to well-endowed tech firms. Economic analysis is crucial for understanding policy trade-offs and informing policy decisions, and academics can provide solutions to dynamic, complex political and economic challenges posed by AI technologies that are still evolving.
Government agencies should build and leverage relationships with academic institutions to support data building and knowledge sharing, and strategically steward research and development funding toward policy-relevant agendas and innovation that serves the public interest. Government also must continue to invest in the recruitment of technologists who can help modernize its infrastructure and better anticipate how the growing adoption of AI will reshape society.
Second, policymakers must resist a one-size-fits-all approach to AI governance, as cases involving the use of AI are varied and complex and will require different approaches depending on the sector and the technology in question. Some argue that the U.S. market-driven approach has fostered more digital innovation and growth in the tech sector, relative to the EU’s top-down regulatory approach.
Whatever the case, experimentation with policy tools at the federal level—procurement, program administration, and conditional funding for how AI is used in government—can model best practices for AI deployment, guide state- and local-level policy development, and popularize ideas that can turn into future legislation. A more balanced and flexible approach to regulation and government oversight should involve collaboration between government, industry, labor and civil society, and international partners to help address specific risks while allowing for continued and beneficial innovation.
Third, policies to govern AI should not only be reactive, but rather should also leverage this moment of existential concern to address underlying uncertainty and anxiety caused by economic inequalities. One recent survey shows the general public and workers are aware of and concerned about the deployment of AI and are acting on those attitudes. Another survey shows that an overwhelming majority of Americans believe that powerful technologies should be carefully regulated.
How policymakers handle AI in the next few years will inform the potential role of the government in steering technological development for the public interest in other promising, economically critical industries, such as advanced robotics and quantum computing. Policymakers should reject the false binary choice between innovation and equity, and act on a positive vision of AI that supports both productivity and workers, while addressing the structural inequalities exacerbated by AI-driven systems.
Did you find this content informative and engaging? Get updates and stay in tune with U.S. economic inequality and growth!
Businesses that are organized as so-called pass-through entities for tax purposes—meaning their profits show up on the owners’ personal tax returns rather than on an entity-based tax return—pay a lower federal income tax rate than if those businesses were organized as more traditional corporations. That is the clear finding of new research from experts at the U.S. Department of the Treasury, who used actual tax data from a representative sample of so-called S corporations from 2018 through 2021 to study this question. Importantly, the researchers find that these lower tax rates would still be true even if a recently enacted special pass-through tax deduction didn’t exist.
These findings are extremely pertinent to the forthcoming tax debate in the U.S. Congress. In particular, a special tax deduction for pass-through businesses that was enacted in 2017 is set to expire next year. That impending expiration has fueled a lot of ongoingdebate over whether traditional C corporations are now paying lower rates than pass-through businesses, especially because the same 2017 tax law dramatically lowered the C-corporate tax rate from 35 percent to 21 percent. That law introduced the new deduction for owners of pass-through businesses, also known as Section 199A, partly in response to criticism that such businesses were being disadvantaged by the very large corporate tax cut.
That new deduction expires after next year, while the lower corporate tax rate does not expire. That situation raises the question that Lucas Goodman, Quinton White, and Andrew Whitten, nonpartisan economists who work at the Treasury Department, have now answered: Are S corporations now at a tax disadvantage? Or would they be at a tax disadvantage if the pass-through deduction expired? The answer to both questions, the authors find, is a resounding “no.”
The three co-authors calculated the actual tax rates paid by a representative sample of actual S corporation tax returns, and then recalculated what their taxes would have been under two alternative scenarios. First, they calculate what their taxes would have been had those S corporations instead been C corporations and therefore subject to the ordinary corporate income tax, as well as the tax that C corporation owners pay on dividends and capital gains. Second, they calculate what their tax rate would have been had there been no special pass-through deduction.
What they find is that, overall, S corporations would have paid more if they had been subject to the C-corporate tax instead, and that would have still been true even if they hadn’t had the pass-through deduction. On average, S corporations actually paid an overall effective income tax rate of about 15 percent. That means that of all the income those businesses generated, only about 15 percent went to paying income taxes. Had those same businesses instead been C corporations and subject to the corporate income tax, their average effective tax rate would have been roughly 10 points higher.
Figure 1
In other words, the average S corporation is getting a 10 percentage point tax benefit from being a pass-through entity—and the special pass-through deduction is only responsible for a part of that tax benefit. In fact, the authors find that without that deduction, the average tax rate for S corporations would be about 19 percent, still 6 points lower than if they were C corporations instead.
Importantly, this finding holds across a wide array of diverse business types and sizes. The average can sometimes mask important variations, but in this case, nearly all S corporations pay lower tax rates, compared to what they would pay if they were C corporations, regardless of their type and size. Whether measuring the size of the business by income or by assets, for example, at every size level, firms paid less because they were S corporations—from very low income and low assets to high income and high assets—and would have still paid less even without the pass-through deduction.
Interestingly, the smallest firms and the largest ones enjoy the biggest tax benefits from being a pass-through entity, while middle-sized firms receive a smaller tax benefit, compared to being organized as a C corporation. This demonstrates that, to the degree that the tax advantages of being a pass-through are intended to help small businesses, those benefits are not very well targeted.
Relatedly, and notably, the U.S. Department of the Treasury study also finds that higher-income business owners are the biggest beneficiaries of the expiring, special pass-through tax deduction. In fact, firms with owners who have an average income of more than $1 million get roughly twice the benefit from the pass-through deduction as firms with owners who have an average income below $100,000. This confirms, with actual tax data, previous analysis suggesting that the pass-through deduction would be extremely regressive—meaning it benefits rich people more than middle-income and low-income people.
The co-authors also find that S corporations paid lower taxes no matter the business sectors in which they compete. Goodman, White, and Whitten separated their sample into six different business sectors to investigate whether the type of business made a difference to their findings. It did not. Across all six sectors, pass-through businesses paid lower tax rates than they would have as C corporations, including under the assumption that the pass-through deduction disappeared.
That’s not to say that there are no examples or situations when S corporations face a higher tax rate than they would have under a more traditional C-corporation structure. The study did find some cases when that occurs or would occur without the pass-through deduction.
For example, the authors separate their sample by the total income of the owners, not just the income of the firm itself. When they looked at the data that way, they find that for owners who had more than $1 million in adjusted gross income, their tax rates are still lower than if their businesses were C corporations, but that they would be slightly higher if the pass-through deductions were gone. That’s not the case for businesses whose owners have an average income of less than $1 million.
This research makes an important contribution to our understanding of how the tax code treats different kinds of businesses. The authors are clear that there are still many questions to be answered. Their analysis is confined to only one type of pass-through business, for example, and there are other types, including sole proprietorships and partnerships, for which the results may differ. That said, there is other existing research that gives us strong evidence that sole proprietors and partnerships pay even lower tax rates than S corporations do.
The final conclusion is inescapable. Far from disadvantaging S corporations, the current tax code provides a strong incentive to organize as an S corporation instead of a regular C corporation, and it would still do so even if the pass-through deduction never existed. Members of Congress need to take this research into account when debate begins next year over the 2017 tax cuts.
Did you find this content informative and engaging? Get updates and stay in tune with U.S. economic inequality and growth!
During the first several months of the COVID-19 pandemic, the federal government ensured that all U.S. workers had access to at least 2 weeks of paid sick leave and up to 10 extra weeks of paid family and medical leave to take care of themselves or a sick loved one. This income support was meant to help contain the spread of the virus while also maintaining workers’ connections to their jobs and ensuring they were not punished for staying home when they or their family members fell ill.
These federal protections expired at the end of 2020. Though some states do provide paid sick and family leave to their workers in the absence of federal paid family and sick leave, under this patchwork of protections, not all workers can rely on these important income support programs. While paid leave policies continue to be debated in state houses and at the federal level, recent research shows that both paid family and sick leave can have positive impacts on employment, career advancement, and economic security—especially for women, who tend to take on more caregiving responsibilities than men.This column looks more closely at these impacts and what they could mean for future policymaking.
The impact of state-level paid sick leave mandates
In the 2024 general election, voters in three states—Alaska, Missouri, and Nebraska—approved ballot measures requiring employers to provide paid sick leave to employees, adding to the 15 states and the District of Columbia that already mandate employer-provided paid sick leave. At the federal level, the proposed Healthy Families Act, which would create a federal requirement for paid sick leave, has been reintroduced in several sessions of Congress.
Recent research by Meredith Slopen at CUNY Graduate Center’s Stone Center on Socio-Economic Inequality (and an Equitable Growth grantee) shows that paid sick leave policies can improve women’s employment and financial security. Slopen examines paid sick leave mandates in California, Massachusetts, and Oregon and finds that the policies increase overall employment by 1.2 percentage points, increase wages by an average of $2,347 per year, and decrease poverty over time. These effects of paid sick leave are the largest for women with children and for Black women and Latinas, indicating that this policy may help improve gender, racial, and ethnic equity.
While not focused specifically on women, research that has been conditionally accepted in the Journal of the European Economic Association finds that state-level sick pay policies improve the number of workers covered by paid sick leave. Specifically, the co-authors—Equitable Growth grantees Catherine Maclean of George Mason University, Stefan Pichler of the University of Groningen, and Nicolas R. Ziebarth of Cornell University—find that under state-level mandates, the percentage of jobs providing paid sick time increases from 63 percent prior to the policy enactment to more than 90 percent 5 years after enactment. Their research also shows a crowding-in effect, where employers offer additional benefits, such as life insurance or dental insurance, after the paid sick leave mandate goes into effect.
The impact of paid family and medical leave programs
The United States does not have a national paid family and medical leave program. The Family and Medical Leave Act, enacted in 1993, mandates up to 12 weeks of unpaid leave, though not all workers are covered by the law; those who have worked less than 12 months for their current employer, for example, or those whose workplaces have fewer than 50 employees are excluded. Thirteen states and the District of Columbia have passed paid family and medical leave legislation in the absence of a federal mandate. Yet this patchwork of leave policies has unequal impacts, including, for example, that women in private-sector jobs have lower access to paid leave than men in the private sector.
A recently released report by the Urban Institute, commissioned by the U.S. Department of Labor’s Women’s Bureau, conducted a microsimulation of the proposed FAMILY Act, which would create a federal paid family and medical leave program. It finds that the poverty rate would decrease by more than 16 percent for households receiving paid family and medical leave benefits, with the largest reductions among Black and Latino workers. It also finds that women would be more likely to take leave and to have longer durations for their leave than men—though women’s overall pay from their longer leaves would not be substantially higher than men taking shorter leaves due to men’s higher average wages and more hours worked.
Paid family and medical leave also affects women’s career advancement. An analysis of the Family and Medical Leave Act by sociologists Eunmi Mun of the University of Illinois Urbana-Champaign, Shawna Vican of the University of Delaware, and Erin Kelly of the Massachusetts Institute of Technology (also an Equitable Growth grantee) finds that the number of women in managerial roles increased in the years following the enactment of the unpaid leave law, compared to the years prior. Interestingly, the largest increases in women’s representation in managerial-level positions occurred at organizations that already had either paid or unpaid maternity leave prior to the law’s passage, while the most significant increases for Black, Latina, and Asian American women occurred at firms that had paid maternity leave before the Family and Medical Leave Act was passed.
The researchers theorize that the unpaid leave law’s impact at a given company depended on the point of departure—that is, the existing policies and organizational culture around maternity leave before the FMLA roll-out. Rather than the new law substituting the existing maternity leave policies at firms that already had them, it instead tended to reinforce and strengthen existing leave policies and company culture, leading to more career advancement for women following the implementation of the law.
This analysis of the unpaid family and medical leave law indicates the potential for increased career advancement for women if a paid family and medical leave policy is passed at the federal level, including for women at companies already offering some paid leave.
The research discussed here adds to the existing literature about the impact of paid leave policies, including paid sick days and paid family and medical leave, for women’s employment, career advancement, and overall financial security. The evidence is clear: Federal paid leave policies could help address ongoing gender inequality in career advancement and financial security in the United States.
Did you find this content informative and engaging? Get updates and stay in tune with U.S. economic inequality and growth!