The upcoming U.S. election’s most important policy effects are under the radar
Although the old maxim that Labor Day marks the true beginning of U.S. presidential campaigns may no longer hold, the end of summer and beginning of fall remain a period of heightened attention on the candidates as they travel the country making their cases to voters. This is especially true this year, following the late-stage candidate change on the Democratic side. With early voting beginning later this month in some states, time is running short for candidates to make their positions known.
Both parties’ conventions laid out their preferred messages about their candidates, but economic policy in particular played a relatively minor role in the rhetoric used. The presidential and vice presidential candidates’ biographies and visions, alongside the broader discussions of values and ideals at the two conventions, figured more prominently.
A few economic policy goals did draw mentions from both parties, among them improving affordability and an interest in manufacturing certain goods in the United States. Yet the ways in which each party would pursue these goals if they win the presidency and one or both houses of the U.S. Congress would likely differ substantially. Other policy areas were discussed more intensely by one party. Immigration, for example, drew more focus from Republicans, while Democrats were more interested in talking about housing.
Economic policies will likely figure more prominently in post-Labor Day campaigning, as candidates highlight specific things they plan to do in office. In some cases, these proposals illustrate differences in priorities between the two parties. The Republican Party proposes tariffs of at least 10 percent on all imported goods. The Democratic Party proposes a $25,000 tax credit for first-time homebuyers.
In other cases, the two parties have converged on broadly similar ideas. The Democrats propose to increase the generosity of the Child Tax Credit and provide a larger credit for newborn children. U.S. Sen. J.D. Vance (R-OH), the Republican vice presidential candidate, and other Republicans also have expressed interest in the past in providing additional support for families with children.
Then there’s the dueling proposals about exempting tipped income. The Trump campaign proposes exempting income from tips, as well as Social Security benefits, from income taxes. The Harris campaign subsequently proposed a more limited exemption for tip income.
But even beyond what is promised between now and Election Day, the outcome of the November election, both for president and in Congress, will shape the U.S. economic policy landscape for 2025 and years to come. The next presidential administration will also be responsible for how existing policies are carried out, including and especially in areas that the Biden administration has prioritized and, in some cases, made substantial changes.
How the next administration builds on or reverses policies that the current administration is already carrying out will be an important part of how it brings its own policy priorities to bear. The Biden administration, for example, has issued, through various agencies, a number of regulations on topics, including overtime pay, student loans, surprise medical bills, noncompete agreements, air pollution, credit card late fees, retirement investment advice, and many others. Some are in effect, while others are subject to ongoing litigation. How the next administration handles implementation and litigation decisions will play a critical role in determining how these regulations play out.
The same is true for a range of implementation decisions that have been and continue to be made under the Bipartisan Infrastructure Law, the CHIPS and Science Act, and the Inflation Reduction Act. The next presidential administration could alter or rescind implementing rules in ways that may impact these laws’ effectiveness. Similarly, the incoming Congress could rewrite portions of these laws or make changes to the funding available under them.
There are also longstanding, significant differences between the parties’ policy priorities, and these differences will interact with who holds the White House and congressional majorities to shape where efforts are focused when opportunities for new policymaking arise. Key provisions of the Tax Cuts and Jobs Act of 2017 expire in 2025, for example, which is already precipitating a debate over what the tax code should look like going forward. Who holds power after the election will determine whether the 2017 tax cuts will remain largely in place or be materially altered.
The balance of power in Washington also will shape the outcomes of more routine policymaking opportunities. If the same party controls the presidency and the U.S. Senate, then the president will have a freer hand to make executive branch appointments that require Senate confirmation, including appointments to independent regulatory agencies. The impact of appointments to the Federal Trade Commission and the National Labor Relations Board has been notable during the Biden administration, and with Senate support, the next president could have an opportunity to advance their own policy agenda in a similar way.
If the president’s party also controls the U.S. House of Representatives, that party could make meaningful policy gains through annual appropriations and possibly other legislation. Under a divided government, however, a greater degree of compromise would likely be necessary.
Debates about new proposals over the remainder of the campaign will be heated at times, but the election will have some of its most important effects on policy simply by determining who is in charge when opportunities to exercise discretion arise. While some of those opportunities are obvious in advance, others arise unexpectedly. Candidates’ proposals should be evaluated at least as much as hints at how they would handle these opportunities as they arise as concrete plans they hope to pursue.
Interested in hearing more? Register to attend our upcoming virtual event, “Evaluating the Economic Policy Stakes for 2025,” where researchers who have served in policy roles will discuss how the election could shape the policy landscape in the United States over the coming years and how research informs our understanding of what that could mean for workers, families, and businesses.
Did you find this content informative and engaging?
Get updates and stay in tune with U.S. economic inequality and growth!
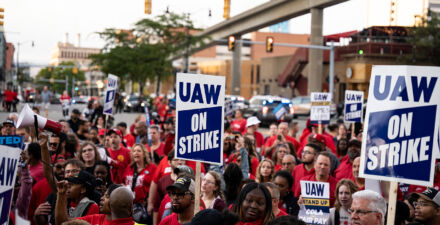
Will labor’s surging popularity result in new union members in the United States?

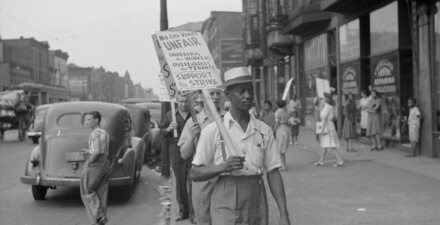
Mass strikes across U.S. industries, successful organizing drives in multiple sectors of the economy, and a U.S. president who declares himself proud to be labeled “the most pro-union president in history” all point to a historic resurgence for organized labor in the United States. Even longtime foes of unions have begun to rethink past positions in the wake of evidence showing labor unions’ growing popularity among Americans.
Yet organized labor’s rise isn’t apparent in the number of unionized U.S. workers, which continues to decline. In 2023, the unionization rate fell to just 10 percent, a historic low, and just half of what it was in the early 1980s. The core issue driving these low membership rates is the difficulty of organizing at scale in the private sector, where just 1 in 20 workers belongs to a union. There is no ready solution to this obstacle, absent a highly unlikely reimagining of the National Labor Relations Act, the federal law governing labor relations in much of the U.S. private sector.
As we approach Labor Day, though, the good news for organized labor is that there is a large section of the workforce that isn’t governed by the NLRA—and one that has proven easier to organize: the public sector. Just less than one-third of workers in the public sector belongs to a union today, and new evidence suggests that number should remain stable—or even could increase substantially—helping to reverse labor’s slipping share of the overall U.S. workforce.
Earlier this year, I, along with my colleagues Patrick Denice of Western University and Jennifer Laird of Lehman College, surveyed 4,000 full-time public-sector workers. We asked them a range of questions about their attitudes toward labor unions, their experiences in unions (among the members in our sample), and their interest in joining unions (among the nonmembers).
The first encouraging sign for labor union organizers from our survey is overwhelming support for unions among the ranks of the organized. Among the members in our survey, 94 percent reported that unions were essential or important. When asked if they would vote to recertify their union, 9 in 10 current members said yes. (See Figure 1.)
Figure 1
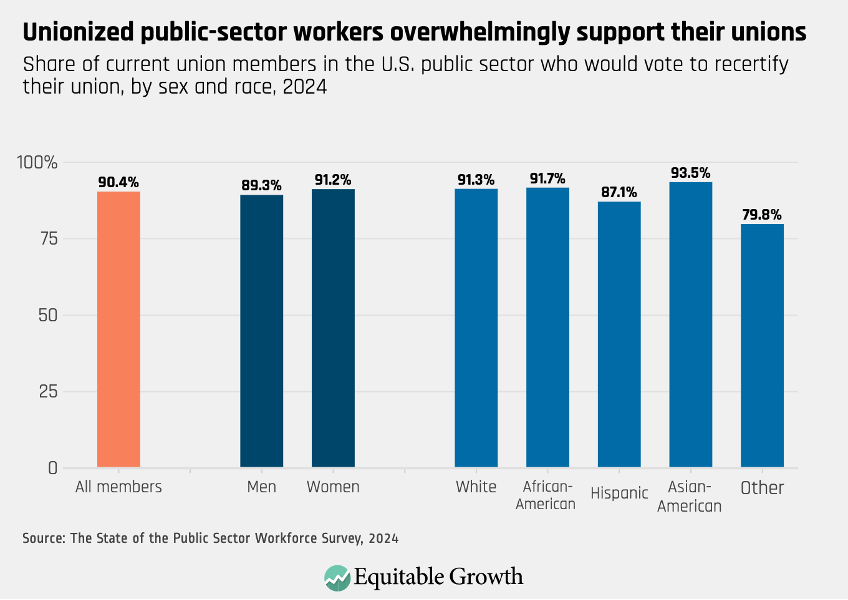
This is critical information in the wake of the 2018 U.S. Supreme Court case, Janus vs. AFSCME. This ruling effectively made the entire public sector “right to work,” which allows workers to opt out of paying dues but still retain the benefits of collective bargaining in unionized workplaces. The concern for unions is that right-to-work laws incentivize workers to free ride—to enjoy the benefits of union representation without bearing any of the costs—weakening a union’s power. Overwhelming support for their unions should help alleviate unions’ concern about public-sector workers dropping their memberships in the post-Janus landscape.
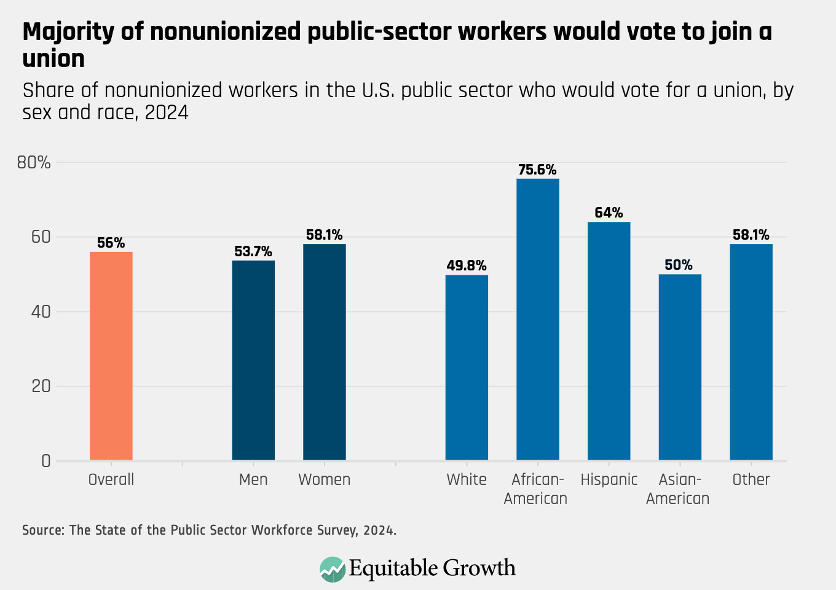
Among unorganized workers in our sample, more than two-thirds said that unions were either “essential” or “important,” while less than one-third said unions were something they could do without. Yet expressing general support for unions is not the same as wanting to join one. Taking a cue from past surveys of predominantly private-sector nonunion workers, we asked public-sector nonunion workers whether they would vote for a union if given the opportunity. In no prior survey has this “unmet demand” for representation exceeded 50 percent—until ours.
We find that 56 percent of unorganized workers said they would join a union. And, echoing recent research that finds African American men and women in the public sector disproportionately benefit from union membership, the desire to join a union is highest among women and African Americans. (See Figure 2.)
Figure 2
Past surveys of predominately private-sector nonunion workers also find a sizeable number of workers eager for union representation, albeit a smaller fraction than in our survey. And yet this unmet demand has not translated to private-sector union growth. So, why should we expect anything different in the public sector?
First, despite much higher public-sector unionization levels than private-sector membership rates in the United States, the number of U.S. public-sector unionized workers remains considerably lower than in peer nations. In Canada, for example, three-quarters of the public sector belongs to a union; in the United Kingdom, nearly half do. The United States, at about one-third, can clearly grow more, at least in the comparative context.
Second, our data suggest the unmet demand for union representation is not concentrated in states hostile to public-sector collective bargaining. Unlike in the private sector, there is no federal law governing public-sector labor relations. Instead, states have enormous leeway in granting or restricting collective bargaining among government employees, resulting in a patchwork of labor relations. They range from states such as South Carolina, where collective bargaining between public-sector workers and the state is prohibited, to New York, where it is required.
 post
post
 post
post
 Coronavirus Recession
Our data indicate that the unmet demand is actually higher in states with the most pro-union legal frameworks. These findings are surprising. We expected a smaller share of the public-sector nonunion workforce to desire union representation than among private-sector workers, and we expected demand to be concentrated in states where the barriers to entry were formidable. Instead, we found the opposite.
Finding so much unmet demand for unionization in pro-union states should buoy organizers eager to find ripe targets for union representation. Combined with the high levels of support for their unions among existing public-sector union members, these results suggest there is a pathway for unions to stem further erosion in membership—they just need to know where to look.
Did you find this content informative and engaging?
Get updates and stay in tune with U.S. economic inequality and growth!
Early career scholars to receive Equitable Growth funding to study economic inequality

The Washington Center for Equitable Growth today announced a new slate of grantees. These 10 scholars responded to a Request for Proposals specifically targeted at those early in their careers whose research is policy-relevant and can inform how policymakers can take action to create more stable, broadly shared U.S. economic growth.
Equitable Growth is committed to funding the next generation of scholars and supporting them to ensure the research they produce informs evidence-backed policymaking. We are also committed to supporting diversity across the social sciences—especially in economics, which lags other disciplines in gender, racial, and ethnic diversity. All researchers affiliated with a U.S. university whose Ph.D. was issued within the past 8 years, as well as current graduate students in the dissertation stage of a Ph.D. program at a U.S. university, were eligible to apply.
“These scholars represent a new generation of researchers looking into why inequality continues to be a drag on the U.S. economy and how we might combat it,” said Equitable Growth President and CEO Shayna Strom. “We are proud to help make their research accessible to all and support them as they produce evidence-backed ideas that will shape economic policies for years to come.”
The Request for Proposals was split into an array of issue areas: macroeconomic growth, fiscal policy, human capital and well-being, economic mobility, the labor market, and market structure. Equitable Growth was particularly interested in funding research that will generate actionable insights, illuminate policies that help or hinder equitable economic growth, or uncover a need for policy action. Applicants who will create new data that can be made publicly available were prioritized, as were those who engage with the literature across disciplines and those examining the role of racial stratification in the issue they seek to study.
Below, we detail the pre-tenure academics, who will each receive $30,000 from Equitable Growth, and their proposed research.
- Arizona State University’s Samuel Young will estimate which individuals benefit when firms become more productive and whether these same individuals bear the costs when firms perform poorly. Looking specifically at so called pass-through businesses, he will identify each firm’s workers and owners and measure their total compensation from theses firms, and then will estimate the distributional effects of productivity changes.
- Elena Prager of the University of Rochester will study how firms collude in labor markets, and specifically how common leadership and no-poach agreements can play a role. Even though common leadership (when the same person holds high-level positions at two competing firms) is prohibited by antitrust law, it is rarely enforced, and no-poach agreements are difficult to study because they are typically secret. Prager will use court records from the late 2000s, when 50 tech companies entered into no-poach agreements, to see whether these agreements affect worker mobility and career trajectories.
- Jessica Brown of the University of South Carolina will examine the impact of private-equity-owned child care businesses on the market for early care and education. She will determine how these child care centers differ from others, how a child care center changes when it is taken over by a private equity firm, and how entry of a private-equity-owned center affects other child care providers in the area.
- American University’s Jhacova Williams will study the housing consequences of Interstate 10 in New Orleans, and specifically whether the highway’s construction resulted in differential housing outcomes in Black vs. White neighborhoods. Williams has created a unique dataset from the U.S. Geological Survey, National Historical Geographic Information System, and other census tract data.
The following Ph.D. students (some of whom have completed their doctorate since applying to the RFP and are in early-career positions at U.S. universities) will receive $15,000 from Equitable Growth to advance their research:
- The University of Kentucky’s Eleanor Krause (formerly studying at Harvard University) will research which labor market frictions prevent workers and communities from adjusting to local employment shocks and the extent to which investments in human capital address these frictions. Specifically, she will look at the transition to a clean energy economy in coal industry communities.
- The University of Maryland’s Jordan Richmond (formerly studying at Princeton University) aims to better understand the distributional consequences of the tax subsidy for private equity. Using administrative tax data, he will quantify the preferential tax treatment of private equity profits, compare private equity income and tax losses with counterfactual tax liabilities, and examine the consequences for workers across the income distribution.
- Stanford University’s Brendan Moore will examine barriers to accessing Unemployment Insurance. He will look at the underlying causes of incomplete UI take-up and the barriers that disproportionately target low-income and marginalized workers and reinforce inequity in the UI program. Then, Moore will determine ways that outreach can boost UI take-up, improving outcomes for workers and reducing inequities.
- Kassandra Hernandez of the University of California, Berkeley will explore how worker-led lawsuits impact firm size, survival, relocation decisions, employment, and wages. She will use publicly available data on lawsuits filed under California’s Private Attorneys General Act and settlements from California’s Department of Industrial Relations to determine whether the law is an effective tool to support worker rights.
- Cornell University’s Neil Cholli will investigate the incidence and consequences of families participating in multiple income support programs, such as the Supplemental Nutrition Assistance Program, Medicaid, and other government assistance programs. His project will produce descriptive statistics on how frequent multiple-program participation is, estimate the causal effects on family well-being, earnings, and outcomes for adults and children, and evaluate the efficacy of participating in multiple programs, as well as which combinations of programs have the largest effects on economic well-being.
- Micah Villarreal of the University of California, Santa Barbara will examine the effect of wealth on descendants of enslaved Americans in Oklahoma after federal American Indian policy made many of these “freedmen” landowners. Using the wealth shock produced by a subsequent oil boom, Villarreal seeks to explore the short- and long-term effects on Black households of this influx of wealth—with potential policy implications for reparations and racial wealth inequality.
This Request for Proposals helps Equitable Growth work toward its longstanding goal of supporting early career scholars from diverse backgrounds and in varying stages of their academic careers. The competitive process includes a review by our esteemed review committees, made up of staff and external subject-matter and methodological experts, as well as final approval from our Steering Committee.
We thank all who applied for this year’s Early Career Request for Proposals for their hard work and heartily congratulate the 2024 cohort of early career grantees. We look forward to reviewing their findings and related studies in the future.
Did you find this content informative and engaging?
Get updates and stay in tune with U.S. economic inequality and growth!
Equitable Growth invests in new research to better understand the effects of the fiscal response to the COVID-19 recession

The Washington Center for Equitable Growth today announced a new cohort of grantees in response to a Request for Proposals on the effectiveness of the fiscal response to the COVID-19 recession. These research projects are specifically analyzing whether policies worked to generate better macroeconomic outcomes and better and more equitable outcomes for working-age individuals in the United States.
This Request for Proposals was open to researchers at U.S. universities studying economic policy interventions that primarily took place between March 2020 and March 2021, such as those in the Coronavirus Aid, Relief, and Economic Security, or CARES, Act, as well as the American Rescue Plan Act.
“The fiscal response to the COVID-19 recession included bold, new, experimental policies, many of which are the subject of a lot of debate,” said Janelle Jones, Equitable Growth’s vice president of policy and advocacy. “These research projects will help evaluate those policies and their impact. They will ensure we have the empirical evidence needed to inform policymaking moving forward so that responses to future recessions are grounded in data and research.”
The goal of this grantmaking is to provide policymakers with a better understanding of how specific economic policies affected the U.S. economy and workers amid the worst phases of the pandemic recession. Outcomes of particular interest are labor force participation, wages, job matches and job quality, small business reopenings, and firms’ survival and productivity.
Below, we detail the six projects that will receive funding:
- Harvard University’s Gabriel Chodorow-Reich and Johns Hopkins University’s Adam Isen will examine the short- and medium-term outcomes for U.S. firms and workers of receiving cash grants during the economic downturn. Using data from Minnesota, which gave out $125 million in grants via random lottery to small businesses during the pandemic, the authors will review the effects on these firms’ payrolls and employment levels, borrowing and delinquency, and their workers’ attachment to their employers.
- University of Maryland’s Brandon Enriquez will study the labor market effects of temporary wage subsidies. Specifically, he will look at the effect of the Employee Retention Tax Credit, a federal program implemented during the COVID-19 recession to incentivize employers to furlough rather than lay off workers to maintain employer-employee attachment. Enriquez will look at how this tax credit affected employment levels, payrolls, and small business reopenings.
- Till Von Wachter of the University of California, Los Angeles will determine the effectiveness of Short-Time Compensation, an ongoing Unemployment Insurance program that enables employers to reduce hours for a group of workers who receive prorated UI benefits and maintain job benefits. Despite garnering bipartisan support and substantial federal subsidies to states during the pandemic, Short-Time Compensation is underutilized in the United States. Von Wachter will review STC awareness and use, as well as worker and firm outcomes, and will run a random control trial to inform how to increase take-up in future downturns.
- Matthew Denes of Carnegie Mellon University, Spyridon Lagaras of the University of Illinois Urbana-Champaign, and Margarita Tsoutsoura at Washington University in St. Louis will study the economic impact payments in the CARES Act. The authors plan to examine the labor market effects of these stimulus payments, including salaried employment, contract jobs, unemployment, and entrepreneurship.
- University of Chicago Harris School of Public Policy’s Yana Gallen and Dmitri Koustas will study the child care spending provisions included in the American Rescue Plan and how they affected women’s labor supply and child care utilization. Specifically, they plan to look at how the expanded Child and Dependent Care Tax Credit affected household choices and socioeconomic disparities in impacts.
- Amy Claessens, Katherine Magnuson, and Alejandra Pilarz, all at the University of Wisconsin, will explore policy options for supporting the child care sector by looking at an intervention in Wisconsin during the pandemic. In 2022, the state of Wisconsin and the city of Milwaukee both substantially expanded programs that dramatically increased stipends available to eligible caregivers. The authors plan to study whether these wage supplements reduced turnover and kept care workers in their jobs, stabilizing the child care industry.
Equitable Growth tapped into the expertise of its vast academic network and various policymaker connections to create an advisory committee to guide funding decisions. The committee included Alan Blinder, an Equitable Growth Steering Committee member and Gordon S. Rentschler Memorial Professor of Economics and Public Affairs at Princeton University; Karen Dynan, an Equitable Growth Steering Committee member and economics professor at Harvard University; Sameera Fazili, an Equitable Growth Board of Directors member and former deputy director of the National Economic Council; Michael Linden, an Equitable Growth Senior Policy Fellow and former executive associate director of the White House Office of Management and Budget; and Shilpa Phadke, former deputy director of the Gender Policy Council at the White House.
We thank the members of our advisory committee for their time and input, as well as all the applicants who submitted proposals in this extremely competitive process. We look forward to working with this new class of grantees and passing on the findings of their studies to policymakers looking for guidance on the best fiscal policies to boost worker and firm outcomes amid future economic downturns.
Did you find this content informative and engaging?
Get updates and stay in tune with U.S. economic inequality and growth!
New economic analyses of the 2017 Trump tax cuts find mixed effects that policymakers should consider when those tax cuts expire in 2025

Former President Donald Trump’s hallmark economic policy was a swathe of tax cuts for the wealthy and big corporations in 2017. His Tax Cuts and Jobs Act, or TCJA, supercharged the wealth of billionaires and shifted more power and wealth to big corporations. Republican legislators in Congress savvily made the corporate tax cuts permanent due to their deep unpopularity, but sunset the individual provisions of the bill to help with the budgetary math.
That sunset is coming up at the end of 2025, teeing up an epic tax policy fight that has the potential to change the way money and power are distributed throughout the U.S. economy. While only some of the provisions are expiring, it’s widely anticipated that all the provisions—individual and corporate—will be up for debate.
In the run up to that policy fight, many academics are reevaluating the claims that TCJA proponents made in 2017 about the tax cuts’ potential to boost growth, wages, and investment. One such paper, published earlier this year, explores the claims made by the bill’s advocates that the Trump tax cuts would boost aggregate investment.
The four co-authors of the paper—economists Gabriel Chodorow-Reich at Harvard University, Matthew Smith at the U.S. Department of the Treasury, Owen Zidar at Princeton University, and Eric Zwick at the University of Chicago’s Booth School of Business—employ sophisticated statistical techniques and an extensive proprietary firm-level dataset. They find that businesses that received a larger tax cut invested relatively more than businesses that received a smaller tax cut. The four co-authors then use a standard macroeconomic model to estimate aggregate investment effects of the tax law and find that such effects are positive.
But the paper also presents an interesting puzzle. Because it is hard to discern economywide investment effects in the actual aggregate data, could it be possible that the tax cut led individual firms to invest more yet those investments had little or no impact on the economy as a whole?
A new technical brief from the Institute for Macroeconomic and Policy Analysis at American University sheds some light on this puzzle. The IMPA economists—Ignacio González, Juan Montecino, and Vasudeva Ramaswamy—explain that the firm-level findings by Chodorow-Reich and his co-authors are consistent with existing economic theory: If Firm A gets a big tax cut and Firm B doesn’t, then Firm A would invest relatively more than Firm B. Yet the IMPA team also points out that there are several reasons why this doesn’t necessarily imply more investment on aggregateacross the U.S. economy.
Consider the following scenarios, all of which are consistent with the finding that, at the firm level, companies with larger tax cuts invest relatively more than those with smaller tax cuts:
- After a change in taxes, Firm A invests more than before, and Firm B holds its investments constant. This would result in greater aggregate investment.
- After a change in taxes, Firm A invests relatively more than before, but Firm B decreases its investments. Depending on the magnitudes, this could result in either increased or decreased aggregate investment.
- After a change in taxes, both firms reduce their investment, but Firm B reduces investment more than Firm A. This would result in decreased aggregate investment, even though firms with a tax cut invested relatively more than those without.
All of these scenarios are plausible. Unfortunately, the study by Chodrow-Reich and his co-authors does not parse out which of these scenarios is playing out. The problem is that, when it comes to taking firm-level findings and translating those to the economy as a whole, economists need to make a lot of assumptions about how the economy works. Those assumptions underpin any macroeconomic model, and, in this case, their findings on aggregate investment depend on two key—but highly debatable—assumptions:
- The supply of capital: The standard macroeconomic model used by the authors assumes that the supply of available capital is essentially infinite, meaning that the “price” of supplying that capital always stays the same, regardless of the level of demand. There is very little evidence for this assumption, and ordinarily, we’d naturally expect some increase in prices if demand increases. If a tax cut has the effect of stimulating investment, then it will increase the demand for capital. So, it’s reasonable to think that demand would drive up the price of capital, thus putting downward pressure on investment. As a result, the assumption that the price of capital stays constant probably overstates the positive aggregate investment effect of firm-level investments.
- Rent-seeking: The standard macroeconomic model used by the authors also assumes perfectly competitive markets. This is a simplifying assumption widely used by economists, but, in this case, it has unintentional effects for their investment conclusion. We know that corporations do not operate in perfectly competitive markets and do, in fact, engage in unproductive rent-seeking behavior that does not contribute to broader economic growth and productivity. This means that a corporate tax cut does not necessarily only reduce the cost of capital. Some, or all, of the tax cut could also be captured by shareholders without affecting investment at all.
In addition to discussing how these two important assumptions could be driving the results, the new IMPA technical brief discusses another concern with the macroeconomic model used by Chodorow-Reich and his co-authors. Their model essentially assumes that labor supply is also infinite, so an increase in demand for labor results in a large wage increase but no employment increase. The modest wage increase implied by their model has not shown up in empirical data.
 post
post
Assessing the economic effects of the Tax Cuts and Jobs Act
April 17, 2018
 post
post
 Vision 2020
A modest tax reform proposal to roll back federal tax policy to 1997
February 18, 2020
With the impending expiration next year of major elements of the Tax Cuts and Jobs Act, it is important to understand what that law did and did not accomplish. We know it did not have anywhere close to the kind of impact that many of its proponents claimed it would. Chodorow-Reich, Smith, Zidar, and Zwick make an important contribution to the effort to more precisely understand what it did and did not do. And their firm-level findings are certainly consistent with other scholarship.
It is only when they run those findings through their standard macroeconomic model that they encounter a finding that does not match the observed, empirical, aggregate data that does not suggest any significant investment impact. The three economists at the Institute for Macroeconomic and Policy Analysis have helpfully laid out a few ways we might untangle this knot.
—Rakeen Mabud is the chief economist and a senior fellow at Groundwork Collaborative. Janelle Jones is the vice president for policy and advocacy at the Washington Center for Equitable Growth. Michael Linden is a senior policy fellow at Equitable Growth.
Did you find this content informative and engaging?
Get updates and stay in tune with U.S. economic inequality and growth!
New labor market data suggest that U.S. wage growth may be cooling too much

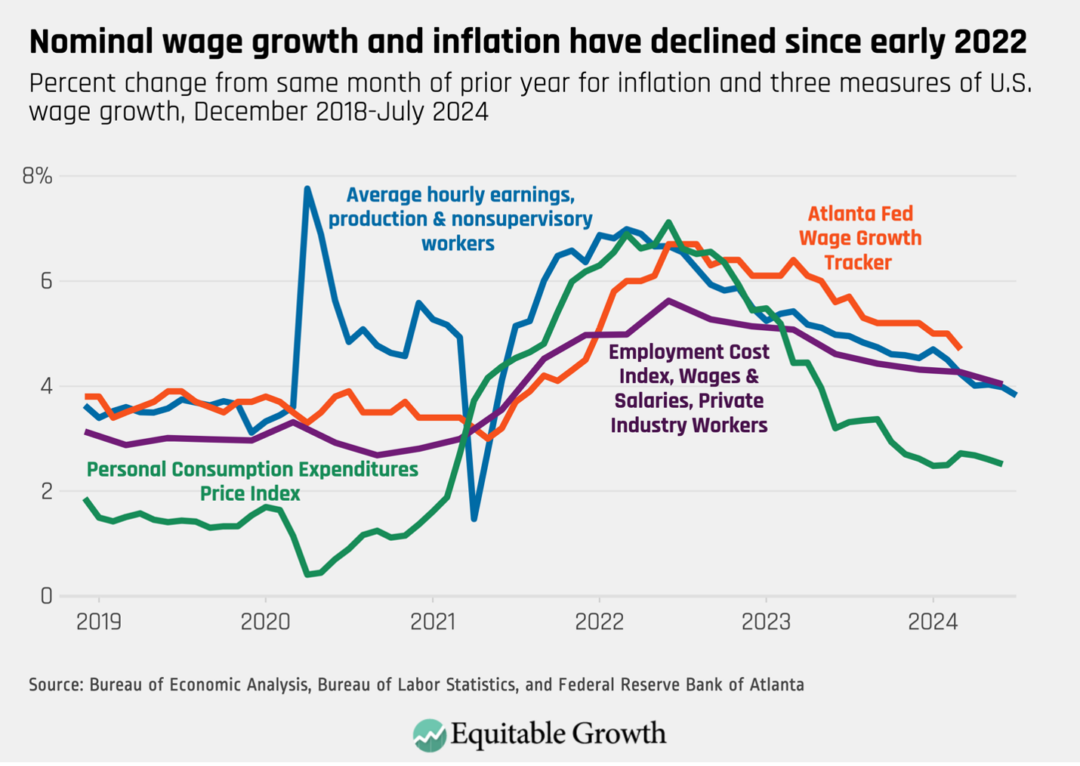
After increasing rapidly over the course of 2021, nominal wage growth (before accounting for inflation) in the United States has been trending down consistently across measures since early- to mid-2022. This has generally been regarded as a positive development because inflation also increased rapidly in 2021, and slowing nominal wage growth tends to reduce upward pressure on prices. This reduced pressure may have contributed to the slowdown in inflation also seen since early- to mid-2022. (See Figure 1.)
Figure 1
Yet U.S. labor market data released over the course of last week suggest that it may be time to reconsider that opinion. When labor productivity grows faster, there is more room for nominal wages to rise without increasing inflation. According to the U.S. Bureau of Labor Statistics, labor productivity in the second quarter of 2024 was 2.7 percent higher than it was a year earlier—the fourth consecutive quarter with annual productivity growth of at least 2.4 percent. (For reference, labor productivity growth averaged 1.3 percent annually from 2010 through 2019).
New data from the U.S. Bureau of Labor Statistics’ Job Openings and Labor Turnover Survey, or JOLTS, also show a continuing slowdown in hiring. While the bureau’s monthly jobs report’s household survey shows that people ages 25–54 remain employed at high rates, the data also reveal that the overall U.S. unemployment rate rose again, to 4.3 percent, triggering the Sahm Rule, an indicator with a strong track record of identifying recessions in real time. While these signals are somewhat mixed, unemployment has been rising since the beginning of 2023, a clear sign of a cooling labor market.
In this context, the continuing declines in nominal wage growth come amid greater capacity for faster wage growth due to productivity gains and amid broader signs of increased labor market weakness. Add in the progress made in reducing inflation over the past two years, as seen in the green line of Figure 1, and slower nominal wage growth seems less like a necessary cost of stabilizing prices and more like a threat to the labor market’s ability to deliver material gains for workers by boosting their real wages after accounting for inflation.
This gloomier view is reinforced by signs that nominal wage growth is likely to slow further going forward. One such sign is the unusually low amount of labor market churn, or the sum of hires and job separations. This measure is often used as a proxy for opportunities for workers to change jobs, which is an important indicator because it represents the chance for workers to get a bigger raise than is typical when continuing on with their current employers.
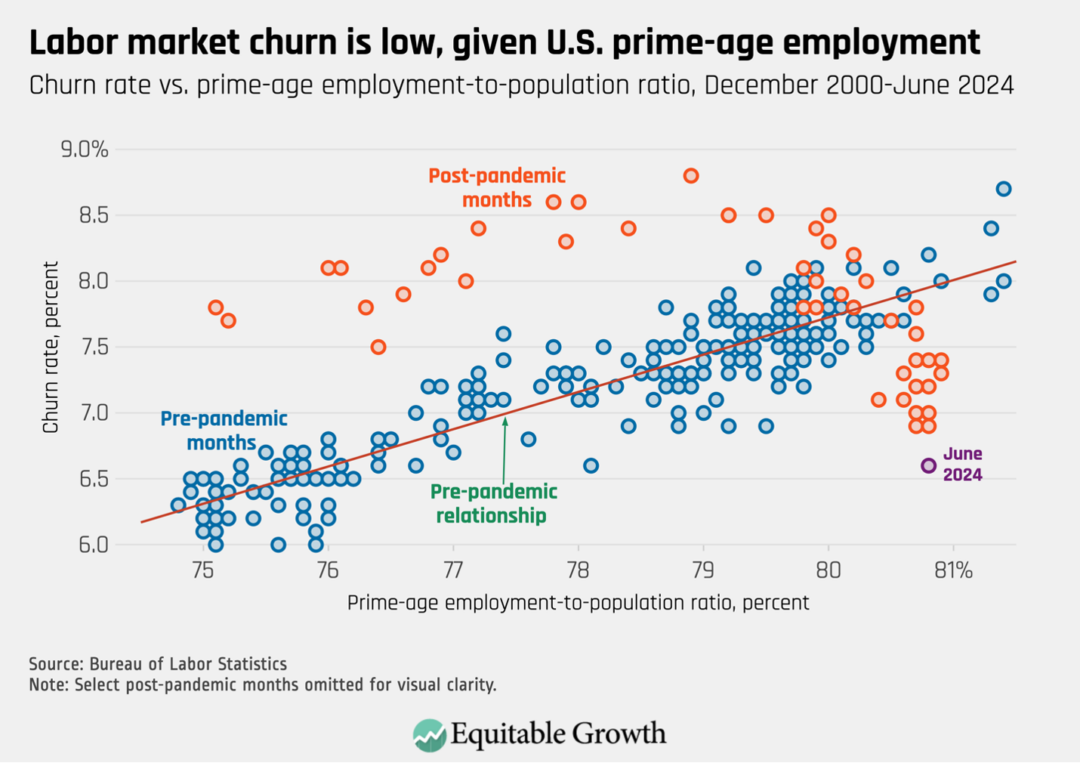
Last week’s JOLTS report shows labor market churn falling, driven by similar declines in both hires and separations. Given the still-high rate of employment among prime-age workers between the ages of 25 and 54, the current low level of churn is especially unusual. Churn today is more in line with what might be expected if the prime-age employment-to-population ratio were more than 4 percentage points lower than it is—a level last seen in the substantially weaker labor market of 10 years ago. (See Figure 2.)
Figure 2
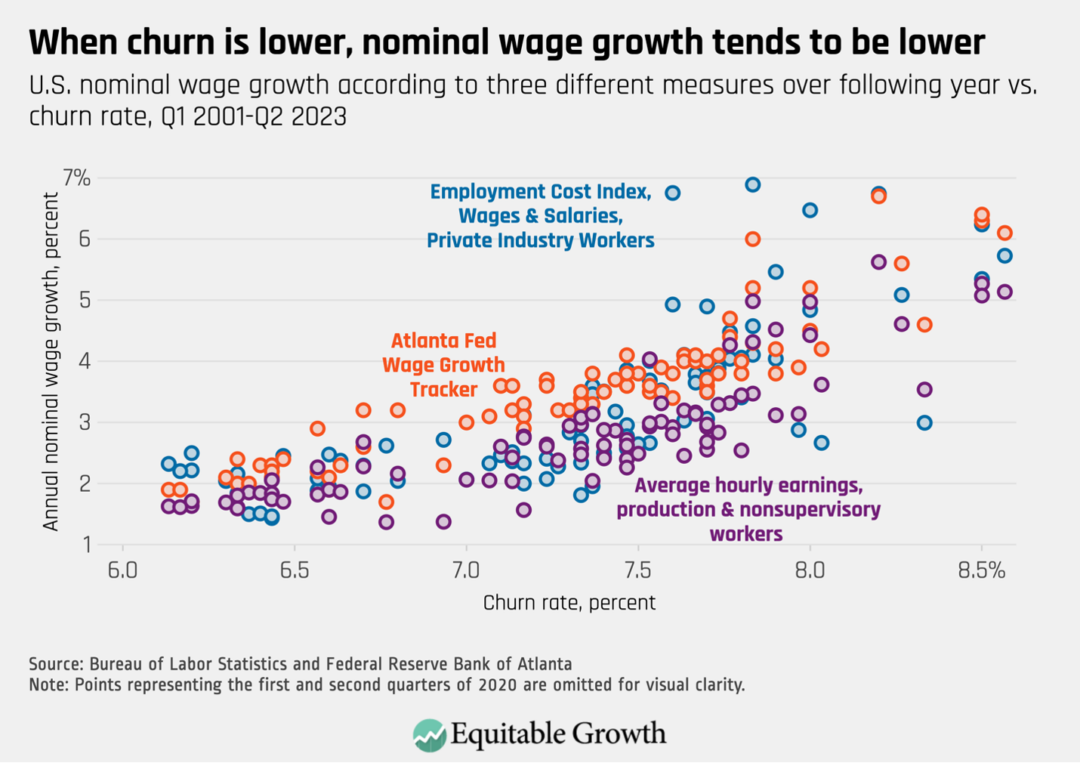
Nominal wage growth tends to be slower when churn is lower. Based on this historical relationship, the 6.8 percent churn rate, on average, over the past 3 months points to nominal wage growth over the next year of between 2 percent and 3 percent—a meaningfully slower pace than the current rate of around 4 percent. (See Figure 3.)
Figure 3
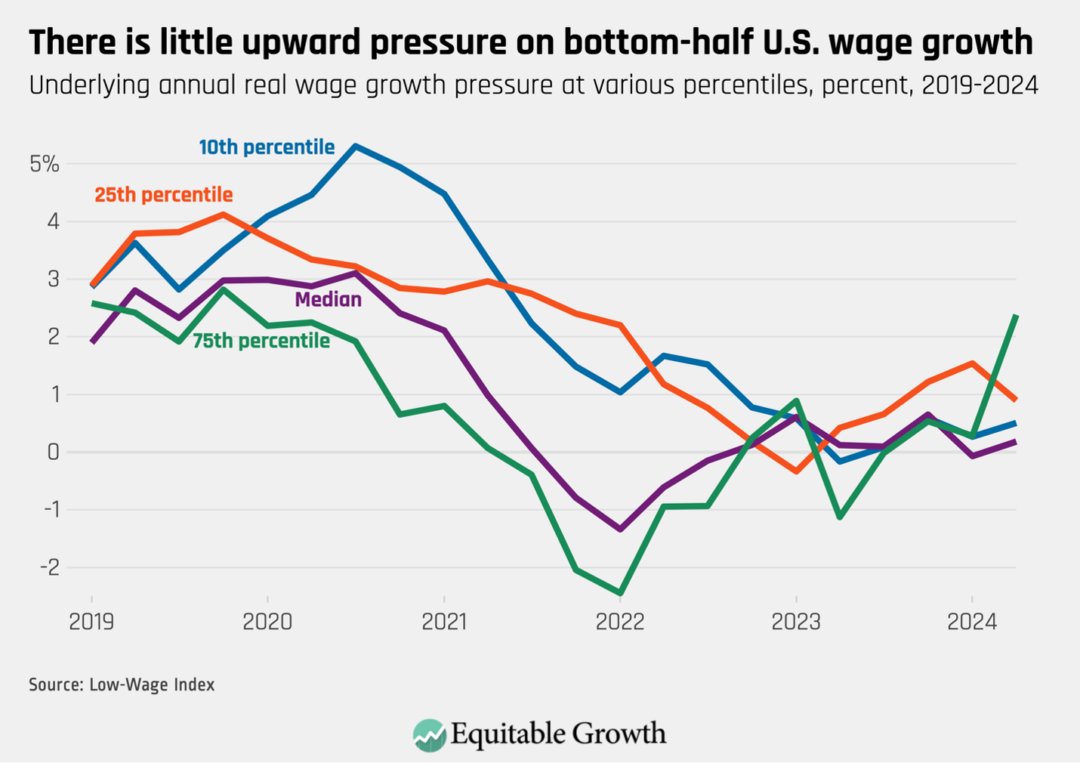
Another sign pointing toward slower nominal wage growth comes from the Low-Wage Index. This new measure, from Yale University economist Ernie Tedeschi using BLS data, aims to capture changes in U.S. wages due to fundamental economic forces rather than changes in the composition of the workforce. Importantly, it measures the influence of these forces at different points in the wage distribution, providing a sense of how low-wage workers are faring, as well as those earning closer to average wages.
These data currently show little upward pressure on wages throughout much of the distribution. For the past year or so, the Low Wage Index has pointed to little-to-no annual change in real wages at the middle and bottom of the distribution, with somewhat larger but still modest and fluctuating gains at the 25th and 75th percentiles. (See Figure 4.) No change in real wages implies nominal wage growth in line with inflation, which has been lower than recent nominal wage growth and is slowing.
Figure 4
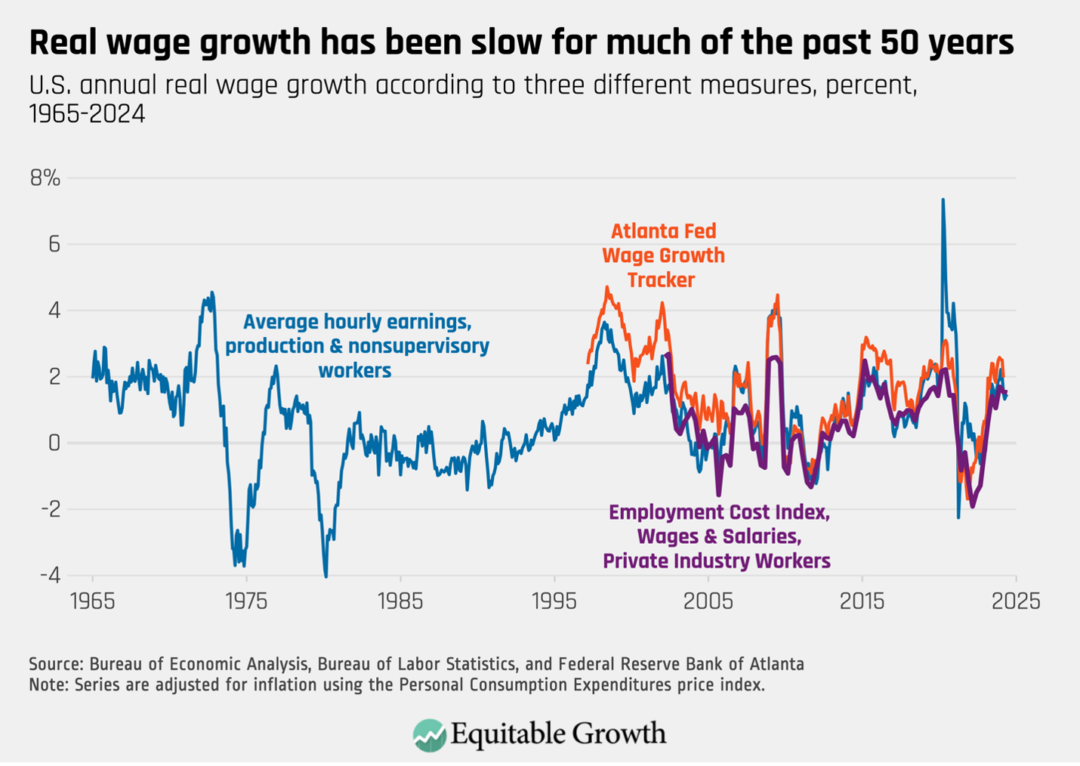
This experience of nominal wage growth meaningfully exceeding inflation and producing real wage gains has been all too rare over the past 50 years. Over the past 12 months, annual real wage growth for production and nonsupervisory workers, adjusted for inflation using the Personal Consumption Expenditures price index, has averaged nearly 1.7 percent.
Since the beginning of 1974, only 118 months (out of 606, or 19 percent) have had annual real wage growth faster than that. In 392 of those months (65 percent), annual real wage growth has been below 1 percent, and it has been negative in 208 months (34 percent). Other measures of real wage growth that are available for more recent years and less susceptible to compositional changes show similar trends. (See Figure 5.)
Figure 5
A well-functioning labor market should raise standards of living broadly throughout society. At times, there can be tension between the competing desires to see workers’ earnings rise and to keep prices from increasing too quickly, since higher wages can contribute to higher prices, which can also make people worse off.
Yet the meaningful cooling in the labor market and slowdown in inflation over the past 18 months make slowing wage growth the greater threat to U.S. workers’ well-being. At current rates of productivity growth, declines in nominal wage growth should not be required for inflation to continue to decline. Since only a relatively small decline in inflation is required to reach the Federal Reserve’s 2 percent target, the prospect of a continued slowdown in nominal wage growth now looks more like a step back toward a labor market in which workers merely tread water rather than progress toward one in which gains are stable and broadly shared.
Did you find this content informative and engaging?
Get updates and stay in tune with U.S. economic inequality and growth!
New federal heat standard will protect U.S. workers from the ill effects of high temperatures amid intensifying climate change

U.S. workers are more vulnerable than ever to the ill effects of high and rising temperatures as the world continues to shatter heat records this year. Climate-related deaths and injuries are on the rise, yet only a handful of U.S. states have heat protections in place for workers, while Texas and Florida recently passed laws barring local governments from requiring employers to offer water and rest breaks for workers.
In early July, the federal Occupational Safety and Health Administration announced a proposed rule that would protect workers from the direct and indirect impacts of extreme heat, a first-of-its-kind proposal responding to a Biden administration effort to combat the effects of climate change on workers. It would require employers to offer water and as-needed work breaks when the heat index, which combines temperature and humidity, reaches 80 degrees Fahrenheit. The proposed rule also stipulates that if the heat index reaches 90 degrees, more stringent rules, including mandatory 15-minute breaks every 2 hours, would go into effect.
If finalized, the rule would add protections for 35 million workers around the country who labor both indoors and outside. Though it’s easy to imagine how outdoor workers, such as agricultural or construction workers, experience the effects of extreme heat directly, studies show that indoor workers, including warehouse and kitchen workers and factory employees, also are impacted by heat. Hot weather can impair cognitive ability and decision-making, leading to accidents seemingly unrelated to heat, such as falling from heights or mishandling machinery.
Indeed, high heat has repeatedly been shown to lead to more injuries and deaths in the workplace. One study, by the University of Pennsylvania’s R. Jisung Park, University of California, Los Angeles’ Nora Pankratz, and Stanford University’s A. Patrick Behrer, finds that hot weather dramatically increases reported injuries. Using confidential data from California’s worker compensation system, the authors find that days with high temperatures of 90 degrees result in an increase in workplace injuries of between 6 percent and 9 percent, and days with highs of 100 degrees see injuries increasing by 10 percent to 15 percent.
Overall, the co-authors estimate that extreme heat causes around 20,000 injuries per year, with the effects persisting across indoor and outdoor settings. And that’s just in California.
High temperatures not only have clear adverse effects on individual workers but also affect the broader U.S. economy, costing billions of dollars in lost wages and lower productivity. Data compiled by The Lancet finds that more than 2.5 billion hours of labor were lost in 2021 due to heat exposure in the agriculture, construction, manufacturing, and service sectors of the U.S. economy. Another study finds that extreme heat costs the economy $100 billion in lost labor in 2020—a figure they expect to increase to $500 billion per year in 2050.
Heat also exacerbates existing income and health inequality across the economy. Lower-wage workers and less-educated workers are more likely to work in precarious jobs and to live and work in places with more heat exposure. This means these already marginalized workers face a higher risk of heat-related injury or death, compared to better-off or more educated workers.
Heat will continue to wreak havoc on the U.S. labor market and the economy due to intensifying climate change, which makes heat waves hotter, more frequent, and more prolonged, according to the U.S. Environmental Protection Agency. Indeed, between 1960 and 2020, the United States went from experiencing an average of two heat waves per year to six, with the average 2020s heat wave lasting a full day longer than in the 1960s.
 working paper
 post
post
 Expert Focus
Expert Focus: Understanding the economic impacts of climate change
January 28, 2021
At the same time, another recent study by UPenn’s Park finds that even moderately elevated temperatures—what he defines as days in the 80s and 90s—cause just as many excess deaths as record-breaking temperatures in the triple digits. Worse, he finds these same subtle consequences for wildfires, hurricanes, and other natural disasters—meaning that even noncatastrophic storms and weather trends have a serious effect on workers’ health and well-being and on broader economic activity and growth.
That’s why interventions such as the new OSHA heat rule are essential to protect U.S. workers from the damaging consequences of extreme—and even moderate—heat, as well as to bolster the broader economy so it can weather these effects. By protecting both indoor and outdoor workers, it stands to make a big impact—not just for those individual workers who would be protected, but also for their employers’ bottom lines and the sustainability of local U.S. economies. The federal government should adopt the rule and ensure it is enforced effectively across the United States so that all workers can benefit and none are left behind.
Did you find this content informative and engaging?
Get updates and stay in tune with U.S. economic inequality and growth!
Hospital consolidation and rising health care prices lead to job losses for U.S. workers

Overview
The majority of working-age adults in the United States have health insurance via their employers. Theory and a growing body of research suggest that when the cost of workers’ benefits go up, these cost increases are borne by workers and their employers.1 As a result, employer-sponsored insurance creates a link between what happens in the health care sector and labor market opportunities for workers outside that sector.
From 2000 to 2020, there were more than 1,000 hospital mergers among the approximately 5,000 hospitals in the United States. During this period, the Federal Trade Commission only took action to block 13 of those deals. Yet, in previously published work, we showed that approximately 20 percent of these hospital deals ran afoul of the U.S. Department of Justice and Federal Trade Commission’s Merger Guidelines, based on the resulting changes in the Herfindahl-Hirschman Index, a method that economists and regulators use to characterize the level of competition or concentration in a market.2 Further, we show that the average merger that ran afoul of the guidelines ultimately led to hospital price increases of 5 percent.
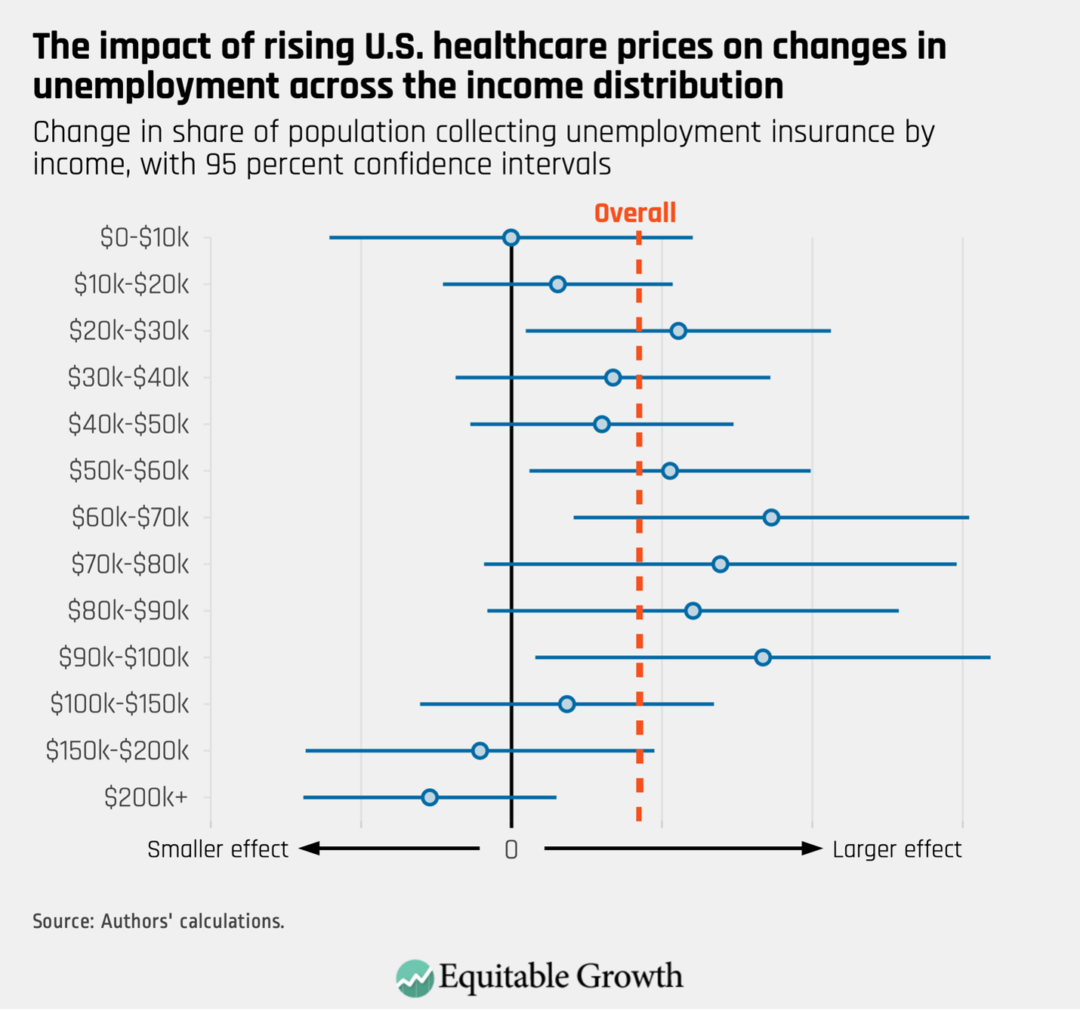
In newly released work, we analyze the downstream consequences of the price increases caused by hospital mergers.3 We show that a 1 percent increase in health care prices caused by a hospital merger lowers both payroll and the number of employees at firms outside the health sector by approximately 0.4 percent. At the county level, a 1 percent increase in health care prices reduces per capita labor income by 0.27 percent, increases flows into unemployment by approximately 0.1 percentage points, lowers federal income tax receipts by 0.4 percent, and increases Unemployment Insurance payments by 2.5 percent.
We also find that the job losses caused by rising health care prices are concentrated among low- and middle-income workers, whereas employment is virtually unchanged for U.S. workers earning more than $100,000 per year. In short, we find that hospital mergers that lead to price increases cause middle-income workers outside the health care sector to lose their jobs.
Our estimates also allow us to scale the effect of individual hospital mergers on local economies. We show, for example, that a hospital merger that raised prices by 5 percent would result in $32 million in lost wages, 203 job losses, and a $6.8 million reduction in federal tax revenue.
This issue brief explores the link between employer-sponsored health care and labor market outcomes in the United States before detailing the implications for workers, the broader U.S. economy, and competition policy.
Employer-sponsored health insurance and labor market outcomes
Over the past two decades, health care spending in the United States has surged, nearly doubling in real terms from $2.5 trillion in 2000 to $4.5 trillion in 2023.4 One of the primary drivers of the growth in health spending has been the sharp rise in the price of health care goods and services.
The hospital industry is a particularly stark example. Over the past two decades, hospital prices have outpaced the price growth in all other sectors of the U.S. economy.5 (See Figure 1.)
Figure 1
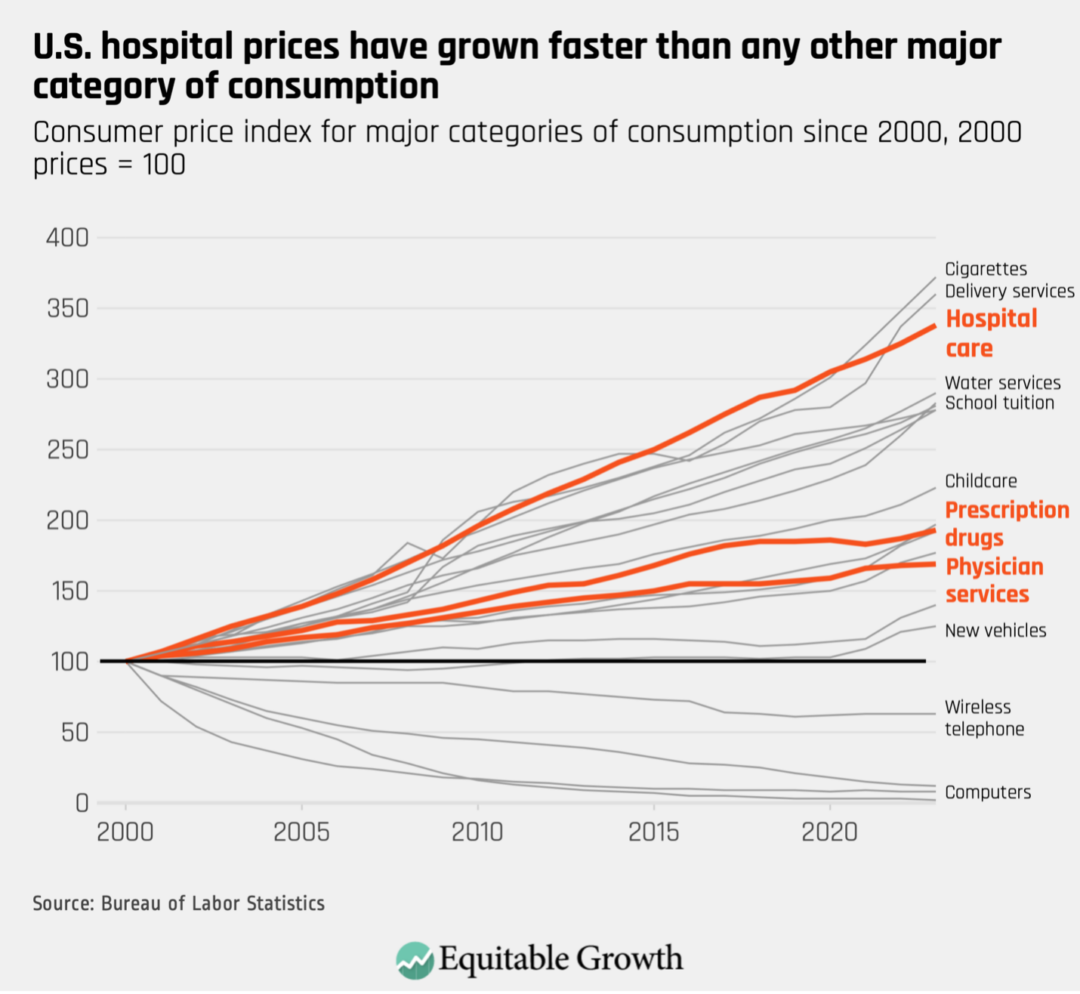
Across the U.S. economy, rising prices often reflect improvements in the quality of service, which benefit consumers. By contrast, many price increases in the U.S. health care sector are a result of industry tactics, such as mergers and acquisitions, surprise medical billing, upcoding, and patent hopping.6 These tactics boost revenues within the health sector without necessarily providing any additional value to customers.
So, who pays for rising health care prices in the United States?
In most markets, when sellers raise prices, these price increases are absorbed directly by customers—for hospitals, this would be their patients. Yet, because most patients in the United States have health insurance, when the price of hospital care rises by, say, 10 percent for a $20,000 hospitalization, little of this increase comes out of patients’ pockets. Instead, the bulk of that $2,000 price increase will be directly paid by patients’ insurers.
Insurers will not simply pay that $2,000, though. Insurers, like any other company, will respond to cost increases by changing the prices they charge to their customers. In the case of employer-sponsored health insurance, this means higher premiums for everyone covered by the employers’ health insurance plans.
This ability to “pass through” costs to another party means that those who ultimately pay for rising health care prices may be surprisingly far removed from the patients who receive care and the insurers who write the checks to health care providers.
The vast majority of working-age Americans receive health insurance through an employer, either via their own employer or through a spouse or family member’s employer. Employers pay steep premiums to provide this health insurance. As the prices for health care goods and services have increased, so too have insurance premiums. Over the past decade, insurance premiums grew by 47 percent, 17 percentage points faster than inflation.7 As a result, by 2023, average yearly health insurance premiums for a family of four reached $23,968—roughly the price of a new Toyota Corolla.8
At first blush, a nearly-$24,000 insurance plan might seem like a lavish benefit that employers are generously giving to their workers. Yet the prevailing view among economists is that employers often offset the cost of insurance by paying their workers less than they would in the absence of providing coverage. So, just as insurers pass on increases in health spending to their customers in the form of higher premiums, employers likely pass on the increase in premiums to their employees by lowering the wages they offer or even by reducing the number of workers they employ.
To the extent that employers pass through rising insurance premiums to their employees, then, it is U.S. workers who are paying for skyrocketing health care prices.
Examining downstream effects of hospital mergers and price increases
Our recent study examines the downstream effects of hospital mergers and rising health care prices. Our goal is to quantify who pays for increases in health care prices.
To do so, we use data on health care prices and utilization for millions of privately insured Americans from the Health Care Cost Institute, data from the U.S. Department of Labor on health insurance premiums for thousands of employers, and data from the Internal Revenue Service covering every income tax return filed in the United States. We use that data to trace out how an increase in health care prices—for example, a $2,000 increase on a $20,000 hospital bill—flows through to health spending, insurance premiums, the payroll at health care and non-health-care employers, average income per capita and unemployment in U.S. counties, and the tax revenue collected by the federal government.
To analyze the effects of rising prices, we study the consequences of hospital mergers in the United States. From 2002 to 2020, there were more than 1,000 hospital mergers among the approximately 5,000 U.S. hospitals.9 (See Figure 2.)
Figure 2
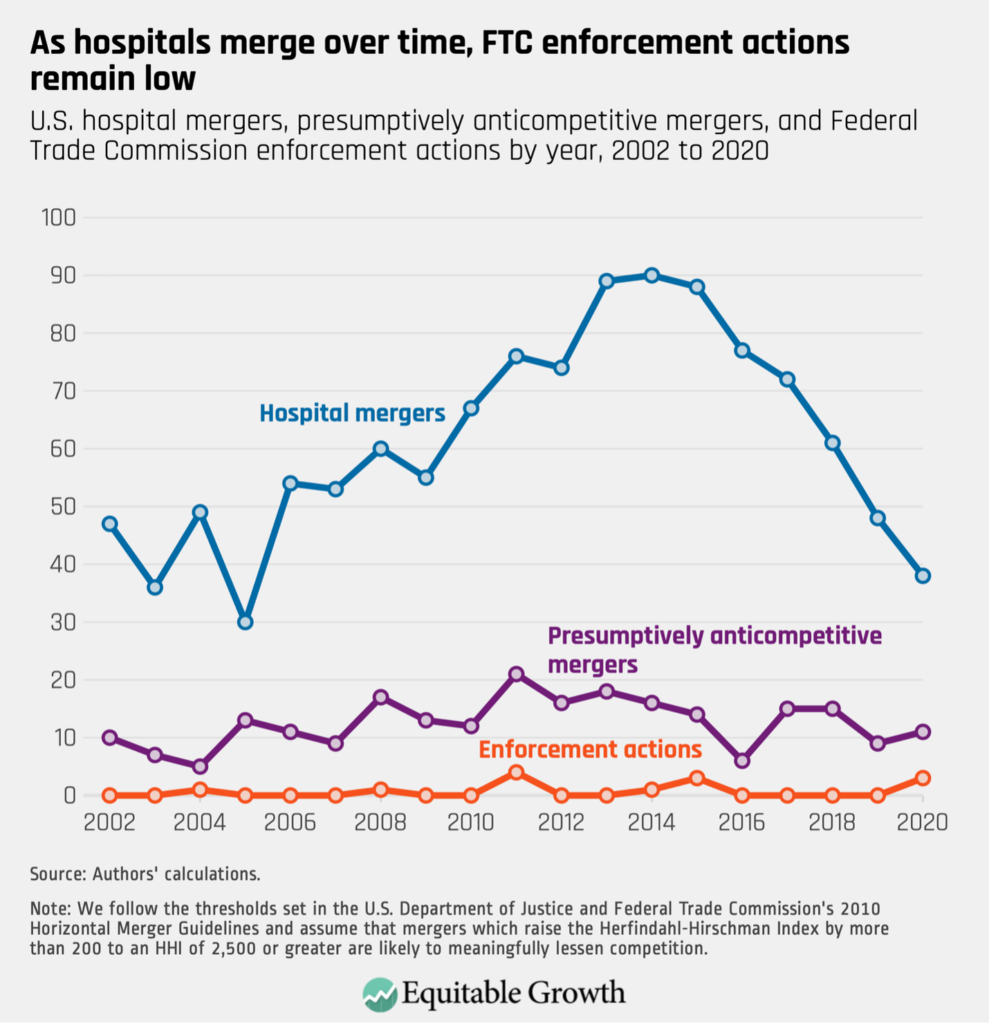
Many of these mergers substantially reduced competition. The 2010 U.S. Department of Justice and Federal Trade Commission’s Merger Guidelines state that mergers that result in an increase in the Herfindahl-Hirschman Index, or HHI, of at least 200 points and lead to a post-merger HHI of more than 2,500 should be “presumed to be likely to enhance market power” and thus are likely to result in price increases.10 In past work, we showed that approximately 20 percent of the hospital mergers from 2002 to 2020 could have been flagged as problematic according to these guidelines, and that these mergers raised prices by, on average, 5 percent.
How we study who pays for rising health care prices
To study the consequences of rising prices, we analyze employers and counties that face greater exposure to merger-driven hospital price increases. To do so, we estimate the price changes caused by every hospital merger in the United States from 2010 to 2015. We then measure the exposure of every U.S. employer with more than 50 employees to each of those mergers. A firm’s exposure to the price increases from these mergers is driven by a combination of factors: the number of mergers at hospitals where their workers get care, the degree to which a nearby merger reduces competition and raises prices, and the preferences of local workers over where they receive their care.
As we find in the data, employers and workers in counties that are more exposed to mergers face greater increases in health care prices. We then measure whether the employers and counties exposed to higher prices from 2010 to 2015 experienced reductions in payroll and employment.
Tracing how higher health care prices lead to increases in insurance premiums, lower wages, and reductions in employment
Our recent study shows that workers pay for the dysfunction in the U.S. health care industry.
We begin by showing that increases in health care spending caused by price increases are passed through on a dollar-for-dollar basis into higher insurance premiums. We then focus on how employers adjust their payroll and employment practices in response to these increases in insurance premiums. We find that a 1 percent increase in health care prices leads to a 0.4 percent decrease in employers’ total payroll.
This complete pass-through takes into account that a worker with employer-sponsored health insurance may also have a spouse and children on their insurance policy. That is, when health care prices go up, it doesn’t just increase health spending on workers employed by a firm, but it also increases the health spending on workers’ dependents, who also get their insurance coverage through the firm.
When the cost of providing health benefits goes up, firms may adjust by lowering workers’ wages or changing the number of workers they employ. Ultimately, we find that employers respond to increases in insurance premiums by reducing the number of workers they employ. We find that a 1 percent increase in health care prices caused by a hospital merger reduces employment at firms outside the health sector by approximately 0.4 percent. That is, employers are laying off workers to cover the higher costs of health care.
The unequal burden of rising health care prices
It is well-known that workers’ wages can vary markedly within a firm. Among the 1,000 largest publicly traded firms, for example, CEOs earn more than 100 times the wages of their median-wage employees.11
By contrast, while insurance premiums do vary modestly across workers within employers, they tend to vary much less than salaries.12 As a result, health insurance generally makes up a larger share of the total compensation for lower-wage workers relative to higher-wage workers.
Moreover, when health insurance premiums go up by $1,000 for all workers, this forms a larger proportional increase in the total compensation for a person in the mailroom—who earns, say, $20,000 per year—relative to a CEO, who makes $2,000,000 per year. So, while a $1,000 increase in insurance premiums could make it 5 percent more costly to retain the mailroom worker, it represents a miniscule increase in the cost of retaining a CEO.
As economists have described, rising health care spending can create more severe labor market consequences for lower-wage workers relative to higher-wage workers because health insurance premiums are fairly constant across workers.13 In a calibration exercise, Massachusetts Institute of Technology economist Amy Finkelstein and her co-authors highlight that, in the presence of employer-sponsored health insurance, rising health care costs are a leading driver of U.S. economic inequality and are leading to increases in inequality that are similar in scale to outsourcing, automation, and foreign trade.14
We show that these predictions bear out in practice. We observe that when health care prices increase, job losses are concentrated among workers earning between $20,000 and $100,000 annually. Yet we observe no decreases in employment for workers earning more than $100,000 annually. That is, when health care prices go up, the wealthiest Americans are spared from consequence, while the burden of the increase falls squarely on lower- and middle-income workers.15 (See Figure 3.)
Figure 3
Effects of rising health care prices on government spending
The harm from rising health care prices isn’t limited to job losses and income reductions for low- and middle-income workers. When workers lose their jobs, the government often steps in to provide Unemployment Insurance. As such, we find that when health care prices go up, Unemployment Insurance payments from the government also rise.
At the same time, when income goes down, so too does tax revenue. Therefore, we find that the aggregate effect of rising prices in the health care sector is an increase in government spending on Unemployment Insurance payments and a concurrent decrease in the amount of federal tax revenue that is collected from workers.
Effects on workers’ health and well-being
A growing body of research finds that job losses can have devastating health consequences. Duke University radiology professor Daniel Sullivan and economist Till von Wachter at the University of California, Los Angeles, for example, use administrative data from the 1970s and 1980s and find an increase in mortality for male workers who become unemployed.16
Likewise, Marcus Eliason at The Institute for Evaluation of Labour Market and Education Policy in Uppsala, Sweden, and Donald Storrie at the European Foundation for the Improvement of Living and Working Conditions, an agency of the European Commission, find that men face a 44 percent increase in mortality in the short term after a job loss. They also find that these increases occur concurrently with increases in hospitalization for self-harm, suicides, and drug overdoses.17
Similarly, University of Pennsylvania professor of medicine, medical ethics, and health policy Atheendar Venkataramani and colleagues find that in the wake of auto plant closures in the United States in the 2000s, there was a marked increase in opioid deaths in local counties.18 Across these studies, the authors find that approximately 1 in 300 to 1 in 600 of the individuals who lose their jobs die within a year. Consistent with this literature, we find that mortality from suicides and overdoses increases in the areas that experienced the largest increase in health care prices. In our analysis, we find that approximately 1 in 140 of the individuals who become separated from the labor market when health spending rises die from an opioid overdose or suicide within a year.
Our estimates appear higher than past estimates because we measure deaths per full separation from the labor market—individuals losing their jobs and ceasing to find new employment—whereas the past research focuses on deaths per job loss. If 1 in 3 of the individuals who lose their jobs become wholly separated from the labor market, which is largely what our results suggest, then our estimates of the effect of job losses on mortality are squarely in line with the findings of past research.
The aggregate consequences of rising health care prices
Our work highlights how a hospital merger can have severe downstream consequences for local labor markets and local economies. We find, for example, that a hospital merger that raises prices by 5 percent would lead to 203 local job losses (net of any gains in employment at the merging parties), approximately $32 million in forgone wages, a $6.8 million reduction in federal income tax revenue, and 1 to 2 additional suicide and overdose deaths. In other words, the overall economic harm from a merger that raised prices by 5 percent or more would be approximately $32 million in forgone income and approximately $9.6 million in economic harms from the deaths it would precipitate.
In past work, we noted that approximately 20 percent of hospital mergers per year over the past two decades could have been flagged by the Federal Trade Commission as likely to raise prices by lessening competition, according to federal Horizontal Merger Guidelines. Our work highlights that one year of these flagged transactions resulted in $400 million in lost wages, 2,543 job losses, $85 million in reductions in federal tax revenue, and between 12 deaths and 25 deaths annually. Collectively, this implies an economic harm from death and forgone income of approximately $500 million.
For context, the entirety of the Federal Trade Commission’s antitrust enforcement budget in 2023 was $490 million. As a result, the economic harm from a single year of mergers in the hospital industry—a sector that accounts for 6 percent of U.S. Gross Domestic Product—is approximately the size of the entire budget of the Federal Trade Commission.
Conclusion
The presence of employer-sponsored health insurance in the United States creates a link between what happens in health care markets and wages and employment at firms outside the health care sector. Our study shows that increases in health care prices are fully passed through to increases in insurance premiums and result in dollar-for-dollar decreases in firms’ payrolls. We find that firms respond to increases in health spending and insurance premiums by lowering the number of workers they employ. Notably, the job losses we observe are concentrated among workers earning less than $100,000 annually. As a result, rising health care prices in the United States are exacerbating economic inequality.
At a county level, we find that increases in health care prices lower income per capita, raise the share of individuals who receive Unemployment Insurance payments, and reduce income tax revenue collected by the federal government. That is, when health care prices go up, it results in higher federal spending and lower federal tax revenue.
Our results—that rising health care prices can lead to job losses—hold for any increase in prices in the health sector that is not driven by an increase in the quality of care that workers value. So, for instance, our results would generalize to increases in prices caused by surprise billing, upcoding, or vertical integration.
By contrast, our results may not fully generalize to the high prices of newly introduced innovative drugs. As innovative drugs are introduced, workers likely value the coverage for them, even as it increases spending. Thus, they are willing to forgo some wages to get these additional benefits.
Going forward, absent substantial changes in public policy that steer the United States away from employer-sponsored health insurance coverage, the most fruitful avenue for addressing the labor market consequences of rising health spending is to push for policies that increase productivity in the U.S. health care sector. This could include taking steps to strengthen antitrust enforcement, which could forestall anticompetitive price increases in the health sector.
Beyond strengthening antitrust enforcement, actions that reduce fraud in the health sector, address patent hopping and other price-increasing strategies in the pharmaceutical industry, and reduce surprise medical bills would all limit the types of health care price increases that workers outside the health care industry bear the burden of funding via their wages and employment.
—Zarek Brot-Goldberg is an assistant professor at the Harris School of Public Policy at the University of Chicago and a faculty research fellow at the National Bureau of Economic Research. Zack Cooper is an associate professor of public health and economics at Yale University and a faculty research fellow at the National Bureau of Economic Research. Stuart V. Craig is an assistant professor of risk and insurance at the University of Wisconsin–Madison’s School of Business. Lev Klarnet is a Ph.D. candidate in business economics at Harvard University.
Did you find this content informative and engaging?
Get updates and stay in tune with U.S. economic inequality and growth!
New federal heat standard offers novel distributional analysis to determine which workers benefit and how

The U.S. Department of Labor recently released a much-anticipated proposed rule that promises to protect workers from on-the-job injuries and deaths that result from toiling in the heat. The timing of the proposal was apt, given the high temperatures experienced across the country over the past few weeks.
As the Washington Center for Equitable Growth previously documented—evidence that was used by the Labor Department to justify its new proposal—worker injuries and deaths are much more common on hot days than on more temperate ones. Employees are more likely to experience both ailments directly caused by high temperatures, such as heat stroke, and indirect injuries that may not be formally categorized as weather-related—and may actually happen indoors—such as falling from heights, being struck by a moving vehicle, or mishandling dangerous machinery. These direct and indirect heat-based injuries not only are heartbreaking for families and communities, but also hurt firms’ bottom line by reducing their workers’ productivity.
The new proposal from the Labor Department’s Occupational Safety and Health Administration would require employers to offer water and as-needed breaks when the heat index, which combines temperature and humidity, reaches 80 degrees Fahrenheit. More stringent rules, including mandatory 15-minute breaks every 2 hours, would go into effect when the heat index reaches 90 degrees. Importantly, these requirements apply to both indoor and outdoor workers, though largely sedentary office workers, as well as remote workers, are excluded.
As most federal agencies do when drafting proposed rules, the Occupational Safety and Health Administration provides a regulatory impact analysis as part of its proposal, describing the costs and benefits of enacting the rule and comparing the proposal to possible alternatives. In this case, the agency finds that its proposal would yield $9.2 billion in benefits each year at an annual cost of $7.8 billion.
Yet the analysis that accompanies the heat standard proposal goes further than just counting the costs and benefits. It also provides a fairly in-depth and novel analysis of the distributional effects of the rule—or, said another way, to whom those costs and benefits accrue—finding that there will be a “positive impact” on underserved populations.
This distributional analysis, which focuses on low-income and historically underserved populations, is a response by the agency to President Joe Biden’s 2021 executive order on advancing equity for these groups across federal government agencies. It also reflects the White House Office of Management and Budget’s 2023 revision of the Circular A-4, a guidance document that enhanced what agencies are directed to do to take equity into account when making regulatory policy decisions.
Though other recently proposed regulatory policies—such as the Department of Labor’s overtime regulation—included some distributional analysis by demographic groups, the new proposed standard for “Heat Injury and Illness Prevention in Outdoor and Indoor Work Settings” provides a more thorough disaggregation of impacts.
The agency finds, for example, that workers from historically underserved communities have “greater exposure to occupational heat-related hazards, with more severe outcomes that impact their ability to work.” More specifically, it finds that men earning less than $60,000 a year are nearly twice as likely to be exposed to workplace heat-related hazards than women. (See Figure 1.)
Figure 1
The distributional analysis of the heat rule also finds that low-income Hispanic workers are more likely to be exposed to workplace heat-related hazards than workers of other races and ethnicities—a distinction especially acute in outdoor work settings. (See Figure 2.)
Figure 2
The analysis also finds that heat-related injuries and illnesses and heat-related fatalities are concentrated among workers who are low income, in peak earning years (ages 35 to 54), male, or Hispanic. These populations average 1,066 heat-related injuries and seven heat-related fatalities each year—though there is good reason to think these are underestimates.
Additionally, the Occupational Safety and Health Administration does a partial analysis of which businesses might face the highest cost of compliance with the new rule, including by looking at minority-owned firms that report being in financially precarious circumstances. Elsewhere in the regulatory impact analysis, the agency thoroughly examines, industry by industry, the economic feasibility of complying with the proposal, as well as the likely effects of the proposal on small businesses, finding that compliance costs are not prohibitive.
Given the complexities involved with conducting a comprehensive distributional investigation, there are still areas where the agency’s analysis could improve. The agency fails, for example, to examine granularly how the costs associated with the heat standard might be passed on to consumers or workers, instead merely gesturing at how sector-specific supply and demand elasticities will determine ultimate incidence of costs.
Additionally, the agency does not attempt to weight the costs and benefits by income, a new option provided to agencies under the revised Circular A-4. Weighting effectively equalizes the dollar-denominated preferences of high- and low-income U.S. workers, counteracting the high-income biases inherent in certain cost-benefit methodologies, such as determining would-be beneficiaries’ “willingness to pay” for regulatory changes.
Since the benefits from the heat standard proposal are exclusively the result of reduced worker fatalities and nonfatal injuries—which are already quantified in a standardized way that corrects in part for the bias against low-income people (for example, the value of a statistical life)—it would not make sense to weight this rule’s official benefits. But using an appendix to start experimenting with various weighting approaches on unofficial benefits, such as how a heat standard would enhance workers’ job satisfaction, would have been a welcome development.
The agency’s analysis also fails to formally quantify some of the more speculative economic spillovers that a national heat standard could deliver, such as a higher supply of labor, lower worker turnover, and higher cognitive processing. That said, the proposal’s authors do summarize that evidence in their analysis.
Less substantively, the agency’s ultimate conclusion about the proposed rule’s distributional impact is buried on page 989 of a 1,156-page, multipart document. More prominently highlighting these important findings, as well as the total costs and benefits, for policymakers and other readers would be useful.
Finally, the regulatory impact analysis uses current temperature information to estimate how many 80- and 90-degree-plus days businesses will face going forward, but there is little reckoning with the proverbial elephant in the room: that heat waves are becoming more severe and more frequent almost every year due to climate change. Taking this into account would likely increase both the costs and benefits of the rule. As such, it might not make a difference in the final conclusion, but it would more accurately describe the urgent need to adopt the proposed rule.
Overall, though, this proposed heat rule marks a major step toward more thorough regulatory impact analyses that take not just overall costs and benefits into account, but also studies to whom those costs and benefits accrue. This will ensure that the most vulnerable workers, who often have the most to gain, are more fully taken into account, rather than using a calculation that tends to favor higher-income, White workers and business owners. We hope other federal agencies follow suit and continue to improve on the Occupational Safety and Health Administration’s distributional work in this proposed rule.
Did you find this content informative and engaging?
Get updates and stay in tune with U.S. economic inequality and growth!