Factsheet: Is the U.S. economy in a recession, and how does recession dating work?
As inflationary pressure continues to cause higher prices for U.S. families, policymakers and economists alike continue to debate whether the United States is entering—or already entered, or will soon enter—a recession.
This debate is complicated because current economic indicators tend to disagree with one another and diverge from historical recession trends, obscuring a definite answer. Though the U.S. economy’s recent performance does satisfy the widely used two-quarter rule—in which two back-to-back quarters of shrinking Gross Domestic Product can indicate a recession—it is far from clear whether the economy is indeed contracting, especially considering the very robust current labor market. Just last week, the U.S. Bureau of Labor Statistics announced that the U.S. economy added 528,000 jobs in July 2022, an extremely strong number that would normally be associated with a roaring economy.
So, what is a recession, and how do we know when the U.S. economy is actually in one? Who decides when it starts and ends, and why is recession dating important? This factsheet answers these questions and more to shine a light on how recessions are dated and why recession dating is a complicated and necessary economic calculation.
What is a recession?
There are three characteristics that define a recession, according to the National Bureau of Economic Research, the entity that analyzes U.S. business cycles: Economic activity must decline significantly, broadly across the economy, and for more than a few months. More specifically:
- A recession is essentially an economic contraction. That is, it indicates that the economy is actively getting smaller. It is not an analysis of the actual health of the economy but rather of the direction in which the economy is headed. If the economy is getting worse, then it is in a recession. If the economy is getting better—even if it’s very slow or starting from a bad place—then it is expanding.
- A range of economic indicators contribute to the calculations of this activity, but generally, the result closely mirrors Gross Domestic Product. Some indicators that NBER specifically mentions are personal income less transfers, nonfarm employment, consumption levels, retail sales, employment, and industrial production, though that is not a comprehensive list.
What is the difference between a recession and a depression?
There’s no official definition of a depression. The term “depression” is usually reserved for especially deep recessions. A drop in GDP of 10 percent or more is one rule of thumb, and most people think of depressions as being more prolonged than recessions, which are typically relatively short. The previous U.S. economic depression was the Great Depression in the 1930s.
The Great Recession was not deep enough to qualify as a depression, even though it was the deepest U.S. downturn since the Great Depression. The COVID-19 recession was arguably deep enough to be considered a depression, but it was too short-lived.
Who decides when a recession begins and ends?
In the United States, the National Bureau of Economic Research has a standing committee that, since 1978, has been officially tasked with recession-dating responsibility. (The committee does not declare or date depressions, however.) The NBER president determines who sits on the committee, which currently includes Robert Hall of Stanford University, Robert J. Gordon of Northwestern University, James Poterba of the Massachusetts Institute of Technology, Valerie Ramey of the University of California, San Diego, UC Berkeley’s Christina Romer and David Romer, James Stock of Harvard University, and Princeton University’s Mark W. Watson. Committee members are typically macroeconomists and other researchers who study the business cycle.
Other important details include:
- NBER is a private nonprofit research organization, not a government entity. But the recession dates that NBER calculates are considered official and are recognized by all U.S. federal economic agencies, including the U.S. Bureau of Labor Statistics, the U.S. Bureau of Economic Analysis, and others.
- Other countries have adopted a similar model using official business cycle dating committees, including Japan, France, Spain, Brazil, and Canada. The United States is not unusual or unique in this regard, though in most other countries, the committees do not have as much official buy-in as NBER’s committee does.
How does recession dating work?
The NBER committee identifies a peak month in the economy using the economic indicators mentioned above; the recession begins in the month after that peak. The committee then identifies a trough month, usually several months after the trough has occurred; that trough month is considered the end of the recession.
When dating the COVID-19 recession, for example, the committee labeled the peak month as February 2020, meaning it dated the start of the recession as March 2020. The trough month was April 2020, which NBER considers inclusive, so the recession started at the beginning of March 2020 and ended at the end of April 2020, making it a 2-month recession.
Why not use the two-quarter rule?
While the two-quarter rule is a convenient monitoring tool for more casual economic observers, economists do not use it when officially analyzing business cycles and dating recessions because it is not a consistent method of recession dating. The 2001 recession, for example, did not feature two consecutive quarters of declining economic growth. Other indicators suggested a contraction in the economy, leading NBER to label it a recession, despite just one quarter of contracting GDP.
There also can be measurement errors in GDP calculations, which is why NBER does not date recession using solely GDP. The 2008 recession, for instance, like the 2001 recession, did not feature two consecutive quarters of decline at the time, though later revisions of GDP did show negative growth in this period. In 2008, NBER decided it was a recession even as the Bureau of Economic Analysis showed positive GDP growth, because the committee could see from other indicators that the economy was performing very poorly.
What’s more, countries that use the two-quarter rule sometimes have to subsequently “roll back” a recession date when later revisions show that GDP was not, in fact, declining in a particular period of time.
What about the Sahm rule, or alternative methods of recession dating?
The Sahm rule states that an economy has entered a recession when the 3-month average of the unemployment rate is half of a percentage point or more greater than its minimum over the past 12 months. It was not initially meant to be a way of dating recessions. Rather, it was intended to predict recessions before they start so policymakers could respond accordingly or as a trigger for automatic stabilizers to kick in.
The Sahm rule is a better predictor of recessions than some other commonly proposed methods—for example, the inverted yield curve, which is when the market rate for short-term borrowing exceeds that of long-term borrowing. Applying the Sahm rule to past recessions results in very few false positives.
Some economists—UC Berkeley’s Christina and David Romer, for instance—prefer deterministic models that remove components of human judgement. Others lean toward using slightly different groups of aggregate economic indicators.
The recessions these alternative models generate are usually very similar to those identified by the NBER dating committee. They are frequently touted as being faster than the NBER method, which often is decided on a significant lag to avoid having to change recession dates due to new or recalculated data. That is, other methods can produce dates for the recession just a couple months after the trough, whereas the NBER method sometimes takes a year or more.
How does inequality affect recession dating?
Inequality has a significant effect on recession dating. Economic growth calculations are typically done at the aggregate level, meaning that some demographic groups or geographic areas can still experience economic contraction even as the broader economy is growing and thus considered to be in an expansion. This data aggregation, coupled with the fact that more and more wealth and income is controlled by a smaller group of people, means that an expansion for the top income-earners can look, in aggregate, like an expansion for the entire economy—even if it isn’t.
In fact, this is similar to what happened during the Great Recession of 2007–2009. Initially, the bottom 50 percent of the income distribution fared relatively well, propped up by recovery packages and increased use of income support programs and other government transfers. Yet when these programs ended and U.S. policymakers turned toward austerity policies, the bottom 50 percent suffered. (See Figure 1.)
Figure 1
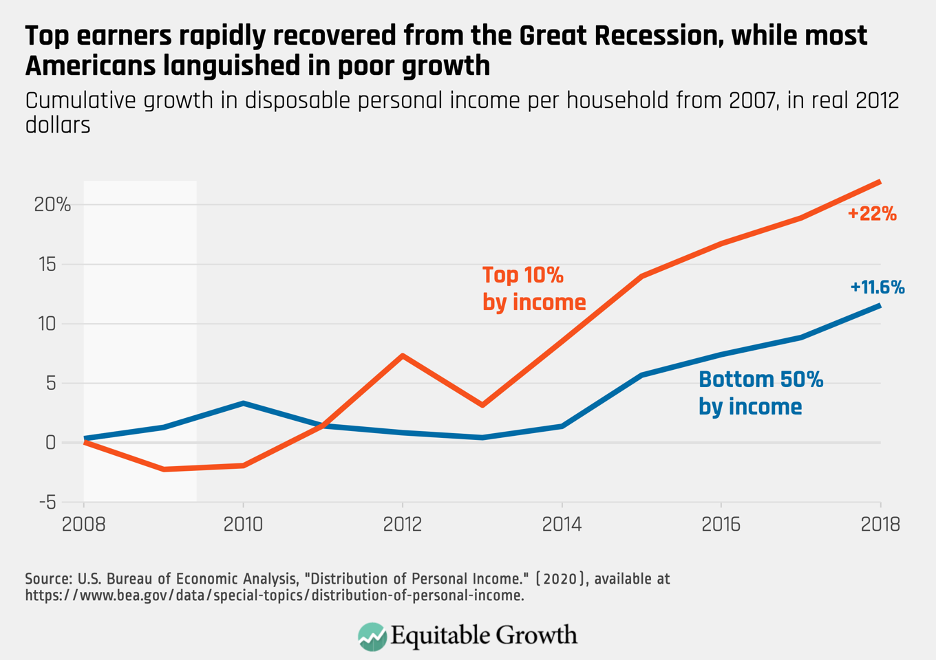
As Figure 1 shows, the bottom 50 percent entered a recession that was particular to them as a group, lasting from at least 2010 to 2013. Because the economy overall grew during this period—driven largely by growth in the top of the income distribution—this period is not a recession.
Why is recession dating important?
Different stakeholders have different reasons for caring about recession dating. It matters to macroeconomists, who investigate the causes and consequences of recessions and need to know how to specify whether certain observations in their data occur before, during, or after a downturn. More specifically:
- Recessions can affect economic activity and household and business decisions—all of which can also impact inflation.
- Recession dating is not meant to be a signal to the public or policymakers, though it has obvious political implications. Having a common understanding of when or whether a recession takes place prevents the possibility of politics obscuring the reality of the economic situation for U.S. workers and households for political gain.
 post
post
 Coronavirus Recession
 Equitable Recovery
So, is the U.S. economy currently in a recession?
The short answer is that it’s hard to say. While the two-quarter rule would indicate that it is, there has also never been a recession declared without a loss in employment—and the U.S. labor market is adding hundreds of thousands of jobs each month.
Additionally, while GDP did shrink over the past two quarters, a related indicator of economic growth—Gross Domestic Income, a measure of total output that aggregates income instead of production—suggests that the economy is growing. GDP and GDI should be equal to one another, but there is always a discrepancy between the two. Currently, the two measures are offering very different views of the economy, with GDP suggesting the economy is shrinking while GDI indicating the opposite.
What is clear is that if the U.S. economy does enter a recession—or if it already has and just hasn’t been announced yet—it will likely look very different from previous recessions.