Equitable Growth’s Jobs Day Graphs: July 2022 Report Edition
On August 5, the U.S. Bureau of Labor Statistics released new data on the U.S. labor market during the month of July. Below are five graphs compiled by Equitable Growth staff highlighting important trends in the data.
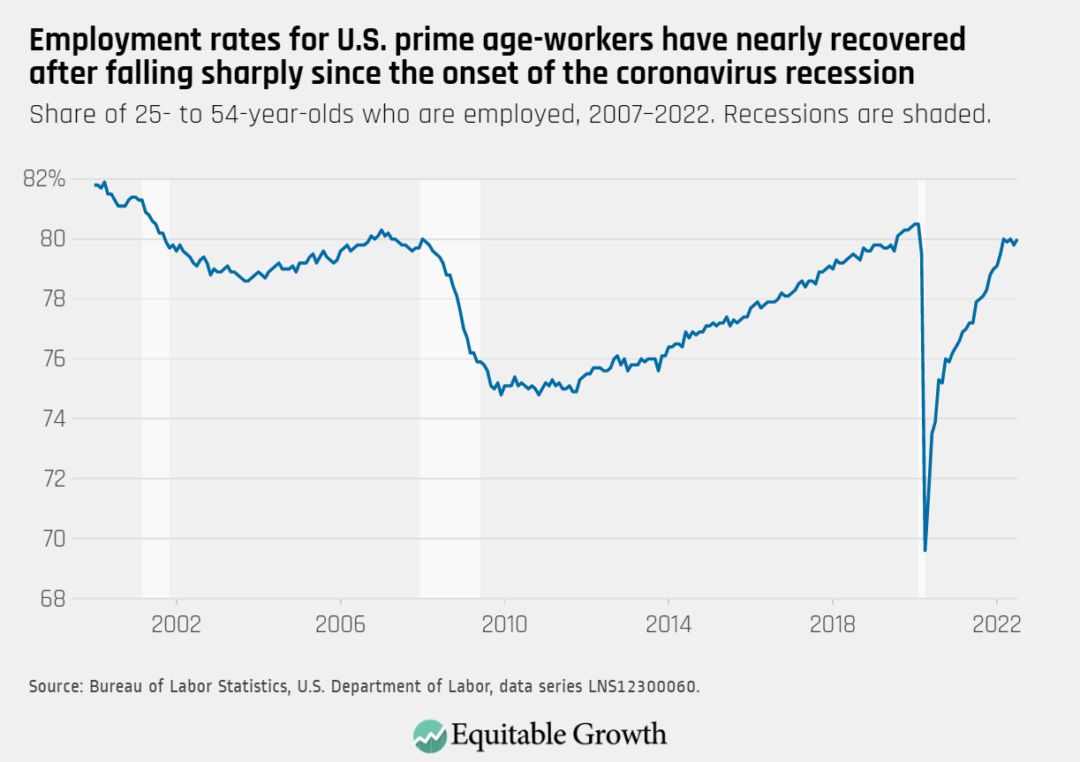
Total nonfarm employment increased by 528,000 in July, and the employment rate for prime-age workers rose to 80.0 percent.
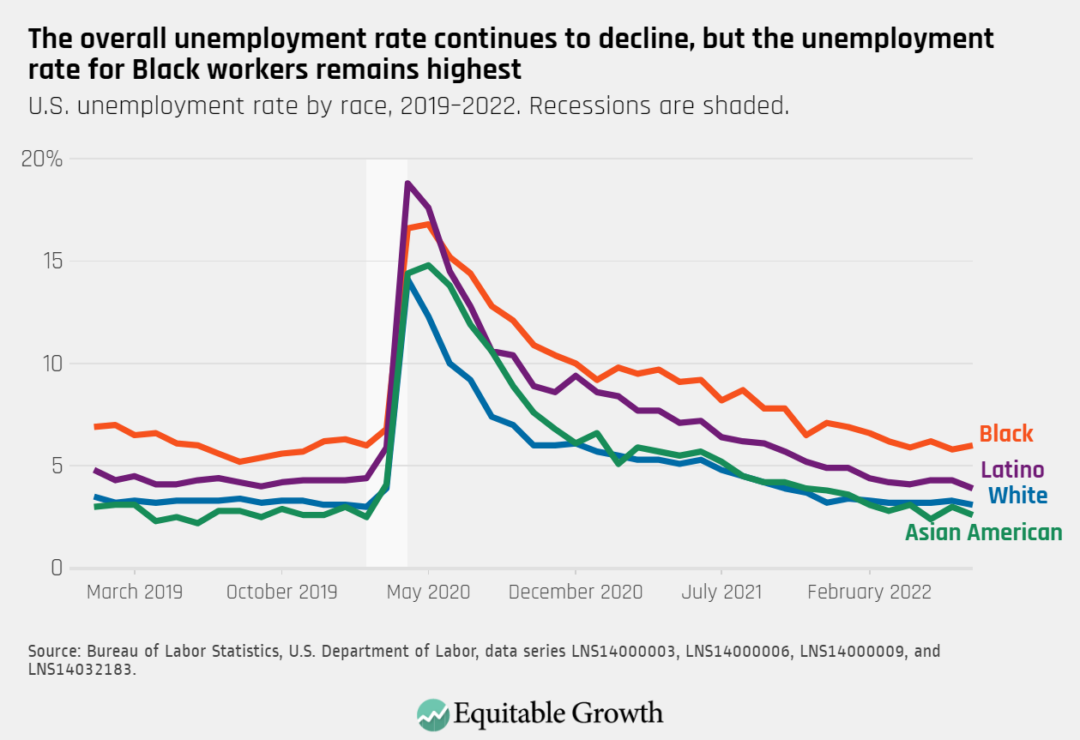
The unemployment rate decreased to 3.5 percent in July and remains highest for Black workers (6.0 percent), followed by Latino workers (3.9 percent), White workers (3.1 percent), and Asian American workers (2.6 percent).
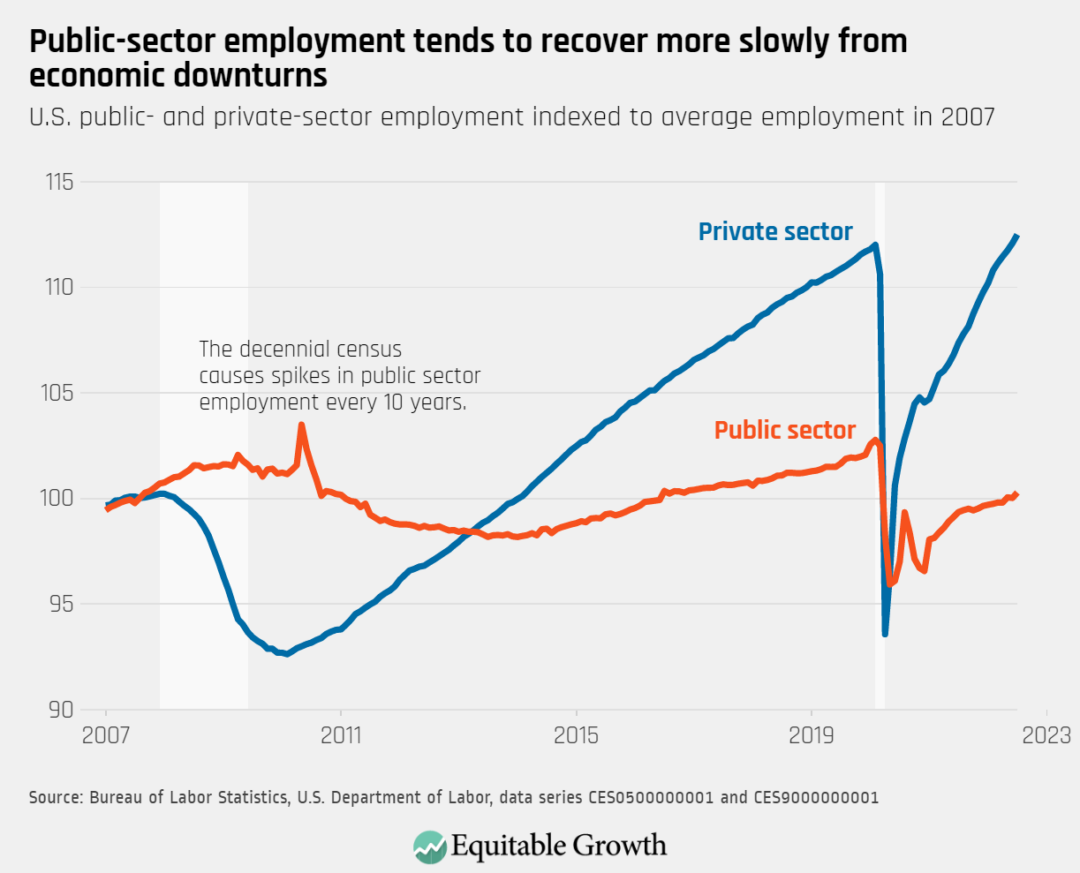
Private-sector employment continued to rise in July, while public-sector employment has recovered more slowly and remains below pre-pandemic levels.
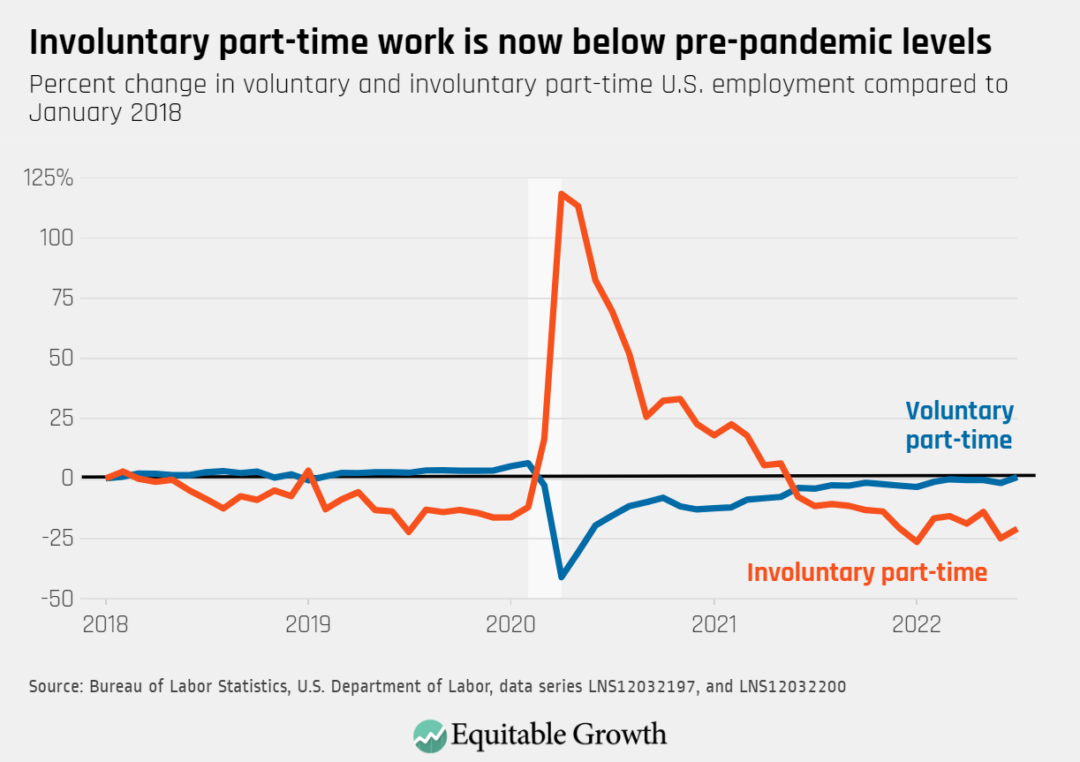
Involuntary part-time work, which represents part-time workers who would prefer full-time work, increased in July, but remains low relative to the past five years.
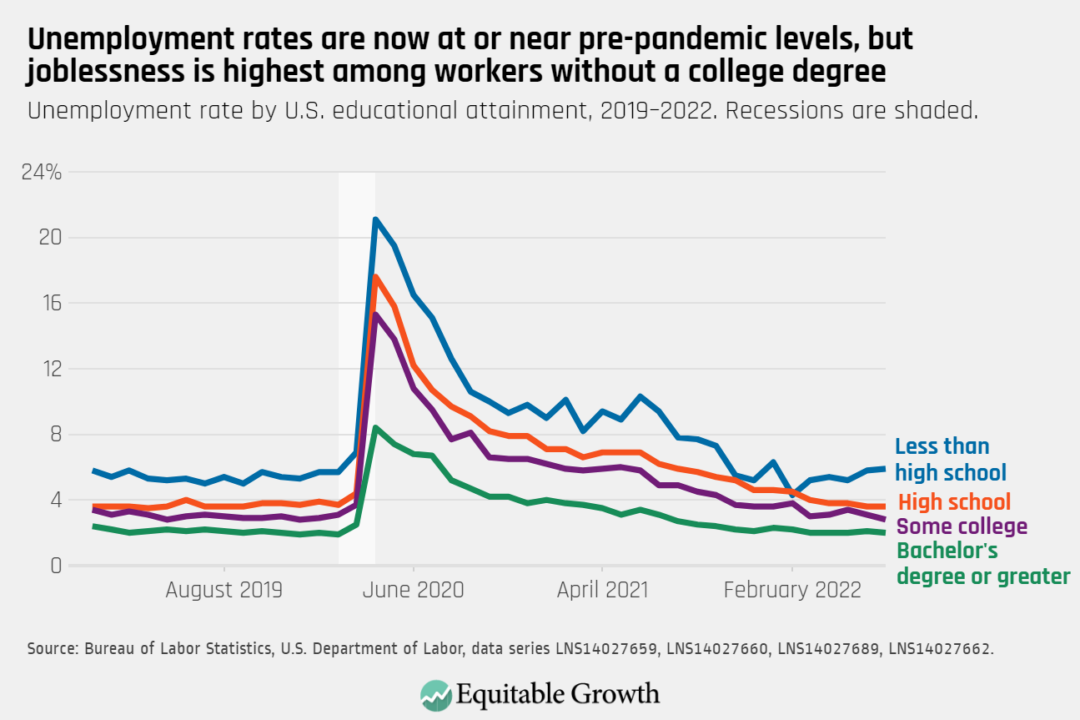
Unemployment rates are now 5.9 percent for workers with less than a high school degree and 3.6 percent for high school graduates, and down to 2.8 percent for workers with some college and 2.0 percent for college graduates.