Statement on the passing of Nobel laureate Robert Solow

A founding member of the Washington Center for Equitable Growth’s Steering Committee, Solow was also a longtime partner and advisor to the organization
Robert Solow, the Nobel laureate and longtime economics professor emeritus at the Massachusetts Institute of Technology, passed away in late 2023. Solow revolutionized the field with his insights on the role of technological innovation in driving economic growth. Many of us at the Washington Center for Equitable Growth, including our past and current staff, learned from him both directly and indirectly over the years because of his seminal role in the creation and growth of our organization.
Starting in 2008, Solow collaborated with the Sandler Foundation in leading a series of meetings with economic thought leaders who would go on to found Equitable Growth, among them former White House Chief of Staff John Podesta, Princeton economics professor and former Vice Chairman of the Board of Governors of the Federal Reserve System Alan Blinder, and University of California, Berkeley economics professor Emmanuel Saez. Solow’s economic wisdom, pragmatic orientation, and high standards were critical to those meetings and to the drive to create Equitable Growth.
With Solow on board with the idea of what would eventually become Equitable Growth, Podesta and co-founder and former president and CEO Heather Boushey proceeded with the creation of the organization. Meanwhile, Solow and Saez helped build our highly influential Steering Committee, which has provided critical guidance to the organization’s development and grantmaking since its founding.
True to form, Solow threw himself into making Equitable Growth a success. For the launch of Equitable Growth, he sat down for an extended chat on why understanding the need for more equitable U.S. economic growth is so vital to strong, sustainable, and broad-based growth. One of our first events, co-hosted by the Economic Policy Institute, featured Solow and the suddenly very famous Thomas Piketty, the Paris School of Economics professor who had just released his revolutionary book, Capital in the 21st Century, on rising wealth and income inequality around the world.
Always generous with his time, Solow also gave two private seminars to Equitable Growth staff in our early days, helping all of us better understand the underlying dynamics behind economic inequality. In 2017, he sat down for an interview with Boushey in one of the first installments of our “In Conversation” series.
Solow’s contributions to the early and enduring success of our academic grantmaking program is incalculable. He was central to the development of our initial Request for Proposals, which identified core drivers of economic growth: innovation and human capital. This first RFP also identified how inequality could be a drag on growth by creating macroeconomic and financial imbalances, stifling the development and deployment of human capital, and eroding the quality of and trust in the socio-political institutions that govern the economic commons.
This overarching frame has guided our grantmaking since that first Request for Proposals and led to important research showing, for example, that racial and gender discrimination is leading to a misallocation of talent that, in turn, affects aggregate productivity in the economy. “I see and experience the legacy of Robert Solow in so many ways at Equitable Growth,” said president and CEO Shayna Strom. “His insights into the dynamics of inequality in the size and distribution of income and wealth in our nation continue to guide our grantmaking and policy research and analysis.”
For more than half a century, Robert Solow was a giant in economics, and we were fortunate and honored to have had him as one of our most important early mentors and supporters. His legacy will live on in the people and institutions he touched, including Equitable Growth.
“Bob was an American treasure and as delightful a human being as he was a pillar of economics,” said Steve Daetz, president of the Sandler Foundation and Equitable Growth’s board chair. “His warmth, humor, intellect, and pragmatic insights were present in every meeting, and his active engagement in Equitable Growth’s founding was inspiring and indispensable.”
New research doesn’t overturn consensus on rising U.S. income inequality
Fast facts
New research from Gerald Auten at the U.S. Treasury Department and David Splinter at the U.S. Congress’ Joint Committee on Taxation makes the counter-to-conventional-wisdom claim that U.S. income inequality has not increased significantly over the past 60 years. The two co-authors take issue with many of the assumptions made by Thomas Piketty of the Paris School of Economics and the University of California, Berkeley’s Emmanuel Saez and Gabriel Zucman in their frequently cited data series measuring levels of income inequality in the United States.
This issue brief analyzes this recent debate in the measurement of income inequality in the United States. I compare the Auten-Splinter data to the data from Piketty, Saez, and Zucman’s research. I also examine in detail three places where Auten and Splinter and Piketty, Saez, and Zucman make different methodological choices.
Based on this analysis, I argue that the Auten-Splinter data series does not overturn the existing consensus around growing U.S. income inequality. I find that:
- Auten and Splinter’s results run counter to the signals from the distribution of U.S. wealth, which has become significantly more concentrated at the top.
- The largest discrepancy between the Auten and Splinter data and the Piketty, Saez, and Zucman data is in the distribution of underreported income. The Piketty, Saez, and Zucman method better reflects recent research into tax evasion.
- The methods Auten and Splinter use to distribute government consumption and deficits in their after-tax series significantly inflates the bottom 50 percent of incomes and reduces the top 1 percent of incomes, but their methods are not guided by empirics and make assumptions that can fail in certain situations.
- The growth of so-called in-kind transfers for the bottom 50 percent of the income distribution—transfers that provide a service rather than cash income—is eroding the economic well-being of that group, independent of changes in their income share.
Introduction
The common narrative about income inequality in the United States goes as follows: Starting from astronomical levels in the late 1800s and early 1900s, symbolized by the avaricious “robber barons” of the time, income inequality started to drop in the 1940s and bottomed out in the 1970s before returning to haunt the U.S. economy in the 1980s, with high levels persisting to this day.
Now, however, economists Gerald Auten at the U.S. Treasury Department and David Splinter at the U.S. Congress’ Joint Committee on Taxation claim that this history over the past 60 years is all wrong. According to their recent study, income inequality—as measured by the share of income earned by the top 1 percent—has risen by much less than is generally claimed. They also argue that the increase in pre-tax-and-transfer income inequality has been completely wiped out by government interventions, the result being that after-tax-and-transfer income inequality has changed very little between 1960 and today. (For simplicity, I will hereafter refer to these two different income measures as pre-tax and after-tax income).
Auten and Splinter’s research is not new. Earlier versions of the paper have drawn attention in the media, but this research is now set to publish in a top economics journal, and journalists and pundits alike are taking note.
Yet their results seem to contradict signals about growing inequality that we receive from other sources. For example, top 1 percent shares of wealth, as measured by the Survey of Consumer Finances, has increased by 7.5 percentage points between 1989 and 2019. It’s not immediately clear how wealth concentration could increase so sharply without a corresponding increase in income concentration.
There is a growing gap in life outcomes as well. Individuals from all income groups in the United States are more likely to complete college now than they were in the past, yet the gap in college completion rates between low- and high-income individuals has gotten larger and there is a growing income-based achievement gap in educational outcomes. Likewise, gaps in life expectancy are growing; high-income Americans added nearly 2 years of life expectancy between 2001 and 2014, while low-income Americans saw very little increase.
The Auten-Splinter estimates also directly contradict oft-cited earlier work by Thomas Piketty of the Paris School of Economics and the University of California, Berkeley’s Emmanuel Saez and Gabriel Zucman. They find a considerably larger rise in pre-tax income inequality over the past six decades. Additionally, the Piketty, Saez, and Zucman team finds that even after taxes and transfer payments from the government are added to people’s incomes, U.S. income inequality has still risen considerably, compared to the early 1960s.
Both sides in this debate agree that inequality dipped somewhat in the 1970s and then rose, both before and after government intervention. But the two teams find significant differences in both the level of income inequality and trends through time. Generally, they diverge in the following ways:
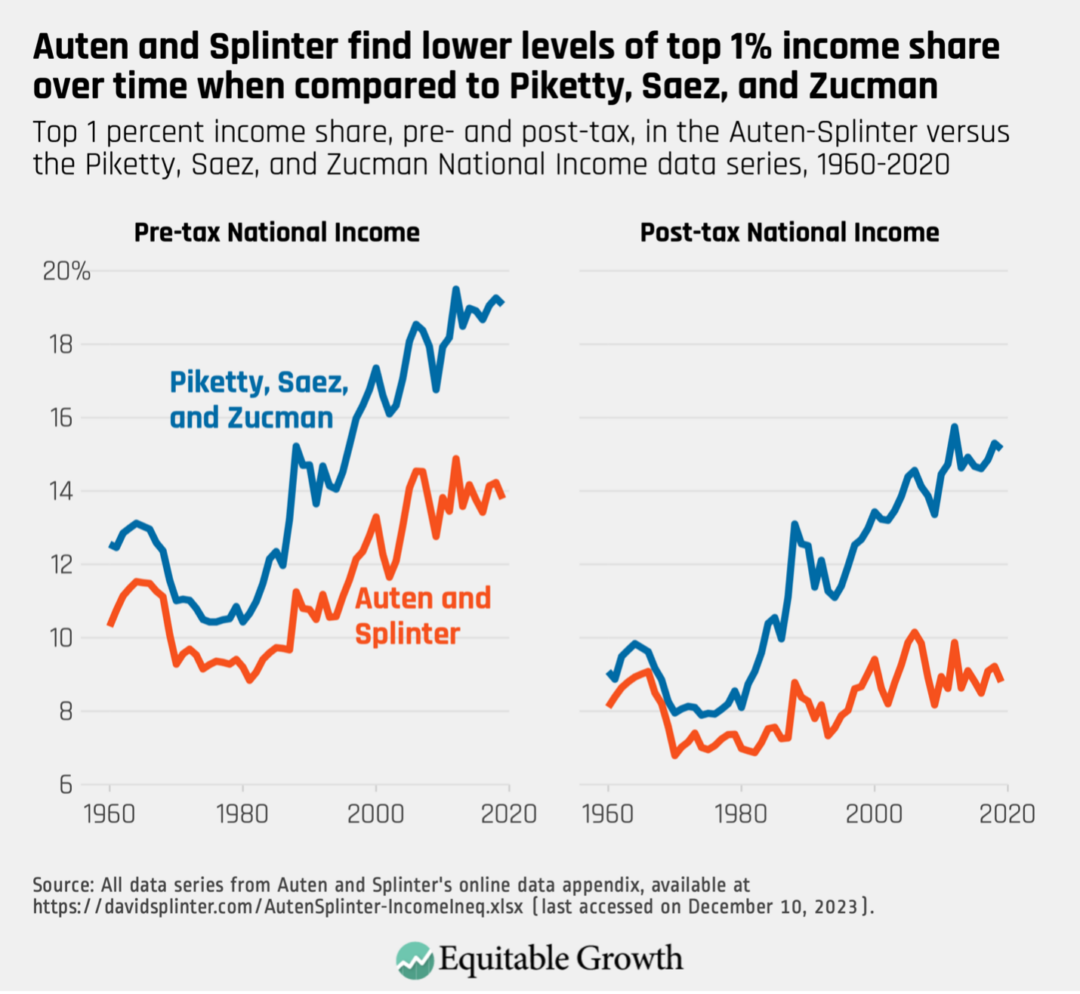
- Auten and Splinter find lower levels of top 1 percent income share in every year between 1960 and 2019. (See Figure 1.)
- Auten and Splinter find a slower upward trend in the top 1 percent share of income over time.
- Auten and Splinter find that adding taxes and transfers removes most of the upward trend in income inequality over time, with the result that top income shares in 2019 are similar to those observed in the early 1960s.
Figure 1
Auten and Splinter’s results mark a significant break with the existing literature on income inequality in the United States and could have far-reaching implications for how we understand the U.S. economy. In addition to the differences between their series and that of Piketty, Saez, and Zucman, the Auten-Splinter series is also somewhat at odds with data produced by the Congressional Budget Office, which show a significant rise in the top 1 percent’s share of income even after accounting for government taxes and transfers.
The public debate about their findings has been difficult to follow for economists and noneconomists alike. Understanding each team’s various assumptions requires deep knowledge of tax policy and the national accounts. Moreover, there have been relatively few economists outside of these two teams who feel comfortable weighing in on this very complex subject.
In this brief, I provide an overview of the key points of this debate and some guidance for how this new research fits into what we know about income inequality. Auten and Splinter have made some useful contributions to the developing field of distributional national accounts. There is more work to be done to pin down exactly how much inequality has risen. But I argue this research does not fundamentally change the familiar story of rising income inequality in the United States.
In part, my view reflects disagreement with Auten and Splinter over assumptions they make when distributing specific components of National Income. But there are other reasons to be skeptical of their estimates. The large decrease in income inequality observed in their after-tax series, in particular, is due to an ad-hoc allocation of government spending that virtually no one thinks of as income.
Below, I first provide some context on the importance of income definitions. Then, I look at three significant differences between the Auten-Splinter dataset and the Piketty, Saez, and Zucman dataset. I explain why these teams made different assumptions about the data and how it informs each one’s final product. In the final section, I offer some concluding thoughts on income inequality in the United States.
Defining income concepts
Understanding this debate over U.S. income inequality requires some basic knowledge about the different income concepts economists commonly use. There are many different academic and nonacademic attempts to measure inequality, and most are difficult to compare because they define income differently.
If you ask average people what their incomes are, they might report their wages—the income they earn from performing their jobs. Business owners may mention the profits their businesses earn that they pay to themselves. Perhaps individuals may also think to include dividend income from stocks they own or the capital gains from one-time sales of stock. These are all tangible income streams that these people will have to report to the IRS and on which they will have to pay taxes.
Yet people might not think to report some types of income that don’t ever really show up in their bank accounts. Most workers, for example, don’t include their employer’s share of payroll taxes in calculations of their salaries, and they certainly don’t think to include some portion of the corporate taxes paid by their employers.
Economists, however, often consider these to be income. Payroll taxes are split evenly between employers and employees in the United States, and the employers’ portion is a tax that workers would otherwise have to shoulder themselves. Corporate taxes are a deduction from corporate income that might otherwise be paid out as wages and returns to owners of capital.
As an example of all the income streams economists consider, let’s look at how the Congressional Budget Office’s Distribution of Household Income report, which also measures income inequality in the U.S. economy, constructs pre- and post-tax measures of income. It starts with an income concept called market income, which includes wages and salaries, contributions to retirement plans, corporate taxes, business income, capital gains, other forms of capital income such as dividends and interest, and retirement income. This is a pre-tax-and-transfer measure of income—notice that it doesn’t include transfers, such as Medicaid or the Supplemental Nutrition Assistance Program, and doesn’t deduct federal taxes (or any other kind of taxes) from people’s incomes.
To arrive at what the Congressional Budget Office calls “income before taxes and transfers,” it adds in social insurance benefits. Social insurance benefits are transfers from the government that are not means tested and are funded by payroll taxes, including Social Security, Medicare, Unemployment Insurance, and workers’ compensation. Medicare is not a cash transfer to households, but it is a service-in-kind that households would otherwise have to purchase.
How exactly an in-kind service such as Medicare should be valued as income is an active area of debate in economics. In all the income concepts discussed in this issue brief, Medicare is valued at the cost of provision. In other words, if the average per-person cost of Medicare to the government is $20,000, that amount is added to the income of each Medicare recipient.
Finally, to create its “income after taxes and transfers” concept, the Congressional Budget Office subtracts federal taxes paid, which includes individual income taxes, as well as corporate taxes and federal excise taxes on items such as gasoline and alcoholic beverages. Some individuals who receive refundable tax credits, such as the Earned Income Tax Credit, could see their income increase in this step. Once taxes are subtracted, means-tested transfers, including Medicaid, the Children’s Health Insurance Program, SNAP benefits, and others, are added.
To be sure, the CBO income concept includes some things that most people probably don’t think of as income. Medicare and Medicaid are not cash income, for instance, and corporate taxes are not something most workers consider to be part of their incomes. But, generally speaking, it is fairly clear why these items are included when studying the concentration of income in the U.S. economy.
At the same time, the CBO approach is somewhat ad-hoc. It misses some income that people earn—for example, it doesn’t include underreported income. Underreported income is income that isn’t correctly reported to the IRS, either because income earners made a mistake or because they are trying to evade federal taxes.
A more standardized approach would use an income concept that can be applied across time and countries. This is the motivation for looking at the National Income and Product Accounts, or NIPAs. These are comprehensive and consistent income concepts that are used to measure economic activity.
Most people are familiar with one of these accounts: Gross Domestic Product, or GDP. But a closely related account is National Income, a national accounts income concept that totals all income earned by people and businesses in the U.S. economy. It was worth about $22 trillion in 2022, which is about 84 percent of GDP. By distributing 100 percent of the income in the National Income aggregate, economists hope to achieve a more comprehensive distribution of income that is comparable across time and between countries.
While National Income is a more comprehensive income definition than the one used by the Congressional Budget Office, it likewise includes items that may not typically be considered as income. For instance, it includes imputed rent, which is an estimated economic return that comes from owning a house and paying yourself for occupancy of that house. Imputing rent to homeowners makes sure that renters and owners are treated similarly by the national accounts, but one might reasonably object that this doesn’t seem like actual income.
The NIPAs don’t include capital gains but do include retained corporate earnings. These are undistributed corporate profits that are, in effect, a proxy for unrealized capital gains. Retained corporate earnings will eventually be disbursed to shareholders, so distributing this money to individuals reflects increases in their income due to the appreciation of financial assets.
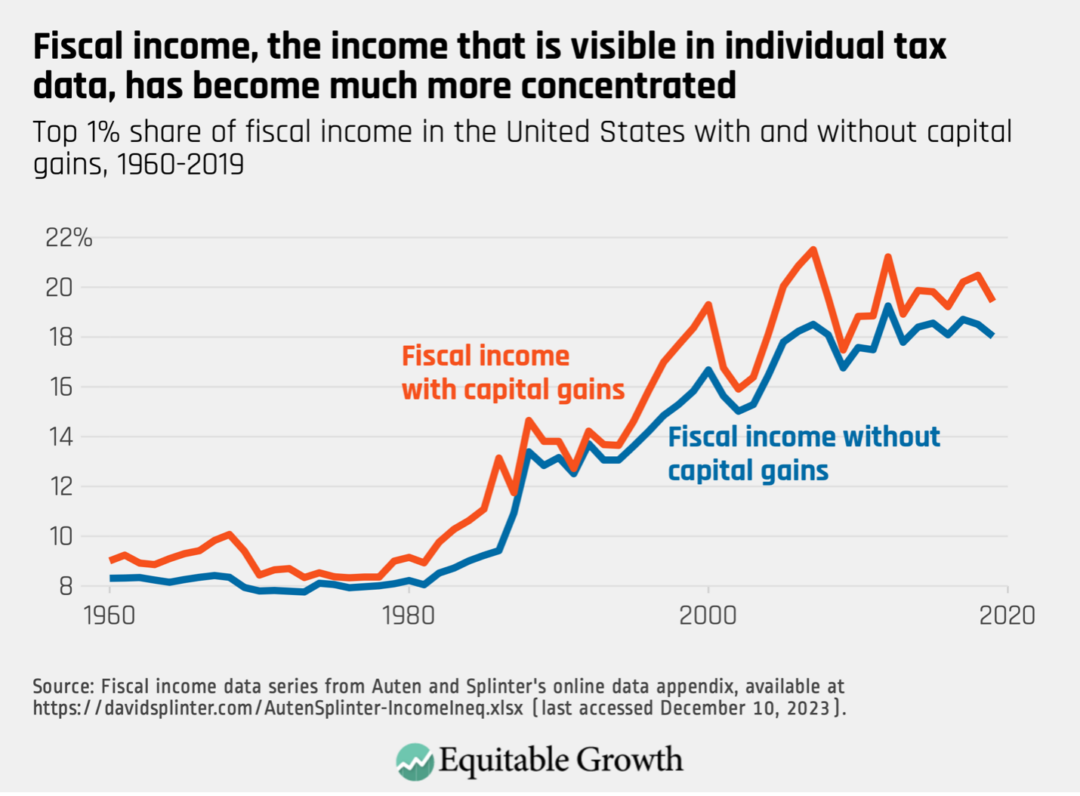
Both Auten and Splinter and Piketty, Saez, and Zucman are attempting to create distributions of National Income in their datasets. To do so, both teams start with income that we can see on individual tax returns. They refer to this as taxable income or fiscal income, and it includes most wage and business income, rental income, and some transfer income. There is no real contention about fiscal income, which everyone agrees has become much more concentrated over the past seven decades.
The concentration of fiscal income has increased, from 8.3 percent in 1960 to 18 percent in 2019. Although capital gains appear on personal tax returns, both teams remove it from income because capital gains are not part of National Income. Figure 2 shows the rise of the top 1 percent of income shares in fiscal income with and without capital gains.
Figure 2
Since fiscal income is observed on personal tax returns, disagreements between the two teams stem entirely from the share of National Income that is not included in fiscal income. That includes things such as nontaxable retirement income, underreported income, employer contributions to health insurance, and retained corporate earnings. Generally, Piketty, Saez, and Zucman argue these unseen components of income are distributed similarly to observable components, while Auten and Splinter argue that many of these components are distributed much more equally across U.S. households.
Both teams also provide both a pre-tax and after-tax distribution of National Income. We might prefer an after-tax distribution of income because it will reflect the redistribution of resources through the tax-and-transfer system, in which income in the United States becomes more equal due to government intervention. But creating an after-tax distribution of income adds considerable complexity to both teams’ work because both distributions must add up to National Income.
To illustrate why this adds complexity, imagine a nation with a National Income of 100. If you distribute that income to people in its economy, you get a pre-tax measure of how income is distributed. To create a post-tax measure, though, you must subtract income taxes, sales taxes, and other kinds of taxes from people’s income. Now, the incomes in this nation’s economy don’t add up to 100; they total 100 minus aggregate tax revenues.
Tax revenues are equal to government spending plus the government’s deficit or surplus, so if you want your post-tax measure of inequality to also sum to 100, you then must add in, and distribute among people, government spending and the federal surplus or deficit. Some of that is easy to distribute—for transfers such as Medicaid or SNAP benefits, one can just add to the income of program recipients. But government doesn’t only spend tax revenues on transfers. To get back to aggregate National Income, one also has to add in government spending on things such as national defense, and then distribute defense expenditures as income among the rich and the poor.
If this seems quite odd, don’t worry—the next section of this issue brief revisits it. For now, though, it is enough to understand that both teams are trying to fully distribute National Income, and this sets their measures of inequality apart from those of the Congressional Budget Office and others. Matching National Income requires distributing some slightly odd income components that most people probably don’t think of as income.
Now, with that in mind, we are ready to tackle the differences between the datasets developed by Auten and Splinter and by Piketty, Saez, and Zucman.
Examining the differences between Auten and Splinter and Piketty, Saez, and Zucman
In Auten and Splinter’s after-tax data series, the top 1 percent’s share of income is 6.6 percentage points lower in 2014, compared to the series developed by Piketty, Saez, and Zucman at the same time. In this section, I look at three of the largest contributors to this gap—underreported income, government consumption, and government surpluses or deficits—and discuss what they reveal about each team’s approach to this inequality measurement debate.
Table 4 of the Auten and Splinter article, reproduced below as Table 1, helpfully disaggregates the differences and shows how the differing assumptions made by each team contribute to the 6.6 percentage point gap. (See Table 1.
Table 1
Differences between the Auten-Splinter and Piketty-Saez-Zucman methodologies and the resulting impacts on the top 1 percent’s shares of income
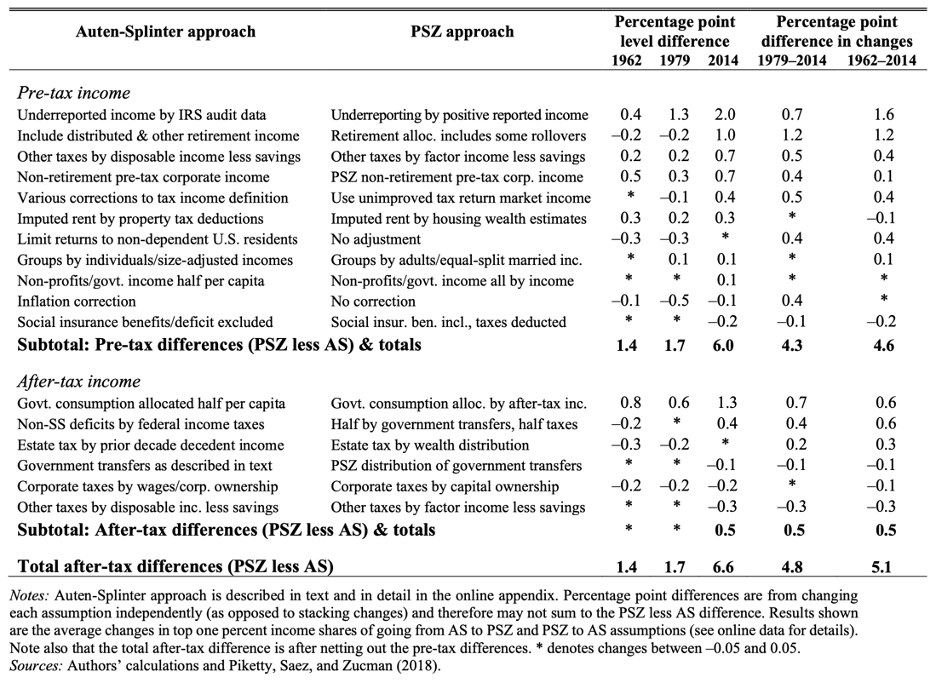
This table uses the original data series from the 2018 paper in the Quarterly Journal of Economics by Piketty, Saez, and Zucman, which the three co-authors have continued to tweak in response to new data releases and to the Auten-Splinter data series. Consequently, there are small differences between their original dataset, which Auten and Splinter use to compare to their own data, and the current Piketty-Saez-Zucman data series.
So, while Auten and Splinter report that Piketty, Saez, and Zucman find that the 2014 after-tax top 1 percent share of income is 15.7 percent, new versions of their dataset show 14.9 percent for that same data point. These differences are mostly modest but are worth noting to avoid confusion.
Recent revisions by Piketty, Saez and Zucman also address some of Auten and Splinter’s critiques. Line 2 of Table 1, for example, details an issue with rollovers in retirement income. Piketty, Saez, and Zucman acknowledged in 2020 that this issue impacted their estimates and modified their data accordingly, so this is no longer a major difference between the two teams, although Auten and Splinter claim that there is still some discrepancy here.
Putting the retirement income issue aside, in this section, I analyze the three lines from Table 1 that create the largest difference in income inequality trends, denoted in the final two columns of Table 1. First, I examine the biggest contributor to the pre-tax differences between the teams: how each team distributes underreported income (line 1 in Table 1). This is a relatively large component of income—around 3 percent of all National Income—allocated very differently. It is also the single largest contributor to the gap between their estimates of the top 1 percent’s share of income.
Next, I look at after-tax differences. I examine each of the first two lines of the after-tax income section in Table 1. The first is the distribution of government consumption. The second is the closely related distribution of government deficits and surpluses.
Underreported income
Underreported income is income that is either incorrectly reported to the IRS or that is not reported to the IRS at all, likely for the purpose of evading taxes. We don’t know exactly how much underreported income there is, since much of it is literally being hidden, but National Income includes an estimate of the amount of underreported income using IRS research audits.
In previous versions of the Auten-Splinter data series, underreported income explained nearly half of the total difference between their findings and the top 1 percent income shares identified by Piketty, Saez, and Zucman. It is less important in this most recent version of the Auten-Splinter data but remains the single largest difference between the two datasets, accounting for one-third of the total pre-tax difference of the top 1 percent’s income shares in 2014.
The debate over underreported income revolves around a couple of papers that look at how underreported income is distributed among taxpayers. Andrew Johns of the Internal Revenue Service and Joel Slemrod of the University of Michigan, as well as Jason DeBacker of the University of South Carolina and his co-authors, both use IRS audit data to try to determine how underreported income is distributed. Their results indicate that taxpayers who have high Adjusted Gross Incomes are often not the biggest tax evaders. High-income people who report their incomes accurately tend to make up the top 1 percent of the AGI distribution, but in the true AGI distribution, which is reported Adjusted Gross Income plus underreporting, around 27 percent of underreported income is earned by the top 1 percent.
These studies are based on the IRS’s National Research Program, which conducts audits of random taxpayers to inform the IRS about likely underreporting. Auten and Splinter claim that their data series better matches the NRP data. This is accurate, although after interactions with other adjustments they make, the top 1 percent by income in the Auten-Splinter data series only hold 16 percent of underreported income in 2019.
But fidelity to IRS research audits does not necessarily yield a more accurate distribution of underreported income. Indeed, Piketty, Saez, and Zucman argue that audits are not good at detecting sophisticated evasion techniques used by high-wealth individuals.
This is a commonly acknowledged possibility, but there have been significant gaps in our knowledge until relatively recently. Newer research on offshore income and income sheltered through complicated partnership arrangements, in fact, suggests that underreported income is more concentrated at the top than IRS audits suggest and that there is more underreported income than is generally assumed.
One 2016 study by the U.S. Department of the Treasury’s Michael Cooper and his co-authors, for example, finds that pass-through income is highly concentrated and difficult to trace, suggesting that complex ownership structures may be hiding a significant amount of high-income underreporting. Another study from 2019 looks at leaked customer lists from offshore financial institutions, as well as data from individuals who declared hidden assets as a response to tax amnesty policies, finding evidence that very-high-income households evade taxes far more than random IRS audits suggest. Yet another study, by the IRS’s John Guyton and his co-authors in 2021, supplements NRP audit data with data on operational audits and focused enforcement activities. They find that audits significantly understate the amount of evasion at the top of the income distribution.
Daniel Reck, Max Risch, and Gabriel Zucman, three of the 2021 study’s co-authors, have gone back and forth publicly with Auten and Splinter about these results. In their response to Auten and Splinter’s comment on their research, Reck, Risch, and Zucman use the Auten-Splinter data to graph the change in the top 1 percent’s share of income due to underreported income over time. They show a flip in how underreported income affects Auten and Splinter’s data series starting in the late 1980s and continuing through the early 1990s. Prior to that period, underreported income was increasing the top 1 percent’s income shares, but in more recent decades, it is significantly decreasing those shares. (See Figure 3.)
Figure 3
A closer look at how underreported income impacts the top 1 percent’s income shares
The Auten-Splinter data implies that the top 1 percent’s tax compliance has increased significantly since the 1980s in the United States
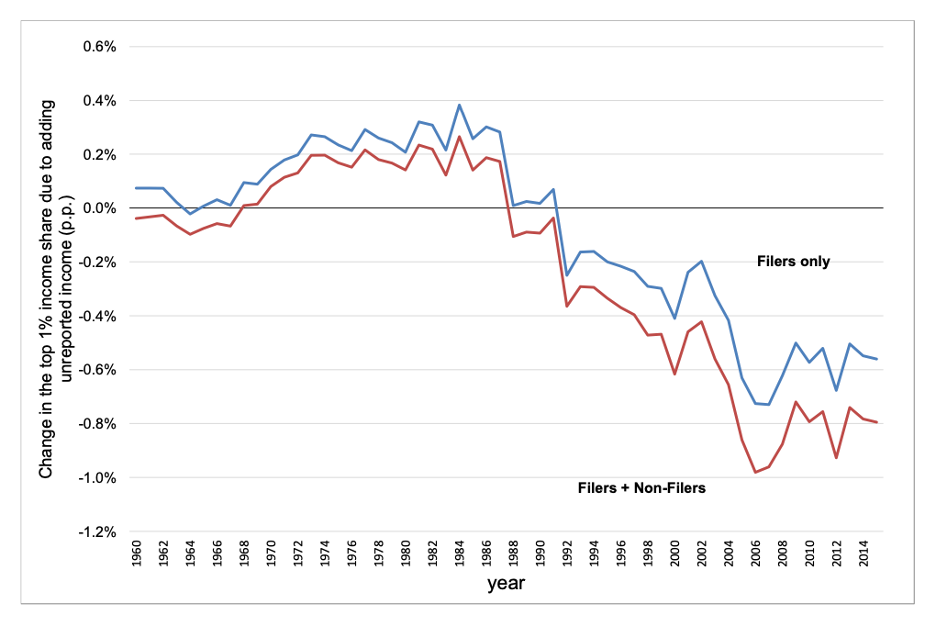
Reck, Risch, and Zucman point out that it is unclear why this flip happened and that, in view of their research and that of the Treasury Department’s Cooper and his co-authors, it might be reasonable to expect the exact opposite of what Auten and Splinter assume. Pass-through business income is more concentrated than traditional business income, and pass-throughs make tax evasion easier. The massive increase in pass-through organizations that occurred over the past 40 years implies more tax evasion at the top, not less as assumed by Auten and Splinter. This suggests that Auten and Splinter understate growth in top 1 percent’s income shares over time.
More research is needed here. Hidden income is difficult to study, and knowledge gaps remain about the exact amount and distribution of underreported income. But it seems likely that Auten and Splinter’s method of distributing underreported income is significantly understating the amount of underreported income earned by the top 1 percent of income earners.
Government consumption
As explained above, when both Auten and Splinter and Piketty, Saez, and Zucman move from pre- to post-tax measures of income, they subtract out all federal and local taxes. To make their post-tax income series add up to National Income, they must add all government spending back into their data series. Some of this is trivial. The two teams do not disagree about the distribution of Medicaid spending, for example, which they distribute to recipients. But after transfers are accounted for, other forms of government consumption remain.
Government consumption is composed of all the money spent by federal, state, and local governments to provide services. It includes spending on national defense, police forces, transportation infrastructure, public health, public education, and so on. The largest category of expenses is education, equal to about 13 percent of National Income. National defense spending by the federal government is the second-largest category.
There is no empirical guide as to how this money should be distributed. What is the in-kind value of the U.S. Airforce purchasing an F-22 aircraft for the average person? Do the rich and poor receive an equal value service from the government for that purchase?
One might simply assume that everyone benefits equally and add an identical lump sum to the income of every adult residing in the United States. That approach would greatly raise incomes at the bottom of the distribution because that lump sum would be relatively large, compared to their actual income. This approach also ignores the varying quality of government services; lower-income neighborhoods have both inferior infrastructure and worse educational outcomes.
Alternatively, you might argue that higher-income or higher-wealth people benefit more from certain kinds of spending and allocate the money proportional to income. This implies that high income earners, such as Amazon.com Inc. founder and executive chairman Jeff Bezos, benefit much more from transportation infrastructure, public education, and defense spending because, for instance, his income depends on a reliable and fast shipping network, a steady supply of skilled workers, defense contracts with his company, and protection from a wealth-destroying foreign invasion.
It’s important to remember that the rationale for distributing this money is simply that it must be distributed to match National Income—not because we generally consider it to be income for U.S. households. That consideration informs Piketty, Saez and Zucman’s method: They distribute government spending proportional to post-tax disposable income. This method is distributionally neutral—it neither increases nor decreases income inequality. So, while Piketty, Saez, and Zucman in effect take the view that higher-income people benefit more from government spending, their method also ensures that this spending doesn’t ultimately matter—it doesn’t change the level or trend of inequality.
By contrast, Auten and Splinter distribute half of government consumption in the same way as Piketty, Saez, and Zucman and the other half as a per capita lump sum to each person in the data. Auten and Splinter believe that the proportional method used by Piketty, Saez and Zucman ignores “the redistributive and public goods aspects of government consumption captured by our half per capita allocation.” The impact of this adjustment is to lower the top 1 percent’s income share by 0.8 percentage points in 1962 and by 1.3 percentage points in 2014, relative to Piketty, Saez, and Zucman’s data.
As detailed above, this money is in the form of in-kind services provided by the government, such as Kindergarten through 12th grade education. It might make sense to call this income, since people would otherwise have to spend money to buy educational services, for example. But let’s look under the hood at what this does to income shares.
In the Auten-Splinter data, 37 percent of U.S. government consumption in 2019 is assigned to the bottom 50 percent of individuals by income. The result is that 20 percent of all pre-tax plus transfers and government consumption income in this group is income in-kind from government consumption. In other words, one-fifth of the income for this group in the Auten-Splinter after-tax data comes in the form of tanks, roads, and chalkboards.
Even if one believes this should be considered income, distributing government consumption in this way is a very poor guide to economic well-being for these low-income individuals. It is widely accepted among economists that in-kind transfers are not necessarily valued at cost by their recipients. That is, if the government spends $3,000 providing healthcare to an individual, that individual doesn’t necessarily accrue the same economic well-being as if he or she instead received $3,000 in cash. In large part, this is because that individual has fewer choices and might prefer to spend that money in a different way. Indeed, recent research finds that the value of Medicaid to recipients is substantially lower than the gross cost of Medicaid to the federal government. The value of the in-kind service of national defense could be much lower still.
Government consumption, of course, is not the only in-kind income that goes into the bottom 50 percent’s income shares. Programs such as Medicare, Medicaid, and the Supplemental Nutrition Assistance Program are also in-kind. These sources of income have been growing in importance for low earners over time.
To get a better sense of the breakdown of the bottom 50 percent’s income, I add up government consumption, other noncash government transfers, and employer payments for health insurance—though not an in-kind transfer from the government, it is an in-kind service provided by employers—in the Auten-Splinter data for 2019. I find that 39 percent of pre-tax plus transfers and government consumption income for the bottom 50 percent is due to these in-kind sources. In other words, nearly two-fifths of all the income that Auten and Splinter assign to the bottom half of the distribution is not actually money they can spend to cover their needs. By contrast, these sources make up just 7 percent of the top 1 percent’s income.
Moreover, these sources of income have become much more important to the bottom 50 percent over time. In 1960, they accounted for just 23 percent of the bottom 50 percent’s income. For the top 1 percent, the proportion has not changed significantly. (See Figure 4.)
Figure 4
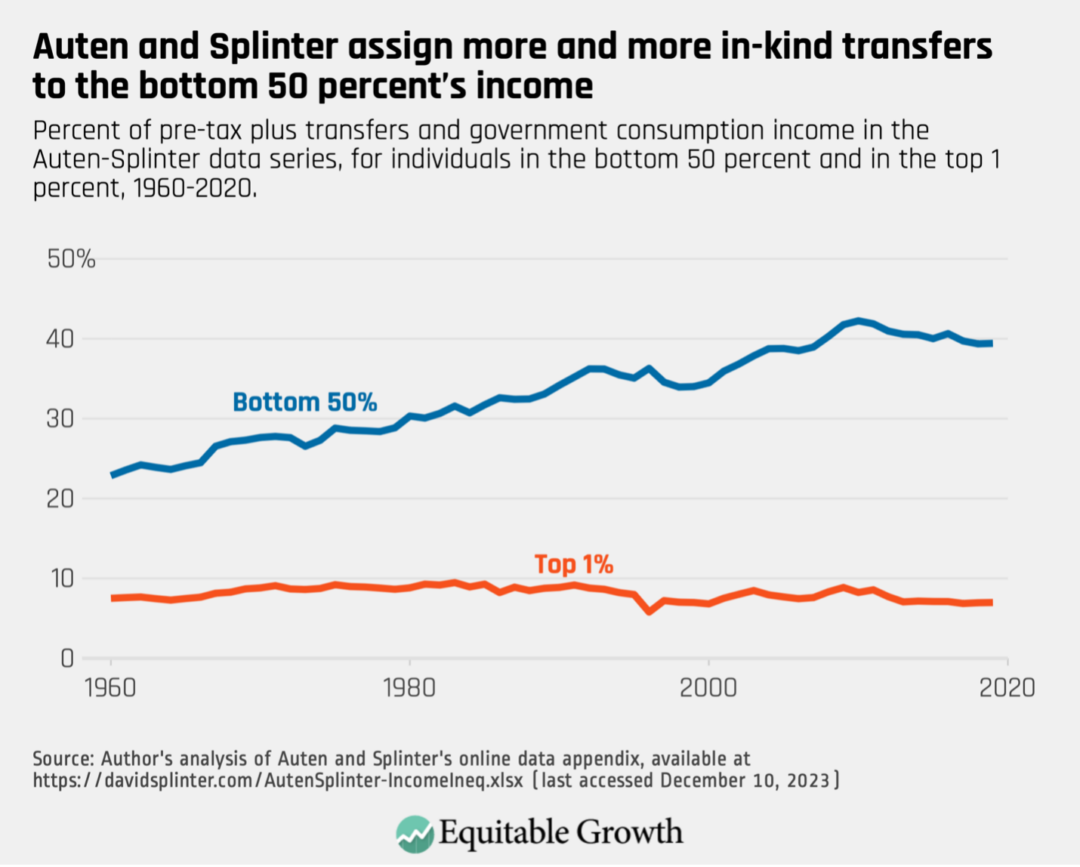
Because this shift is driven in part by the rise of in-kind transfers such as Medicaid, it is also present to some degree in the data from Piketty, Saez, and Zucman. But because Auten and Splinter attribute 37 percent of government consumption to the bottom 50 percent of income earners, they find much higher levels of the bottom 50 percent’s share of income—and consequently lower levels of the top 1 percent’s share—than Piketty, Saez, and Zucman do.
What are the consequences of this shift? One is that even if the bottom 50 percent’s incomes in the Auten-Splinter data keep up with growth in other parts of the distribution, the economic well-being of the bottom 50 percent is decreasing. Remember, these in-kind transfers do not provide the same level of economic well-being as a cash transfer. None of this “income” can be saved, invested, or spent freely.
By contrast, the method of distributing government consumption used by Piketty, Saez, and Zucman treats this spending as something of a nuisance. By distributing it proportionally to existing income, government consumption in their dataset has no impact on levels or trends in income inequality. Their inequality series would look essentially the same if this spending was discarded.
Government deficit or surplus
Government consumption is not equal to tax revenues collected, so in addition to distributing government consumption, both teams also must distribute the federal deficit or surplus (states generally run balanced budgets, so this is primarily a federal government phenomenon). As with government consumption, there is no clear answer for how this money should be distributed.
Initially, Piketty, Saez, and Zucman allocated the deficit half by the proportion of government transfers a person received and half by the proportion of federal taxes paid by that person. This is meant to reflect the possibility that a deficit will eventually be clawed back by either raising taxes or cutting transfer benefits. After the publication of their initial dataset, however, the three economists decided instead to follow the same methods they use for government consumption, allocating all the deficit based on post-tax disposable income, so it has no impact on income inequality trends or levels.
Auten and Splinter, by contrast, allocate this money according to the proportion of federal income taxes paid, based on the historical observation that deficits are more likely to result in tax increases than in benefit cuts. This has the effect of subtracting more income from high-income individuals because they pay a greater share of their income in taxes. This adjustment raises the top 1 percent’s share in 1962 by 0.2 percentage points and decreases the 2014 share by 0.4 percentage points. (Because Auten and Splinter compare their series to the original series by Piketty, Saez, and Zucman, these changes are from the comparison to their original half-by-transfers and half-by-taxes methods.)
Auten and Splinter’s argument about the history of tax-and-benefit changes for allocating the deficit may be appealing on the surface, but it will frequently fail: The large increase in the federal deficit during the COVID-19 pandemic in the current decade, for example, was caused largely by temporary benefit increases and one-time stimulus payouts that won’t recur. For pandemic spending at least, nearly all of the temporarily increased deficit will be paid for by benefit cuts, not tax increases.
Auten and Splinter have not yet released data past 2019, but when they do, the large federal deficit of 2020 and 2021 will show up as a significant reduction in the top 1 percent’s income. That is clearly inaccurate. The large reduction in the deficit that occurs in 2022 reflects not an increase in taxes that the top 1 percent had to pay, but rather a decrease in benefits that lower-income individuals had to bear.
Moreover, Auten and Splinter’s method can provide a misleading snapshot of the income distribution in any given year. The tax cuts imposed under the Tax Cuts and Jobs Act of 2017, for example, expire in 2025. Right now, the deficits those tax cuts create are reducing top income shares. If or when they expire in 2025, the deficit will decrease, and top income shares will increase, effectively smoothing top incomes over the active window of the bill. But the reduction in top income shares now is effectively a claim against future income—it doesn’t reflect an actual decrease in top shares right now.
As with government consumption, it makes far more sense to take the approach used by Piketty, Saez, and Zucman, which allocates the deficit in a distributionally neutral way. It is simply not true that 100 percent of deficits will eventually fall on taxpayers rather than benefit recipients, and we have no empirical basis for any other split between these groups.
Conclusion
Creating distributions of income that are consistent with the national accounts is a difficult and complex endeavor. In many cases, economists simply do not have the necessary data to adjudicate different distributional assumptions.
It can also be difficult to understand the implications of different assumptions made by these two teams using data sources that very few can access. Trying to adjudicate each of the 17 differences between Auten and Splinter and Piketty, Saez, and Zucman listed in Table 1 simply isn’t feasible for most analysts. I am not sure, for example, whether Auten and Splinter’s “various corrections to tax income definition” are reasonable.
On balance, however, it doesn’t appear that Auten and Splinter have overturned the consensus view on rising income inequality in the United States. The discussion above provides a number of reasons to prefer the distribution of income by Piketty, Saez, and Zucman and further points out that the Auten and Splinter distribution itself does not paint an optimistic picture of incomes for those outside the top 1 percent. Specifically:
- Auten and Splinter’s results run counter to the signals from the distribution of U.S. wealth, which has become significantly more concentrated at the top.
- The largest discrepancy between the Auten and Splinter data and the Piketty, Saez, and Zucman data is in the distribution of underreported income. The Piketty, Saez, and Zucman method better reflects recent research into tax evasion.
- The methods Auten and Splinter use to distribute government consumption and deficits in their after-tax series significantly inflates the bottom 50 percent of incomes and reduces the top 1 percent of incomes, but their methods are not guided by empirics and make assumptions that can fail in certain situations.
- The growth of so-called in-kind transfers for the bottom 50 percent of the income distribution—transfers that provide a service rather than cash income—is eroding the economic well-being of that group, independent of changes in their income share.
Piketty, Saez, and Zucman continue to update their data and methods, as they have done since the original publication of their article and data series. New data will help both teams hone their estimates and provide more accurate distributions of nontaxable income. As such, future data may show that the trend in U.S. income inequality is smaller—or larger—than is the case today. But I suspect that the consensus story of sharply rising income inequality in the United States over the past four decades will remain accurate.
Doubling down on cuts to the IRS is bad for the federal budget and for tax fairness in the United States

The U.S. Congress recently announced a bipartisan budget deal for fiscal year 2024 appropriations for the U.S. federal government. The budget is largely consistent with the framework agreed to in the spring of 2023, but with one major—and unfortunate—exception: an accelerated $10 billion cut to the IRS’s tax enforcement budget.
This proposed cut comes despite rigorous academic evidence that proves that tax enforcement—and particularly the high-income audits that these funds would be used for—is highly cost effective and generates significant returns to the government. Indeed, a recent, cutting-edge study by William C. Boning from the U.S. Treasury Department, Nathaniel Hendren and Ben Sprung-Keyser from Harvard University, and Ellen Stuart from the University of Sydney finds that an additional $1 spent auditing taxpayers with incomes above the 90th percentile yields more than $12 in federal revenue, making it an incredibly efficient way to raise money.
The co-authors find that this additional revenue comes from two channels. First is the direct effect of identifying and correcting for underpayment in the auditing process—that is, the funds retrieved from auditing taxpayers who did not properly report their incomes and collecting additional revenue as a result. Second, the authors find additional revenue from an indirect, individual deterrent effect that comes from audited individuals being more likely to fully comply with tax rules in the years after an audit. In other words, following an IRS audit, taxpayers tend to correctly report their incomes and pay what they owe.
The study does not attempt to quantify the potential general deterrent effect in which higher audit rates dissuade nonaudited taxpayers to more closely comply with the law. But if this were found to be the case, then that would only increase the financial return that comes from investment in the IRS.
Auditing high-income taxpayers is more complicated and expensive for the IRS than auditing lower-income taxpayers, who tend to have simpler returns. This paper, however, proves that the returns to auditing high-income taxpayers more than makes up for those additional costs. Indeed, the authors find that audits of below-median-income taxpayers delivers just $5 for every $1 spent—less than half of the returns for auditing high-income taxpayers. (See Figure 1.)
Figure 1
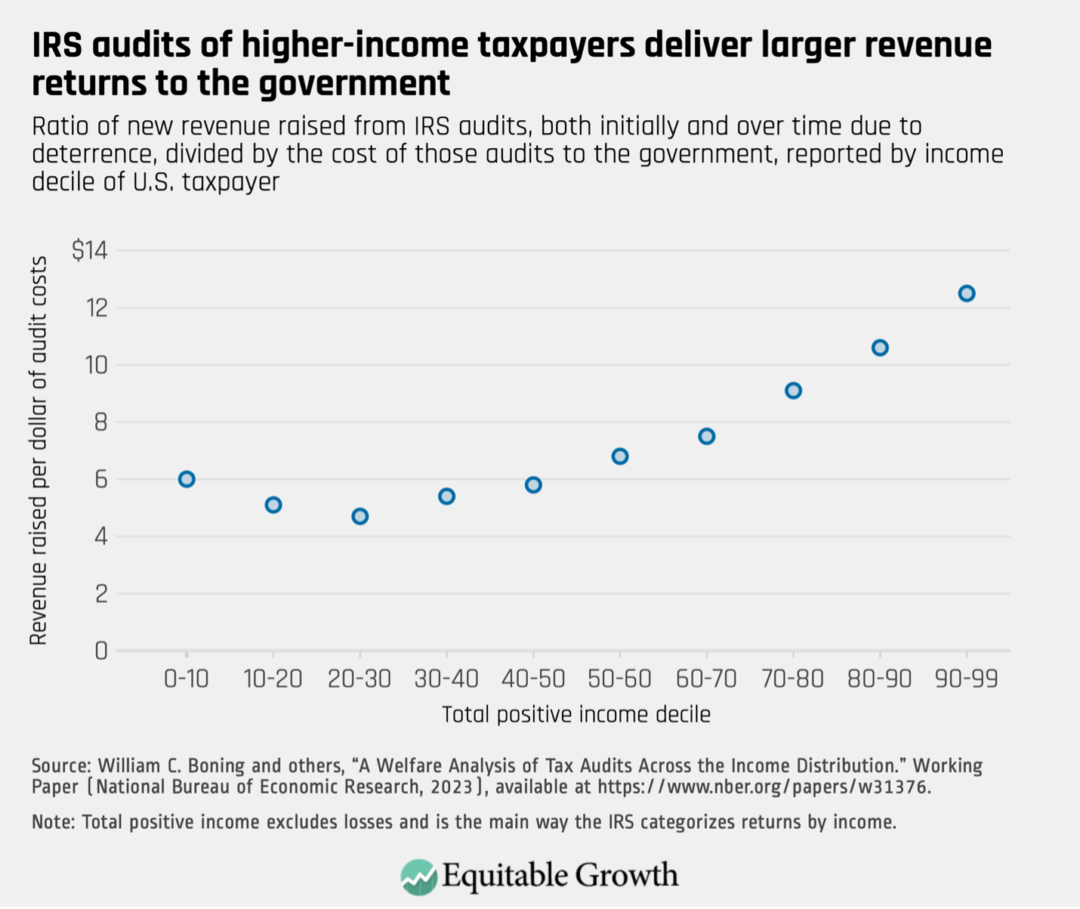
The study also looks at audits of taxpayers in the top 1 percent of earners. Though the small sample size for that narrow income band limits the precision of their estimates, the authors find even larger returns on investment for this group: $18.20 in revenue for every $1 spent on auditing those between the 99th percentile and the 99.9th percentile— and a whopping 36-to-1 return for those in the top 0.1 percent.
This analysis from Boning and his co-authors builds on previous Equitable Growth-funded research from John Guyton and Patrick Langetieg from the Internal Revenue Service, Daniel Reck of the University of Maryland, Max Risch from Carnegie Mellon University, and Gabriel Zucman of the University of California, Berkeley. That paper finds that random IRS audits underestimate tax evasion at the top of the income distribution in the United States because of the wealthy’s use of sophisticated tax evasion tactics. Guyton and his co-authors estimate that if the IRS had more resources to uncover this abuse, it could raise an additional $175 billion annually.
This is one reason why the U.S. Treasury Department had plans to use additional IRS funding secured in the Inflation Reduction Act—the funds that the new proposed budget now partially rescinds—to “restore fairness in tax compliance by shifting more attention onto high-income earners, partnerships, large corporations and promoters abusing the nation’s tax laws.”
While both of the above studies are unique in their ability to dive into the distributional effect of audits, there has long been strong, widespread evidence that cutting the IRS budget is penny-wise and pound-foolish—something even the official government scorekeepers acknowledge. In fact, the research strongly suggests that fully funding the IRS will likely generate even more revenue than official government estimates.
This year’s budget negotiation led to an accelerated cut, moving forward a $10 billion rescission that was already scheduled to go into effect in fiscal year 2025. Yet those who have made IRS cuts a hallmark of their economic policy platform are all but certain to call for additional cuts to fill the gap they have now created in the 2025 budget.
As the evidence above makes clear, further IRS cuts would undermine the government’s ability to restore fairness to our nation’s tax administration system and efficiently raise revenue. Congressional leaders—especially those who profess to care about the national debt—ignore this evidence at the country’s peril.
ASSA 2024 Round-up: Day 3

Yesterday was the third and final day of the 2024 annual meeting of the Allied Social Science Associations, which is organized by the American Economic Association. The 3-day conference, held in person in San Antonio, Texas, this year, features hundreds of sessions covering a wide variety of economics and other social science research. This year, Equitable Growth’s grantee network, Steering Committee, and Research Advisory Board and their research were well-represented throughout the program, featured in almost 60 different sessions of the conference.
Below are lightly edited abstracts from some of the papers and presentations that caught the attention of Equitable Growth staff during the third day of this year’s conference and which relate to the research interests laid out in our current Request for Proposals for early career scholars. We also include links to the sessions in which the papers were presented.
Click here to review the highlights from day one, and here for highlights from day two.
“Minimum Wage Effects and Monopsony Explanations”
Justin Wiltshire, University of Victoria, Equitable Growth grantee; Carl McPherson, University of California, Berkeley; Michael Reich, University of California, Berkeley, Equitable Growth grantee
Abstract: We present the first causal analysis of recent large minimum wage increases, focusing on 36 large U.S. counties that reached $15 or more by 2022q1. Using novel stacked county-level synthetic control estimators, we find substantial pay growth and no disemployment effects. These results hold even if we look at only lower-wage counties or counties that did not choose to pass local minimum wage legislation. We go on to document the presence of monopsony in the restaurant industry. We show that minimum wages reduce restaurant workers’ separation rates, and that they caused McDonald’s workers’ wages to grow faster than the prices of Big Macs, suggesting the presence of monopsony power and positive economic profits. Lastly, we discuss how the COVID-19 pandemic and its aftereffects can confound estimates of the impacts of these high minimum wages and propose a way to ameliorate this issue.
Note: This research was funded in part by Equitable Growth.
Juan Carlos Suarez Serrato, Stanford University, Equitable Growth grantee; Owen Zidar, Princeton University, NBER, Equitable Growth grantee
Abstract: This paper estimates the incidence of state corporate taxes using new data and methods for estimating the effects on profits. We extend Suarez Serrato and Zidar (2016) by developing two new identification approaches that use the effects of business taxes on the labor demand of incumbent firms and local productivity to identify profit effects. We estimate these reduced-form effects using data from the Census, show how reduced-form moments identify incidence and parameters, and provide incidence estimates using a variety of reduced-form approaches, as well as a structural model. Across these approaches, we find that owners bear a substantial portion of incidence. Our central estimate is that firm owners bear half of the incidence, while workers and landowners bear 35 percent to 40 percent and 10 percent to 15 percent, respectively.
“A Tale of Two Networks: Common Ownership and Product Market Rivalry ”
Florian Ederer, Yale University, Equitable Growth grantee; Bruno Pellegrino, Columbia University, Equitable Growth grantee
Abstract: We study the welfare implications of the rise of common ownership in the United States from 1995 to 2021. We build a general equilibrium model with a hedonic demand system in which firms compete in a network game of oligopoly. Firms are connected through two large networks: the first reflects ownership overlap, the second product market rivalry. In our model, common ownership of competing firms induces unilateral incentives to soften competition and the magnitude of the common ownership effect depends on how much the two networks overlap. We estimate our model for the universe of U.S. public corporations using a combination of firm financials, investor holdings, and text-based product similarity data. We perform counterfactual calculations to evaluate how the efficiency and the distributional impact of common ownership have evolved over time. According to our estimates, the welfare cost of common ownership, measured as the ratio of deadweight loss to total surplus, has increased about ninefold between 1995 and 2021. Under various corporate governance models, the deadweight loss of common ownership ranges between 3.5 percent and 13.2 percent of total surplus in 2021. The rise of common ownership has also resulted in a significant reallocation of surplus from consumers to producers.
Note: This research was funded in part by Equitable Growth.
Ryan Perry, Federal Reserve Bank of Chicago; Kristen Broady, Federal Reserve Bank of Chicago; Darlene Booth-Bell, Coastal Carolina University
Abstract: The COVID-19 pandemic has accelerated trends in automation as many employers seek to save on labor costs amid widespread illness, increased worker leverage, and market pressures to onshore supply chains. While existing research has explored how automation may displace nonspecialized jobs, there is typically less attention paid to how this displacement may interact with preexisting structural issues around gender and racial inequality. This analysis updates that of a 2021 Brookings paper by the authors, finding that Black and Hispanic workers continue to be overrepresented in the 30 occupations with the highest estimated risk of automation and underrepresented in the 30 occupations with the lowest estimated risk of automation. The updated analysis also includes new attention to automation’s impact on women workers, wage structures, a consideration of the broader implications of automation for global economics, and a discussion of the potential interplay of automation with recent developments in artificial intelligence.
“Racial Protests and Credit Access”
Alberto Ortega, Indiana University; Raffi García, Rensselaer Polytechnic Institute
Abstract: Do racial protests help or hurt access to credit for small businesses? This paper examines the effect of local racial demonstrations, such as Black Lives Matter protests, and the subsequent racial justice movement following the death of George Floyd on racial disparities in the Paycheck Protection Program loan disbursements. Using difference-in-differences, we find that local racial protests improve credit access for Black business owners. We find that social media and public attention after the death of George Floyd amplified the broader Black Lives Matter mission statement of racial equity, resulting in a positive moderating effect on loan amounts distributed to Black owners relative to other racial-ethnic groups. Our findings show that racial implicit and explicit bias diminishes after George Floyd’s death with stronger effects in finance occupations.
“The Role of State Policy in Reducing Disparities in Unemployment Insurance Recipiency”
Eliza Forsythe, University of Illinois-Urbana-Champaign, Equitable Growth grantee
Abstract: Many unemployed individuals are unaware they may be eligible for Unemployment Insurance, leading to low take-up among eligible individuals. To address this, some states have adopted policies by which employers must notify separating workers about UI eligibility. Using variation across states and the precise timing of policy adoption, I estimate the impact of separation notice requirements on UI recipiency, and investigate whether such policies may play a role in narrowing UI recipiency gaps across racial and ethnic groups.
Note: This research was funded in part by Equitable Growth.
“Merger Guidelines for the Labor Market”
David Berger, Duke University, Equitable Growth grantee; Kyle Herkenhoff, University of Minnesota, Equitable Growth grantee; Simon Mongey, Federal Reserve Bank of Minneapolis, Equitable Growth grantee; Eric A. Posner, University of Chicago
Abstract: While the labor market implications of mergers have been historically ignored as “out of market” effects, recent actions by the U.S. Department of Justice place buyer market power (i.e., monopsony) at the forefront of antitrust policy. We develop a theory of multiplant ownership and monopsony to help guide this new policy focus. We estimate the model using U.S. Census data and demonstrate the model’s ability to replicate empirically documented paths of employment and wages following mergers. We then simulate a representative set of U.S. mergers in order to evaluate merger review thresholds. Our main exercise applies the Department of Justice and Federal Trade Commission’s product market concentration thresholds to local labor markets. Assuming mergers generate efficiency gains of 5 percent, our simulations suggest that workers are harmed, on average, under the enforcement of the more lenient 2010 merger guidelines and unharmed, on average, under enforcement of the more stringent 1982 merger guidelines. We also provide a framework for further research evaluating alternative concentration thresholds based on assumptions about the efficiency effects of mergers and the resource constraints of regulators. Finally, we provide guidance for using the Gross Downward Wage Pressure method for evaluating the impact of mergers on labor markets.
Note: This research was funded in part by Equitable Growth.
“Gender, Race, and Denied Claims for Unemployment Insurance: The Role of the Employer”
Stephen Woodbury, Michigan State University, Equitable Growth grantee; Marta Lachowska, W.E. Upjohn Institute for Employment Research, Equitable Growth grantee
Abstract: Are female, Black, Hispanic, Asian American, and American Indian claimants for Unemployment Insurance more likely than White non-Hispanic claimants to see their claims disputed by an employer? And are these UI claimants ultimately more likely to have their UI claims denied, either by the UI agency or following a dispute? We address these questions by examining UI administrative wage and claim records from Washington state during 2005:Q1–2013:Q4. Overall, female claimants in the sample were statistically significantly more likely than males to have their claims disputed or denied; however, once we control for differences in observable characteristics of females’ claims, we find they were less likely to be disputed or denied than males’ claims in the sample. In particular, the findings suggest that females and males sort to employers with different propensities to dispute claims. Differences in denials and disputes by race/ethnicity are more difficult to characterize because they are divergent. Hispanic claimants were less likely than White non-Hispanics to have their claims disputed or denied; however, after accounting for observable characteristics of those claims, the differences were not statistically significant. Black, Asian American, and American Indian claimants were more likely than White non-Hispanics to have their claims disputed or denied, in some cases after controlling for observables.
“UI Benefit Generosity and Labor Supply from 2002-2020: Evidence from California UI Records”
Alex Bell, University of California, Los Angeles, Equitable Growth grantee; TJ Hedin, University of California, Los Angeles; Geoffrey Schnorr, University of California, Los Angeles, Equitable Growth grantee; Till von Wachter, University of California, Los Angeles, Equitable Growth grantee
Abstract: This paper provides estimates of the effect of Unemployment Insurance benefits on labor supply outcomes over the business cycle using 20 years of administrative claims, earnings, and employer data from California. A regression kink design exploiting nonlinear benefit schedules provides experimental estimates of behavioral labor supply responses throughout the unemployment spell that are comparable over time. For a given unemployment duration, the behavioral effect of UI benefit levels on labor supply is unchanged over the business cycle from 2002 to 2019. However, due to increased coverage from extensions in benefit durations, the duration elasticity of UI benefits rises during recessions. The behavioral effect during the start of the COVID-19 pandemic is substantially lower at all weeks of the unemployment spell.
“The Effect of Unemployment Insurance for Self-Employed and Marginally-Attached Workers”
Andy Garin, Carnegie Mellon University, Equitable Growth grantee; Dmitri K. Koustas, University of Chicago; Emilie Jackson, Michigan State University
Abstract: We study the temporary extension of Unemployment Insurance benefits to groups of workers typically excluded from the UI system—including gig workers, the self-employed more broadly, and labor market entrants with limited work experience—implemented as part of the United States policy response to the 2020 COVID-19 crisis. We document that, although enacted at the federal level, the state-level implementation resulted in large differences in the roll-out of benefits across jurisdictions in practice. We exploit this cross-state variation to estimate the causal impacts of these UI expansions on the labor supply, education choices, and mortality of affected groups using a spatial regression discontinuity design. We find that every additional dollar in UI payments received by self-employed workers led to a 28 cent reduction in their earnings, and find bigger reductions among platform-based gig workers of 48 cents. Our preferred explanation is that responses were larger among these gig workers because delivery remained a viable work option even as many other sectors were largely shut down by the pandemic. We find that the reduction in work done by older gig workers led to reductions in their mortality during the pandemic that can be plausibly linked to reduced exposure to COVID-19 through work—but find no effect among the self-employed more broadly.
ASSA 2024 Round-up: Day 2

Yesterday was the second day of the 2024 annual meeting of the Allied Social Science Associations, which is organized by the American Economic Association. The 3-day conference, held in person in San Antonio, Texas, this year, features hundreds of sessions covering a wide variety of economics and other social science research. This year, Equitable Growth’s grantee network, Steering Committee, and Research Advisory Board and their research are well-represented throughout the program, featured in almost 60 different sessions of the conference.
Below are lightly edited abstracts from some of the papers and presentations that caught the attention of Equitable Growth staff during the second day of this year’s conference and which relate to the research interests laid out in our current Request for Proposals for early career scholars. We also include links to the sessions in which the papers were presented.
Come back tomorrow morning for more highlights from day three, and click here to review the highlights from day one.
“The Welfare Economics of a Data Driven Social Cost of Carbon”
Ishan Nath, Federal Reserve Bank of San Francisco; Michael Greenstone, University of Chicago; Solomon Hsiang, University of California, Berkeley
Abstract: This paper presents the first estimates of the social cost of a marginal ton of carbon dioxide emissions that combine theoretical insights on the welfare economics of climate change with a rich set of empirically grounded, probabilistic projections of future climate damages across five impact categories: human mortality, agricultural productivity, energy consumption, labor disutility, and coastal flooding. We find that accounting for the full welfare effects of uncertain and unequal climate damages raises the social cost of carbon substantially, relative to previous prevailing estimates based on deterministic projections and a global representative agent. The risk premium to avoid uncertainty in damages and realized global temperature change raises the social cost of carbon by more than 50 percent in low emissions scenarios, and by up to an order of magnitude or more in high emission scenarios, depending on a choice parameter that governs the valuation of a small proportion of extreme temperature draws that imply catastrophic losses. In high emission scenarios, the discount rate implied by standard intertemporal optimization can be close to zero as the possibility of severe damages reduces future welfare relative to present welfare. Finally, applying a welfare metric that accounts for differential marginal utility of damages incurred by poorer individuals can raise the social cost of carbon by up to an order of magnitude, as projected damages are heavily concentrated in poorer regions of the world.
“Not Just for Kids: Child and Dependent Care Credit Benefits for Adult Care”
Gabrielle Pepin, W.E. Upjohn Institute for Employment Research; Yulya Truskinovsky, Wayne State University
Abstract: We estimate effects of Economic Impact Payments and advance Child Tax Credit benefits on child care use and quality using mobile device location data linked to state child care licensing records. As low- and moderate-income households were eligible for larger Economic Impact Payments and advance CTC benefits, we estimate difference-in-differences models, comparing trends in child care visits from individuals living in census tracts with different pre-pandemic median income levels. Preliminary results using data from Virginia suggest that Economic Impact Payments and advance CTC benefits increased average child care visits per capita in low- and middle-income census tracts by 14 percent and increased the state-administered quality ratings associated with such visits by 7 percent on average.
Note: This research was funded in part by Equitable Growth.
“The Labor Market Impact of Shareholder Power: Worker-Level Evidence”
Antonio Falato, Federal Reserve Board; Daniel Gallego, Federal Reserve Bank of Chicago; Hyunseob Kim, Federal Reserve Bank of Chicago; Till von Wachter, University of California, Los Angeles, Equitable Growth grantee
Abstract: Using worker-level data from the U.S. Census Bureau’s LEHD program from 1993 through 2015, we show that shareholder power leads to large earnings losses for employees. We track the earnings of employees up to 5 years after their firms experience a material increase in concentrated ownership by block institutional shareholders, relative to employees of other firms that experience a similarly sized increase in ownership by diffused institutional shareholders. We find that over the next 6 years, the cumulative earnings of the affected employees decline by 10 percent of their pre-event annual earnings on average. Workers with “high skills” (such as those with earnings in the top tercile) and top managers (such as chief executives) bear the brunt of the negative impact, with the cumulative earnings declining by 16 percent and 63 percent, respectively. In contrast, shareholder power does not affect the earnings of employees with relatively low pay. There is also a negative impact on hiring but no impact on employee departures nor differential earnings losses conditional on departure, suggesting that separation is not the main channel underlying the earnings losses. The collection of evidence is consistent with concentrated ownership increasing shareholders’ bargaining power, which in turn reduces employees’ rents.
“U.S. Educational Mobility in the Twentieth Century”
Martha Bailey, University of California, Los Angeles, NBER, Equitable Growth grantee; A.R. Shariq Mohammed, Northeastern University, Equitable Growth grantee; Paul Mohnen, Federal Reserve Bank of Atlanta, Equitable Growth grantee
Abstract: This paper describes the geography of intergenerational educational mobility for both men and women born in the 20th century and its local correlates. We use supervised machine-learning to link 1.7 million men and women in the Social Security Application Records to the full-count 1940 census, while keeping Type I linking error rates very low, and reweight the linked sample to resemble the national population. We find that the geography of educational mobility was broadly similar to the geography of income mobility, with the highest rates of mobility in the Northeast and the West of the country and the lowest rates of mobility in the South. Counties with high rates of mobility had (i) lower income inequality, (ii) higher community-level literacy rates, (iii) higher levels of economic development, and (iv) greater public goods provision. The geography and the correlates of educational mobility were similar for men and women.
Note: This research was funded in part by Equitable Growth.
“Automation and the Rise of Superstar Firms”
Hamid Firooz, University of Rochester; Zheng Liu, Federal Reserve Bank of San Francisco; Yajie Wang, University of Rochester
Abstract: We document evidence that the rise in automation technology contributed to the rise of superstar firms in the past two decades. We explain the empirical link between automation and industry concentration in a general equilibrium framework with heterogeneous firms and variable mark-ups. A firm can operate a labor-only technology or, by paying a per-period fixed cost, an automation technology that uses both workers and robots as inputs. Given the fixed cost, more productive, larger firms are more likely to automate. Increased automation boosts labor productivity, enabling large, robot-using firms to expand further, which raises industry concentration. Our calibrated model does well in matching the highly skewed automation usage toward a few superstar firms observed in the Census data. Since robots substitute for labor, increased automation raises sales concentration more than employment concentration, also consistent with empirical evidence. A modest subsidy for automating firms improves welfare since productivity gains outweigh increased mark-up distortions.
“Equitably Targeting Climate Adaptation”
Derek Lemoine, University of Arizona, Equitable Growth grantee; Antonia Marcheva, Cornell University; Ivan Rudik, Cornell University, Equitable Growth grantee; Weiliang Tan, Cornell University
Abstract: We develop a framework for equitably targeting climate adaptation funding around the world. We use our new framework to answer three questions about equity and climate adaptation. First, how do different preferences about inequality over the distribution of global climate impacts affect how we should be directing adaptation investments around the world? Second, does there exist an equity-efficiency trade-off in where we direct climate adaptation, and if so, how severe is it? Third, how important is capturing spatial trade linkages that allow for adaptation investments in one region to be transmitted and provide benefits in another?
To answer these questions, we develop a theoretical framework where a planner aims to minimize inequality around the world subject to achieving a minimum level of aggregate welfare gains from adaptation. We provide theoretical results that show equality motives drive adaptation to be targeted toward regions that bear a greater share of global damage, or whose adaptation benefits tend to be transmitted to regions that bear a greater share of global damage. The most averse to inequality we are, the most concentrated adaptation becomes in a small handful of the most-harmed regions.
We quantify our model using global data on trade and production to compute equity-efficiency frontiers for climate adaptation. We find that there is an equity-efficiency trade-off. Adaptation budgets that can mitigate 20 percent of global damages exhibit almost perfect substitutability between increasing equality and reducing aggregate damages. However, almost the entire frontier leads to reductions in equality and improvements in aggregate welfare.
Last, we find that transmission of adaptation benefits is important. On average, a fifth of the benefits of global adaptation come from benefits spilling over through global trade. Adaptation funding should not necessarily be targeted solely on a region’s own climate exposure but also how its exposure harms other regions.
Note: This research was funded in part by Equitable Growth.
“Non-Disclosure Agreements and Externalities from Silence”
Jason Sockin, University of Pennsylvania; Evan Starr, University of Maryland; Aaron Sojourner, W.E. Upjohn Institute for Employment Research, Equitable Growth grantee
Abstract: Do non-disclosure agreements, or NDAs, distort labor markets? We address this question by leveraging new data on NDA use and state laws that prohibited employers from using NDAs to conceal unlawful workplace conduct. We find that this narrowing of NDAs increased worker’s willingness to share negative information, both in online reviews of employers and in sexual harassment complaints to the Equal Employment Opportunity Commission. In turn, employers’ average online ratings fell, dispersion in ratings across employers rose, and employee turnover slowed. Our results highlight how employers can use broad NDAs to silence workers and inflate their reputations, but doing so imposes negative externalities both on job-seekers who value such information and on competing employers who are less able to stand out.
“Induced Innovation, Inventors, and the Energy Transition”
Todd Gerarden, Cornell University; Eugenie Dugoua, London School of Economics
Abstract: We study how individual inventors respond to incentives to work on “clean” electricity technologies. Using natural gas price variation, we estimate output and entry elasticities of inventors and measure the medium-term impacts of a price increase mirroring the social cost of carbon. We find that the induced clean innovation response primarily comes from existing clean inventors. New inventors are less responsive on the margin than their average contribution to clean energy patenting would indicate. Our findings suggest a role for policy to increase the supply of clean inventors to help mitigate climate change.
Costas Arkolakis, Yale University; Conor Walsh, Columbia University, Equitable Growth grantee
Abstract: We provide a spatial theory of clean growth to assess the global impact of the rise of renewable energy. We model the details of the combined production and transmission network of electricity (“the grid”) that determine the supply and losses of energy in space. The local rate of clean energy adoption depends on learning-by-doing, the global electricity and trade network, and regional comparative advantage in renewable resources. To quantify the contribution of renewable adoption to global growth, we collect and harmonize global data on transmission lines, power stations, trade, and regional output. We use the model to measure the aggregate and spatial implications of clean growth, as well as the role of the Inflation Reduction Act in affecting the transition.
“An Equilibrium Model of the Impact of Increased Public Investment in Early Childhood Education”
Jessica H. Brown, University of South Carolina; Chloe Gibbs, University of Notre Dame; Chris M. Herbst, Arizona State University; Aaron Sojourner, W.E. Upjohn Institute for Employment Research, Equitable Growth grantee; Erdal Tekin, American University; Matthew Wiswall, University of Wisconsin-Madison
Abstract: Recent policy proposals call for significant new investments in early care and education. These policies are designed to reduce the burden of child care costs, support parental employment, and foster child development by increasing access to high-quality care, especially for children in lower-income families. In this paper, we propose and calibrate a model of supply and demand for different early care and education service and teacher types to estimate equilibrium family expenditures, participation in early care and education, maternal labor supply, teacher wages, market early care and education prices, and program costs under different policy regimes. Under a policy of broadly expanded subsidies that limits family payments for early care and education to no more than 7 percent of income among those up to 250 percent of national median income, we estimate that mothers’ employment would increase by 6 percentage points while full-time employment would increase by nearly 10 percentage points, with substantially larger increases among lower-income families. The policy would also induce a shift from informal care and parent-only care to center- and home-based providers, which are higher-quality on average, with larger shifts for lower-income families. Despite the increased use of formal care, family expenditures on early care and education services would decrease throughout most of the income distribution. For example, families in the bottom three income quintiles would experience expenditure reductions of 76 percent, 68 percent, and 55 percent, respectively. Finally, teacher wages and market prices would increase to attract workers with higher levels of education. We also estimate the impact of a narrower subsidy expansion for families with an income up to 85 percent of national median income.
ASSA 2024 Round-up: Day 1

Yesterday was the first day of the 2024 annual meeting of the Allied Social Science Associations, which is organized by the American Economic Association. The 3-day conference, held in person in San Antonio, Texas, this year, features hundreds of sessions covering a wide variety of economics and other social science research. This year, Equitable Growth’s grantee network, Steering Committee, and Research Advisory Board and their research are well-represented throughout the program, featured in almost 60 different sessions of the conference.
Below are lightly edited abstracts from some of the papers and presentations that caught the attention of Equitable Growth staff during the first day of this year’s conference and which relate to the research interests laid out in our current Request for Proposals for early career scholars. We also include links to the sessions in which the papers were presented.
Come back tomorrow morning for more highlights from day two, and Monday morning for highlights from day three.
“The Class Gap in Career Progression: Evidence from Academia”
Anna Stansbury, Massachusetts Institute of Technology, Equitable Growth grantee; Kyra Rodriguez, Massachusetts Institute of Technology
Abstract: It is well-documented that women and people of color face disproportionate barriers to academic advancement. However, socioeconomic status is often overlooked. Little is known about whether or how academic careers differ by socioeconomic background. Recent work by Morgan and co-authors (2022) documents how tenure-track academia in the United States is starkly less socioeconomically diverse than the U.S. population. Schultz and Stansbury (2022) further find disciplinary differences, wherein economics, mathematics, and computer science Ph.Ds. in the United States have smaller shares of first-generation college students (no parent with a bachelor’s degree) than other disciplines. Our paper builds upon this limited literature to systematically document key stylized facts at important points in academia’s tenure-track pathway, from the undergraduate level to tenure. We use the National Science Foundation’s Survey of Earned Doctorates and Survey of Doctorate Recipients to trace individuals from their undergraduate degree, throughout their careers, and across a rich set of career outcomes. We find that academic careers are characterized by two phenomena for lower-socioeconomic status doctorates: the leaky pipeline and the slippery ladder. The leaky pipeline metaphor, borrowed from the literature on gender in academia, illustrates that at each step of the academic career after the Ph.D., people from lower socioeconomic status backgrounds are more likely to leave academia. The slippery ladder metaphor is used to describe our finding that at each step in the academic career, people from lower socioeconomic status backgrounds who stay in academia are in lower-ranked institutions. Both phenomena are present even conditional on fixed effects for academic field and prior institutions, illustrating that socioeconomic status plays a role not just on entry to an undergraduate or Ph.D. program but also throughout the academic career trajectory. We further examine these phenomena by field and compare and combine our socioeconomic status results with gender and race. Finally, we explore several possible mechanisms.
“Income, Wealth, and Environmental Inequality in the United States”
Jonathan Colmer, University of Virginia, Equitable Growth grantee; Suvy Qin, University of California, Berkeley; John Voorheis, U.S. Census Bureau, Equitable Growth grantee; Reed Walker, University of California, Berkeley
Abstract: Environmental inequality is thought to be rooted in various aspects of economic inequality, and addressing the latter is believed to reduce the former. However, the relationship between environmental exposure and economic well-being is not well understood, as data on environmental exposure and economic well-being are typically unavailable at the same spatial resolution, and existing evidence on the relationships between income and environmental exposures is largely correlational. This paper aims to provide systematic evidence on the relationship between pollution exposure, income, wealth, and race by combining administrative data from tax returns between 1984–2019, remote sensing measurements of particulate exposure, and sociodemographic information from linked survey, census, and administrative data. We document new facts about the observational relationships between income, wealth, and particulate exposure at the individual level, showing how these relationships differ by race and have changed over time. We use quasi-random shocks to income to examine the causal effect of changes in income and wealth on pollution exposure. We find that racial disparities in pollution exposure are unlikely to be ameliorated by relative improvements in the distribution of income or wealth in the short and medium run.
“Unemployment Risk, Portfolio Choice, and the Racial Wealth Gap”
Chi Hyun Kim, University of Bonn; Ellora Derenoncourt, Princeton University, Equitable Growth grantee; Moritz Kuhn, University of Bonn; Moritz Schularick, University of Bonn
Abstract: Black Americans are exposed to strong cyclical unemployment risk that correlates with stock market returns. Under high exposure to cyclical unemployment risk, it is optimal for individuals to invest less in risky assets and minimize overall risk exposure over their life cycle. Our study shows that cyclical unemployment risk explains a substantial amount of the equity gap across Black and White Americans during 1980–2020: 20 percent of the stock market participation gap and 50 percent of the gap in Black and White equity shares in portfolios. Given continuously rising equity returns, such frictions in the labor market will further perpetuate racial wealth inequality in the United States.
“The Legacy of Lynchings and State-Sanctioned Violence Against Black Americans ”
Jhacova Williams, American University
Abstract: We analyze the extent to which race-specific police-related fatalities are linked to historical lynchings that took place from 1851 to 1930. We show that Black, White, and other racial minorities who reside in counties that experienced a higher number of historical lynchings also face higher levels of police violence today. This relationship holds after accounting for a variety of historical and contemporary characteristics of counties, including arrest rates and homicides. Our results are strongest for Black individuals, which provides evidence of continued violence perpetrated against Black individuals that date back more than 140 years. Additionally, we find that not only are Black lynchings related to contemporary police-related fatalities of Black individuals, but White lynchings and the lynchings of other racial minorities are also linked to police killings of Black individuals today. These results suggest that there has never been a moment in which Black people have been the primary target of state-sanctioned violence in the United States.
“New Evidence on Employee Noncompete, No Poach, and No Hire Agreements in the Franchise Sector ”
Peter Norlander, Loyola University-Chicago, Equitable Growth grantee
Abstract: This paper presents new evidence about the prevalence, source, scope, content, and variety of anticompetitive behavior in the labor market. Drawing from a text corpus of 17,785 franchise disclosure filings, I find that 26 percent of filings from January 2011–August 2022 contained an employee noncompete clause that requires franchisees to bar employees from working for a competitor after leaving. Further, 44 percent contained a nonsolicitation clause barring recruitment between firms, and 25 percent contain a no hire clause. Using new open-source, replicable methods to classify unstructured text, this paper also publicly releases a document corpus, the software used to analyze the data, a knowledge base of rules to detect anticompetitive clauses, and an opensource machine learning classifier to detect no poach clauses. While prior evidence on anticompetitive practices largely draws from individual complaints, survey data, and limited hand-coded samples, this paper spotlights a large and representative sample of previously hidden inter-firm contracts that block employee mobility and describes tools that can automatically identify future unseen instances.
Note: This research was funded in part by Equitable Growth.
“Workers and the Green-Energy Transition: Evidence from 300 Million Job Transitions”
Mark Curtis, Wake Forest University, Equitable Growth grantee; Layla O’Kane, Lightcast; R. Jisung Park, University of Pennsylvania, Equitable Growth grantee
Abstract: Using micro-data representing more than 130 million online work profiles, we explore job transitions into and out of jobs most likely to be affected by a transition away from carbon-intensive production technologies. Exploiting detailed textual data on job title, firm name, occupation, and industry to focus on workers employed in carbon-intensive (“dirty”) and non-carbon-intensive (“green”) jobs, we find that the proportion of workers who successfully transition from dirty jobs to green jobs is rising rapidly, increasing ten-fold over the period 2005–2021. Overall, however, fewer than 1 percent of all workers who ever held a dirty job appear to transition to a green job. We find that the persistence of employment within dirty industries varies enormously across local labor markets; in some states, more than half of all transitions out of dirty jobs are into other dirty jobs. Older workers and those without a college education appear less likely to make transitions to green jobs and more likely to transition to other dirty jobs. When accounting for the fact that green jobs tend to have later start dates, it appears that green jobs and dirty jobs have roughly comparable job durations (within 3 months).
“The Intergenerational Transmission of Employers and the Earnings of Young Workers”
Matthew Staiger, Opportunity Insights, Equitable Growth grantee and former Dissertation Scholar
Abstract: To what extent do connections in the labor market shape intergenerational mobility? I use employer-employee linked data to study one important type of connection: jobs obtained at a parent’s employer. Twenty-nine percent of individuals work for a parent’s employer at least once by age 30. Exploiting transitory and idiosyncratic variation in the availability of jobs at the parent’s employer, I estimate that working for a parent’s employer increases initial earnings by 19 percent. The results are attributable to parents using their connections to provide access to higher-paying firms. Individuals with higher-earning parents are more likely to work for a parent’s employer and experience larger earnings gains when they do. Consequently, the elasticity of initial earnings with respect to parental earnings would be 7.2 percent lower if no one found a job through these connections. The findings raise the possibility that connections to firms through one’s social network could be an important determinant of intergenerational mobility.
Note: This research was funded in part by Equitable Growth.
“COBOLing Together UI Benefits: How Delays in Fiscal Stabilizers Impact Aggregate Consumption”
Michael A. Navarrete, University of Maryland, Equitable Growth grantee
Abstract: The United States experienced an unprecedented increase in Unemployment Insurance claims starting in March 2020, mainly due to layoffs caused by COVID-19. State Unemployment Insurance systems were inadequately prepared to process these claims. Those states using an antiquated programming language, COBOL, to process UI claims experienced an increase in administrative burdens for potential claimants, which led to longer delays in benefit disbursement and an increase in discouraged filers. Using daily card consumption data from Affinity Solutions, I employ a two-way fixed effects estimator to estimate the causal impact of having an antiquated UI benefit system on aggregate consumption. The antiquated UI systems caused a 3.6 percentage point relative decline in total card consumption in COBOL states relative to non-COBOL states. This effect can be decomposed into three types: (1) delays in a claimant filing a claim, (2) delays in a UI benefit system processing a claim, and (3) an increase in discouraged filers. I find a 1.5 percentage point increase in the share of claims that experienced a processing delay over 70 days in COBOL states, relative to non-COBOL states. I also find suggestive evidence that the increase in administrative burdens for claimants in COBOL states led to an additional 5.6 million discouraged filers relative to non-COBOL states. These discouraged filers would have claimed UI benefits in COBOL states if the administrative burdens in their COBOL states had been as low as in non-COBOL states. Performing a back-of-the-envelope calculation using 2019 data, I find that a 3.6 percentage point decline in consumption in COBOL states in 2020 after the emergency declaration corresponds to a real Gross Domestic Product decline of $220 billion (in 2012 dollars).
“The Dynamics of Large Inflation Surges”
Andrés Blanco, University of Michigan, Equitable Growth grantee; Pablo Ottonello, University of Michigan; Tereza Ranosova, University of Michigan
Abstract: We empirically characterize episodes of large inflation surges that have been observed worldwide in the past three decades. We document four facts. (1) Inflation surges tend to be persistent, with the duration of disinflation exceeding that of the initial inflation increase. (2) Surges are initially unexpected but followed by a gradual catch-up of average short-term expectations with realized inflation. (3) Long-term inflation expectations tend to exhibit increases that persist throughout disinflation. (4) Policy responses are characterized by hikes in nominal interest rates but no tightening of real rates or fiscal balances. In sum, episodes of large and persistent inflation tend to occur with government responses that depart from the prescriptions of textbook policy rules and which instead are consistent with “fear of tightening.”
“Race, Jobs, Automation and the Post-COVID-19 Future of Work in America”
Kristen Broady, Federal Reserve Bank of Chicago; Anthony Barr, National Bankers Association; Aisha Meeks, Morehouse College; Ryan Perry, Federal Reserve Bank of Chicago
Abstract: The COVID-19 pandemic has accelerated trends in automation as many employers seek to save on labor costs amid widespread illness, increased worker leverage, and market pressures to onshore supply chains. While existing research has explored how automation may displace nonspecialized jobs, there is typically less attention paid to how this displacement may interact with preexisting structural issues around gender and racial inequality. This analysis updates that of a 2021 Brookings paper by the authors, finding that Black and Hispanic workers continue to be overrepresented in the 30 occupations with the highest estimated risk of automation and underrepresented in the 30 occupations with the lowest estimated risk of automation. The updated analysis also includes new attention to automation’s impact on women workers, wage structures, a consideration of the broader implications of automation for global economics, and a discussion of the potential interplay of automation with recent developments in artificial intelligence.
Six years later, more evidence shows the Tax Cuts and Jobs Act benefits U.S. business owners and executives, not average workers
When policymakers were debating the Tax Cuts and Jobs Act of 2017, many proponents claimed that average U.S. workers would benefit via wage increases. These adherents of trickle-down economic theory argued that, alongside other business tax cuts in the law, slashing the C-corporation tax rate by 14 percentage points, from 35 percent to 21 percent, would reduce these firms’ cost of capital—or how expensive, after tax, it is to invest in new projects. This, proponents said, would spur private investment, which, in turn, would boost workers’ productivity and thus increase wages and job openings.
This highly speculative string of contingencies is a tenet of faith among supply-side economists. Yet the empirical evidence has never been on their side. And now, nearly 6 years after the Tax Cuts and Jobs Act was signed into law by former President Donald Trump, a new study further reinforces that these business tax cuts benefit highly paid executives, not the vast majority of U.S. workers.
Indeed, the paper—by Patrick Kennedy, Paul Landefeld, and Jacob Mortenson, all of the U.S. Congress’ Joint Committee on Taxation, and Christine Dobridge of the Federal Reserve Board of Governors—finds that almost all of the benefits of the 2017 law’s signature $1.3 trillion C-corporation tax cut went to high-income shareholders and executives—not low- or moderate-income workers. (This $1.3 trillion figure refers to the 10-year cost estimate specifically for the C-corporation rate cut provision, provided by the Joint Committee on Taxation before the bill was passed.)
Using anonymized tax records and sophisticated methods, the four co-authors find that workers below the 90th percentile in their firm’s earnings distribution did not receive any wage boost from the C-corporation tax cut. (See Figure 1.)
Figure 1
To reach these conclusions, Kennedy and his co-authors compare C-corporations—the legal structure used by U.S. firms, including all public companies, seeking large amounts of outside investment—with similarly situated S-corporations, which raise money from a limited number of shareholders and are treated as a pass-through entity by the U.S. tax code. S-corporations’ profits are not taxed at the firm level but instead flow to owners and are taxed at the individual level. C-corporations received a larger tax cut in 2017 than S-corporations did, a difference the authors exploit for their analysis.
Kennedy and his co-authors conclude that 49 percent of the gains from the C-corporation cut went to the owners of firms, while 11 percent went to firm executives (the top five highest-paid workers at the firm). The other 40 percent went to high-income workers (or those above the 90th percentile within their firm). Precisely zero percent went to low-paid workers (or those below the 90th percentile). This means executives alone pocketed $13.2 billion annually—a pay bump of roughly $50,000 per executive—while median workers received nothing.
In total, 81 percent of the gains from the Tax Cuts and Jobs Act’s C-corporation rate cut were captured by the top 10 percent of the U.S. income distribution, with the top 1 percent seeing a whopping 24 percent of the benefits. (See Figure 2.)
Figure 2
The paper does not address other types of inequality, but those at the top of the U.S. earnings distribution are disproportionately White or Asian, so it is likely that the distributional impacts on display in this study represent an exacerbation of racial income gaps in the United States.
Further, the four co-authors find that the C-corporation rate cut delivered $122 billion in additional private income per year—but to achieve that modest output gain, the federal government spent $86 billion in foregone revenue. It’s important to note that this figure is lower than what the Joint Committee on Taxation and other scorers have estimated because this paper’s authors find that the tax cut spurred some additional profits, leading to slightly higher taxes paid than had there been no feedback effects.
One caveat to keep in mind: This study is probably most illustrative of the impact of the C-corporation cut on mid-sized firms, since there are few S-corporations large enough to serve as a reliable comparison group to large multinational C-corporations. Additionally, to target the analysis on firms that the authors are confident received a large tax cut, the sample is restricted to companies with at least 50 employees and $1 million in sales per year from 2013 to 2016.
The findings from Kennedy and his co-authors dovetail with analysis of pre-Tax Cuts and Jobs Act tax breaks from Eric Ohrn from Grinnell College. Ohrn finds that executive pay increases by 25 cents for every dollar of tax cuts received. Ohrn also finds that a 1 percentage point decrease in effective tax rates increases the compensation of the five highest-paid executives at affected firms by 4.2 percent, or $611,000 on average. This is very similar to a previous finding from Kennedy’s three co-authors, who, using a different dataset, traced the impact of the same business tax cut to determine that corporate officers received a 4.4 percent increase in compensation for every 1 percentage point decrease in the tax rate, compared to a more modest 1.3 percent raise for nonofficers.
Why do owners and executives capture most of the benefits from business tax breaks? The best explanation is that U.S. labor market inefficiencies prevent workers from being rewarded for their productivity. Low- and moderate-income workers lack the necessary bargaining power to demand their fair share of tax cut proceeds, while executives enjoy undue influence over their compensation, winning raises that are not justified by firm performance.
This is consistent with research on monopsony, in which employers enjoy the market power necessary to keep wages inefficiently low. Indeed, the previous study from Kennedy’s three co-authors finds that smaller firms are more likely to share tax break proceeds with median-wage workers—evidence that market power, proxied here by company size, plays a role.
Additionally, Ohrn finds that firms with large institutional shareholders and shorter executive tenures—examples of strong corporate governance structures—did not increase executive compensation with proceeds from their tax breaks. This implies that companies with less robust checks on corporate governance may be falling prey to “executive capture,” in which CEOs leverage relationships with members of their Boards of Directors to win higher compensation.
This theory is corroborated by other researchers who have looked specifically at Congress’ past attempts to use the tax code to limit executive compensation. Section 162(m) of the Tax Cuts and Jobs Act, for example, removed the tax deductibility of CEO pay. While a similar provision in the law that applied to nonprofit organizations did appear to reduce CEO salaries, Section 162(m) had little to no effect, according to multiple rigorous studies. This implies that even when policymakers effectively make it more expensive to pay CEOs, executive salaries still rise—proof that these exorbitant pay packages are not the result of rational economic decision-making.
The new findings from Kennedy and his co-authors are important for two main reasons. First, they provide important nuance to an age-old policy question: Who bears the costs or benefits from business tax changes? Historically, researchers have delivered fairly crude, aggregate estimates. The Joint Committee on Taxation assumes, for example, that based on its synthesis of the academic literature a full 100 percent of the cost of tax increases is borne by owners in the short run, and 75 percent is borne by owners in the long run, with workers paying the remaining 25 percent. The committee increases the share borne by owners to 95 percent for tax changes affecting pass-through businesses because they have less ability to move capital or operations abroad to avoid taxes.
In contrast, the Congressional Budget Office allocates 75 percent to capital income and 25 percent to labor income. The U.S. Treasury Department takes a more complicated approach that distinguishes between normal and supernormal returns to capital, but the upshot is an 82 percent-18 percent split between the capital and labor incidence of the corporate tax.
Yet the Joint Committee on Taxation, Congressional Budget Office, and Treasury Department all assume that the benefits or costs to workers from tax changes mirror the distribution of wages more generally. The evidence above belies that assumption, demonstrating that wage increases from tax cuts are even less equally shared than the nation’s already very unequal wage distribution. This means that researchers and policymakers must think more granularly about the heterogeneous effects of tax policy.
Second, the authors’ findings show how taxes interact with other economic phenomena, such as market power. Given the outsized power of employers in the U.S. labor market, corporations may be able to both hoard the proceeds of tax cuts and pass on the cost of tax increases to workers. This asymmetrical situation would leave policymakers in a bind: Reversing tax cuts alone might not be enough to claw back the unjustified gains that shareholders and executives received from the Tax Cuts and Jobs Act.
That’s why researchers and policymakers must think about combating inequality more holistically. Tax policy researchers, for example, should adjust their models’ assumption that labor markets function competitively. And policymakers should consider tax policy changes in concert with other reforms that address inequality in the United States, such as lax corporate governance standards and weak labor and antitrust protections.
Equitable Growth announces new Steering Committee members to guide grantmaking and shape research priorities

The Washington Center for Equitable Growth today announced five new members of its Steering Committee. Daron Acemoglu of the Massachusetts Institute of Technology, Trevon Logan of The Ohio State University, Suresh Naidu of Columbia University, Heidi Williams of Dartmouth College, and Catherine Wolfram of MIT will join the existing members of the Steering Committee to expand Equitable Growth’s network of academic and policy advisors.
This prestigious group includes established scholars whose research has influence beyond academia, as well as scholars who have experience serving in the federal government. These experts help guide Equitable Growth’s investments in rigorous research to inform economic policymaking that will lead to strong, stable, and broadly shared growth. They also assist the organization in supporting the next generation of scholars.
“We’re thrilled that this innovative group of scholars is joining our Steering Committee,” says Equitable Growth President and CEO Shayna Strom. “Their cutting-edge scholarship and engagement in the policy process make them well-equipped to shape the next chapter of Equitable Growth’s strategy to examine how inequality affects economic growth and prosperity. We’re looking forward to working with them as we continue to bring together the next generation of researchers and policymakers seeking to advance evidence-based agendas that foster strong, stable, and broadly shared growth.”
The expansion of the Steering Committee comes at a pivotal moment for the organization. After a decade of grantmaking, Equitable Growth is reimagining how our support for research and an academic network can lead to policy changes. Over the course of the next few years, we will be introducing more targeted training and more opportunities for our academic network to engage with policymakers and the media, including through public service.
Our grantmaking will also be more targeted, aiming to address areas where policymakers need more evidence to support future policy work that can reduce inequality and spur growth. We are maintaining our commitment to support the next generation of scholars and increase diversity across the social sciences through the more broad-based Request for Proposals: Research grants for early career scholars, announced last week.
The new Steering Committee members are extremely accomplished in their respective fields. Their knowledge and experience will guide Equitable Growth as it expands into new areas where policymakers are most in need of research evidence and continues its work in other fields.
Acemoglu’s work is focused on democracy, political economy and institutional development, and labor economics, with a recent focus on the impact of technology and artificial intelligence on inequality and economic growth. He hopes his research can change the future direction of AI and technological advancement to become more pro-worker, to generate more good jobs for workers, and to ensure shared prosperity across the labor force.
Logan primarily studies health economics and racial health disparities, economic demography, and economic history, with a focus on assessments of living standards over time. His research looks at how policies and political processes lead to broader trends in the economy, including stifled human capital development and growing racial inequality in the United States. He also has experience developing the next generation of leaders, serving as co-director of the American Economic Association’s mentoring program and working with undergraduates at The Ohio State University to be more integrated and invested in the research process.
Naidu researches topics in the fields of development economics, labor economics, and political economy, including labor organizing and monopsony power. His work is largely focused on economic and political power and inequality. Naidu is a big proponent of multidisciplinary research, collaboration, and discussions as methods of expanding traditional ideas of where inequality crops up and how to apply research findings in the real world.
Williams focuses on science and innovation, their role in economic growth, and their impacts on society and the economy more broadly, with recent work looking at patents and innovation, as well as various aspects of health economics. Much of her work touches upon inequality and the areas in which it is perhaps unexpectedly seen, such as in who gets funding to do future economics research. Williams also serves as a mentor for early career scholars, helping them through their doctoral programs.
Wolfram’s area of focus is applied economics and climate economics, particularly on the economics of energy markets, rural electrification programs in the developing world, U.S. energy efficiency programs, and environmental regulations. She primarily works on ways to address climate change and build coalitions to tackle the challenge of global warming. Wolfram has also worked in public office, having served as President Joe Biden’s Deputy Assistant Secretary for Climate and Energy at the U.S. Department of the Treasury early on in the administration.
To learn more about each of the new members and their research priorities check out the video announcement below.
These five scholars join our fantastic Steering Committee members Byron Auguste of Opportunity@Work, Alan Blinder of Princeton University, Karen Dynan of Harvard University, Jason Furman of Harvard University, Hilary Hoynes of the University of California, Berkeley, Atif Mian of Princeton University, and Robert Solow of MIT. We are thrilled to welcome them and excited to work together in the coming months and years to advance our research agenda and shape the next generation of social scientists.
What the research says about the impacts of hospital consolidation across the United States

When patients in the United States rely on hospitals for care, they are often at their most vulnerable, such as during acute illnesses, when suffering major injuries, or while giving birth. Hospitals also are large employers of significant size and import to their local communities, impacting local economies and labor markets outside of their walls.
In recent decades, hospital mergers and consolidations have been on the rise across the country. This leads to more highly concentrated hospital and healthcare markets and reduced competition. Increasingly concentrated hospital markets, resulting from consolidation and other dynamics, have far-reaching impacts on patients and providers, ranging from the types of care they can receive to the wages they earn.
In a recent report from the Washington Center for Equitable Growth, “The consequences of U.S. hospital consolidation on local economies, healthcare providers, and patients,” I explore the current evidence on the causes and effects of hospital consolidation in the United States. To illustrate these impacts of hospital consolidation, the report spotlights three important examples: the impact on rural hospitals and their communities, the impact on nurses’ wages and employment, and the impact on access to and quality of maternity care.
Specifically, the report shows that:
- When hospital mergers result in higher market concentration and decreased competition among healthcare providers, workers and local economies can suffer due to increased prices. Rural communities are particularly vulnerable to these effects.
- Healthcare providers, specifically nurses and pharmacy workers, are often subject to the negative effects of monopsony power—the power that monopolistic hospitals can exercise in local labor markets with increased market share due to consolidation—resulting in suppressed wages and decreased job mobility.
- Patients’ care options can become limited, resulting in lower quality care or the restricted geographic availability of care. Yet mergers also can result in an influx of financial support, leading to new lines of health services, access to a larger network of healthcare providers, and a wider or newer array of technologies for patients, all of which can, in some cases, improve outcomes.
Much is known about the effects of consolidation on healthcare prices, and there is a growing body of work examining the impacts of hospital consolidation on the U.S. labor market and the quality of care. But there remain many questions that are pertinent to evidence-based policy development. In the report, I also recommend areas for further research to inform policy development and help mitigate the harmful impacts of consolidation, including:
- How do mergers and acquisitions deliver on their promises post-merger?
- How do clinicians’ roles change in concentrated markets?
- Which patients are the most vulnerable to the impacts of consolidation?
Some specific questions and areas in need of further exploration that the report poses to researchers, stakeholders, and policymakers are centered on:
- Local economies. As policymakers and academics look further into the consequences of hospital consolidation on local economies across the United States, they can think about them as internal impacts to the hospitals themselves and external impacts to the communities in which they operate. Further research questions for consideration include where and to whom costs are passed in local markets following hospital mergers, how the consequences in terms of economic growth may vary by market demographics, and if there are trends due to location, particularly any interactions with nearby economically homogenous or affluent areas.
- Clinicians. Regarding the clinician-patient relationship and how hospital consolidation can affect it—with a particular eye to the issues of health equity and clinician diversity—researchers should investigate impacts on the continuity of care under ownership changes and the availability of specialists and clinicians of diverse backgrounds. Furthermore, they can investigate the availability of resources and support for clinicians pre- and post-mergers.
- Patients. As it stands, the evidence is not conclusive or consistent regarding the association between hospital mergers and the subsequent quality of care. The quality effects of consolidations differ depending on the role of hospitals in their communities and the measures used to assess that quality, including mortality, readmissions, complications, clinical processes, and patient experiences. To design targeted and effective policies, more evidence is needed on the impacts of hospital consolidation on various demographic populations and disease groups, and how those activities may exacerbate or improve disparities.
The Washington Center for Equitable Growth has taken on this topic of decreased competition among hospitals because a healthy healthcare ecosystem is essential for patients and critical to the healthcare workforce and local economies. Given the importance of hospitals, policymakers and researchers must do more to understand the underlying causes of hospital consolidation in the United States and work to mitigate the negative impacts that arise from a lack of competition in hospital markets.
By prioritizing the preservation of competition, the transparency of merger and acquisition activities, and equitable access to care, policymakers and researchers can help create a healthcare system that benefits all stakeholders and improves health outcomes for all patients. When markets maintain a healthy level of competition, the U.S. economy can become more equitable and improve the lives of all Americans.