Matching competition policy in the U.S. healthcare industry to address a new generation of challenges in provider markets

Overview
Antitrust policy in the U.S. healthcare sector is perennially 10 years behind the industry. But at the start of the Biden administration in early 2021, there was hope for a change. After nearly 40 years of what has been called a complete antitrust policy failure,1 the administration’s promise to pursue aggressive competition policies—and ultimately enhance competitiveness—was met with near-desperate relief.
The promise began with campaign promises and culminated in the July 2021 “Executive Order on Promoting Competition in the American Economy.”2 The executive order included an especially spectacular “whole-of-government policy” that included specific applications to the healthcare sector and its hospital markets. Competition policies for the health sector must originate not just from the Antitrust Division of the U.S. Department of Justice and the Federal Trade Commission—the two federal agencies tasked with enforcing the antitrust laws—but also from the many agencies in the U.S. Department of Health and Human Services.
Matching competition policy in the U.S. healthcare industry to address a new generation of challenges in provider marketsDownload
Unfortunately, it is not clear whether this executive order resulted in significant policy changes thus far. Most healthcare competition policies remain within the domain of the two federal antitrust agencies, and antitrust enforcement actions in the healthcare sector have focused on preventing mergers between hospitals and hospital systems.3 Yet costly and anticompetitive consolidation persists. Indeed, in many respects, consolidation accelerated throughout the healthcare sector, and both the antitrust agencies and the Biden administration’s other healthcare policymakers have shown little appetite to counter these harmful trends.
To be sure, the two agencies deserve substantial credit for what, in certain respects, amounts to an invigorated enforcement effort. The agencies have targeted and halted several proposed hospital mergers, thereby saving consumers and patients from the extortive prices, declines in quality, and other typically severe costs of hospital market power. These antitrust policies would have been welcome a couple of decades ago, but they do not addresses the market’s current challenges.
An updated competition policy for the healthcare sector—one that is not playing catch-up to the industry—requires embracing two key insights. First, antitrust enforcement cannot be limited to preventing further hospital mergers. Instead, other forms of pernicious consolidation and anticompetitive conduct deserve not just attention but priority. Second, antitrust enforcement cannot amount to the entirety of competition policy. The whole-of-government approach to competition policy must include additional state and federal policymakers and additional legal authorities that can uniquely meet the costly lack of competition in healthcare provider markets.
This issue brief will detail how the U.S. hospital sector succumbed so thoroughly to market consolidation, and then presents the key competition challenges in this current market. The brief then makes several suggestions for how policymakers can match antitrust policies to current hospital market conditions, specifically by engaging the federal Centers for Medicare and Medicaid Services in competition policy, confronting state immunities from federal antitrust enforcement, and bolstering fiduciary duties in the Employment Retirement Income Security Act of 1974. As this brief will demonstrate, each of these actions offer untapped tools available to policymakers and, taken together, would represent a significant advance in matching competition policy to today’s challenges.
Hospital consolidation and the gradual emergence of 1990s antitrust policy
Healthcare competition policy begins with, and should be prioritized for, the lack of competition among healthcare providers, and especially among hospitals. Hospitals account for more than 30 percent of our nation’s total healthcare expenditures, with physicians and clinics consuming less than 20 percent, and pharmaceuticals spending less than 10 percent.
Hospital markets also are the most monopolized and least competitive. Consolidation among pharmaceutical benefits managers and health insurers causes much angst among policymakers, as it should, but those markets do not exhibit the degree of monopolization of the hospital sector.
Consolidation by healthcare providers began with an aggressive wave of hospital mergers in the 1990s. By 1995, hospital mergers-and-acquisition activity was nine times its level at the start of the decade, and by 2003, almost 90 percent of Americans living in the nation’s larger metropolitan statistical areas faced highly concentrated hospital markets.4 This wave of hospital consolidation, predictably, alone was responsible for price increases of at least 5 percent for inpatient services and similarly responsible for 40 percent increases where merging hospitals are closely located to one another.5
A second merger wave from 2006 to 2009 significantly increased the hospital concentration in 30 additional metropolitan statistical areas.6 And over the past 15 years, the vast majority of Americans have been subject to monopoly power in their local hospital markets.
It is hard to overstate how harmful this consolidation wave was to U.S. patients and consumers. An abundance of research examining hospital acquisitions over those two merger waves reveals some basic truths:
- When nearby hospitals merge, prices go up.7
- Cities with fewer competing hospitals exhibit higher prices.8
- Even hospitals acquired by distant health systems increase prices more than unacquired, standalone hospitals.9
In fact, most of our nation’s unsustainable healthcare costs are driven by hospital care, and most of that price inflation over the past three-and-a-half decades has been due to hospital mergers.10
Although the Federal Trade Commission and other antitrust enforcers were aware of these developments, effective antitrust policies to counter this consolidation meaningfully began only in the late 2000s. Antitrust policymakers failed to halt the rapid consolidation of hospital markets in part because many judges11 and health policy leaders12 used to believe, falsely, that hospital consolidation led to efficiencies and better care delivery. It took years of painstaking academic research to arrive at today’s updated understanding of how hospital monopolies exact economic harm and how much damaging monopoly power is generated by hospital mergers.
Although hospital systems have continued to consolidate, antitrust policymakers are now armed with better analytical techniques and a wealth of evidence that they’ve started employing to stop the most egregiously anticompetitive mergers. Enforcement actions finally started credibly stopping mergers in the 2010s.13 Yet these improved antitrust enforcement tools came after many local hospital markets were already consolidated.
Current antitrust enforcement actions in the healthcare sector continue this focus on preventing mergers between hospitals and hospital systems.14 Halting these mergers has saved consumers and patients from the typically severe costs of hospital market power, including extortive prices and declines in quality. The current Federal Trade Commission—the federal antitrust agency with primary responsibility for scrutinizing hospital mergers—deserves credit for taking action against the worst of these combinations.15
But consolidation among healthcare providers now takes a variety of different forms. These new consolidation trends, which are at least as costly as those that now preoccupy antitrust enforcement, require different policy strategies. If policymakers continue relying on antitrust policies that were forged from the experiences of a couple decades ago, then they cannot address the market’s current challenges.
Current competition challenges in U.S. healthcare markets
The current marketplace presents three distinctly different consolidation challenges, none of which can be halted with current policies or antitrust enforcement strategies and together require a thorough competition policy update. These challenges are:
- Established monopolies and exclusionary conduct
- Hospital acquisitions of independent physicians
- Cross-market mergers
Let’s examine each of these challenges in turn.
Established monopolies and exclusionary conduct
U.S. antitrust policy must confront the reality that most local hospital markets are already highly concentrated, so greater focus should address anticompetitive conduct by these current hospital monopolies. The most pressing competitive danger these current monopolies pose is the entrenchment of their dominance and their foreclosure of more efficient entrants.
Hospitals and hospital systems are doing this through a variety of well-tested techniques. One is using their dominance to impose “all-or-nothing” contracts, which require insurers to pay for all of a hospital system’s services or drop out of the market altogether. This strategy prevents insurers from contracting with select healthcare providers—creating so-called narrow networks—that can direct patients to higher-value providers and stimulate competition between rival facilities.
Hospital monopolists bundle their services together, which forces patients to pay for a system’s costly services if they want to rely on their critical services. In order to have access to the only trauma center in town, for example, patients must also commit to the hospital system’s oncologists and cardiologists—practices that would be vulnerable to competition from other providers and telemedicine companies. Hospital monopolists work to squeeze out small, nimble providers that might offer lower-cost alternatives to the multi-specialty giants. And if hospital monopolists fail to drive them out, they purchase them.
Another tactic hospitals use to exploit market power is collaborating with dominant insurers. Conventional wisdom suggests that dominant insurers and dominant hospital systems would be at loggerheads over the prices of medical services. In fact, these large entities often collude with each other to keep out other competitors. By promising each other that they won’t give smaller entities more favorable terms—these arrangements are commonly called most-favored-nation, or MFN, contracts—giant insurance payers and giant healthcare providers secure each other’s dominance.
This collusion among giants was discovered in Massachusetts in 200016 and challenged by the U.S. Department of Justice in Michigan in 2010.17 But quiet cooperation between dominant payers and providers nonetheless remains widespread. Many large insurers pursue similar strategies with insurance brokers, demanding that they market their products either exclusively or on favorable terms. An important case involving this conduct recently took place in Florida,18 and other insurance markets are similarly foreclosed because of dominant hospital-insurer collaboration.
These efforts prevent new insurers and upstart healthcare providers—those most likely to introduce news business strategies and care models—from gaining traction in the marketplace. Victims of this market “foreclosure” usually are innovators: insurers with new price transparency features, physician-led ambulatory surgical centers that offer specialty care, and behavioral health providers that use new virtual technologies. Low-cost and high-value “centers of excellence,” which encourage patients to travel to destinations with specialized experts, also are harmed.
Dominant hospitals and insurers are well aware of the threats that innovations pose to their business models. They know the healthcare market of the future puts less primacy on inpatient care and more on virtual care. They know that healthcare services are provided at higher quality and lower costs at facilities that do not suffer from the overhead and governance burdens of costly multispecialty centers. And they know that telemedicine and hospitals-at-home companies pose existential threats to their dominance.
These dynamic considerations need to factor into long-term and farsighted competition policies. The immediate lesson, however, is that challenging hospital mergers does little to stop the harm from already-dominant systems, many of which are engaging in anticompetitive conduct that forecloses competition and enshrines their market power. A regular staple of healthcare policy must be to monitor consolidated markets, confront anticompetitive conduct, and ensure that patients can still benefit from the dynamism of competition.
Hospital acquisitions of independent physicians
Antitrust policies also must prioritize confronting a new and equally harmful consolidation trend. Over the past decade—and especially once the COVID-19 pandemic took hold—hospitals have been acquiring physician practices at a rapid rate. Nearly three-quarters of the nation’s physicians are now employed by hospitals or corporate entities, compared to less than one-third less than two decades ago.
Current antitrust policy considers hospital acquisitions of physician practices as “vertical” mergers that are largely innocuous because they do not increase the concentration in either hospital or physician markets. But mounting evidence shows that these acquisitions lead to higher costs, probably because many of these transactions are better described as mergers of substitutes rather than compliments.
In other words, many outpatient clinics offer similar services as those offered in hospitals, so when hospitals acquire physician practices, they eliminate competition. Worse, outpatient care is less costly than similar services offered inside hospitals, and medical advances continually expand what can be done in outpatient settings. The loss of independent physician practices means the loss of the often better and almost always less expensive alternative.
The dynamic consequences of these acquisitions—the harms to innovation—are probably even more costly. Controlling physicians means controlling referrals, and hospitals rely on referrals for their most lucrative services. Reciprocally, the biggest threat to hospital dominance is if physicians direct their patients elsewhere, and the current market now offers real alternatives to traditional hospital care: specialty providers, regional providers with telemedicine follow-ups, hospital-at-home care, and even physician practices that expand into secondary care.
Moreover, many of these new practice models are built atop digital analytics, virtual technologies, and innovative financing that have the potential to produce new care models that might upend hospital monopolies altogether.
Perhaps what is most frightening to hospitals is that many of these innovations are designed to promote population health such that people are kept out of the hospital. Indeed, these innovations are intended to drastically reduce patients’ need for hospitals altogether. So, when hospitals acquire the source of these potential innovations, they don’t merely enshrine their monopoly positions. They also engineer a future in which we continue our dependence on them.
Cross-market mergers
A third consolidation challenge emerging with greater frequency is the so-called cross-market hospital merger. These mergers are better described as “hospital megamergers,” among them the 2022 union of Advocate-Aurora Health with Atrium Health’s hospital systems, which combined 67 hospitals and 1,000 sites of care across six states in the Midwest and Southeast United States.
Antitrust authorities describe these as cross-market or out-of-market mergers because they involve providers that do not compete within a single geographic hospital services market. For instance, Atrium’s hospitals operated in North Carolina, South Carolina, Georgia, and Alabama, whereas Advocate-Aurora’s were located in Illinois and Wisconsin. From a traditional lens, the merger of the two giant hospital systems did not eliminate competition in any regional hospital market. As such, their treatment under current merger law is uncertain.
Nonetheless, research indicates that out-of-market systems acquiring independent hospitals leads to price increases, with larger price effects when the merging hospitals are within close proximity of each other (while remaining in separate markets) and when the merging hospitals contract with common insurers.19 Additional evidence suggests that these mergers endow hospital systems with pricing power over regional insurers and large employers.20
Antitrust enforcement, when acting only with familiar models and with reliable predictions, is to be commended for its care and precision. But the experience of antitrust policy in hospital markets reveals not care but instead excessive caution. To be sure, antitrust enforcement agencies can only pursue policies that are supported by our federal judiciary, and our federal judges have an unfortunate history of failing to block even the most egregious hospital mergers.
Still, antitrust enforcement is, at least in part, designed to prevent market harm before it takes place. A competition policy that lags decades behind consolidation trends is doomed to fail.
Suggestions for a revived competition agenda in the healthcare sector
A prerequisite to making U.S. healthcare markets more competitive requires understanding the particular dysfunctions it nurtures. One dysfunction is that hospital monopolies are easily formed and rarely punished. A second is that hospital monopolists’ lobbying of state legislatures for protections against competition generates lucrative rewards. A third is that intermediary healthcare purchasers, such as dominant insurers, have shown little eagerness either to contest healthcare provider market power or to pursue meaningful innovations to how they purchase care for their subscribers.
If Americans are to enjoy the fruits of a competitive healthcare marketplace, policymakers need to address all three of these market failures.
It is worth repeating the conventional calls for continued and enhanced support of the two federal antitrust agencies, which historically have simply not had the resources necessary to stem the steady waves hospital acquisitions. But in addition to the frequent and important requests for invigorated and adequately resourced antitrust policy agencies, three additions could meaningfully bolster competition policy in the U.S. health sector:
- Engaging the federal Centers for Medicare and Medicaid Services in competition policy
- Confronting state immunities from federal antitrust enforcement
- Bolstering fiduciary duties in the Employment Retirement Income Security Act of 1974
Each of these actions, taken together, would go a long way toward matching competition policy with current U.S. hospital market practices.
Engaging the federal Centers for Medicare and Medicaid Services in competition policy
Historically, the Centers for Medicare and Medicaid Services, or CMS, has focused its attention almost exclusively on policies that involve the financing of healthcare. Perhaps the agency paid little attention to the consolidation of healthcare providers because Medicare enjoys pricing power, but this was an error. Even if hospital monopoly power does not directly impose higher prices onto the Medicare program, it does have two adverse consequences for Medicare.
First, a reduction in competition translates into a reduction in the quality of care. Medicare beneficiaries have surely suffered because they lived in markets with little competition between hospitals. And second, because hospital monopolies enjoy enormous pricing power over private commercial insurers, the hospitals experience less pressure to economize on the costs of care.
Accordingly, hospitals that enjoy monopoly power in commercial markets exhibit higher costs and, indirectly, cause Medicare payments to increase for the same healthcare. For these reasons, the Centers for Medicare and Medicaid Services’s policy responsibilities and objectives are deeply shaped by the concentration of U.S. hospital markets, and it therefore should be armed and encouraged to advance procompetition policies. Additionally, because the agency gathers enormous amounts of patient outcomes data, it is uniquely well-positioned to assess the costs of monopoly and to identify the benefits of competition.
The Centers for Medicare and Medicaid Services could contribute to healthcare competition policy in a number of ways. First, and most simply, it could invest in an office of provider competition policy, which could either sit alongside or within the Center for Medicare and Medicaid Innovation, the agency’s innovation center. Such an office could use the wealth of CMS data to issue reports, identify markets where competition is limited or is painfully needed, and offer suggested avenues for encouraging entry. And because payment is so central to the entry and survival of healthcare provider strategies, competition policies that are integrated with payment policies would offer important complementarities.
The Centers for Medicare and Medicaid Services could also play a more central role in administering merger policies. Just as certain industry mergers must gain the approval of the U.S. Department of Transportation and the Federal Communications Commission in their industrial bailiwicks, in addition to clearing the antitrust laws, the agency could either offer assessments or issue authorizations of proposed mergers. The hospital sector certainly would be more efficient and offer more value if hospitals were required to pass through a more scrutinizing approval process.
Confronting state immunities from federal antitrust enforcement
In the past year, the North Carolina Senate unanimously approved a bill that would give antitrust immunity to one of the state’s major health systems.21 Just as there is consensus among health policy experts that hospital competition is desirable—that it brings value, improves quality, and reduces prices—there is consensus that antitrust immunity is undesirable because it does the opposite.
Why would the state Senate offer such a sweeping and harmful antitrust immunity? Sadly, this is a reflection of the political economy of healthcare, in which hospitals are often the largest employers and most powerful economic entities in the regions in which they are located. For these reasons, they often enjoy outsized political influence, at the expense of dispersed patients and consumers.
Over the past decade, just as the Federal Trade Commission increased its scrutiny of healthcare provider consolidation, hospitals have increasingly turned to their state legislatures to sanction them to pursue transactions that the antitrust laws would prohibit. So-called certificates of public advantage, or COPAs, which give permission to specific mergers under stated conditions, are one exercise of this state action immunity. COPAs are now operative in multiple states,22 but the bill passed in North Carolina sought even more sweeping immunity.
Competition advocates who decry monopolies and seek competitive markets know that the states, particularly when they act as a grantor of specific political favors, can be the most harmful impediment to meaningful competition policy. Congress should be aware that many states are using the “state action doctrine” to evade federal antitrust enforcement, and Congress should know that it has the power to preempt states’ efforts to invoke the doctrine.
Bolstering fiduciary duties in the Employment Retirement Income Security Act of 1974
Because much of healthcare is purchased through intermediaries, such as insurers and employers, consumers and patients alike rely heavily on both the wisdom of and the legal obligations imposed upon those intermediaries. Like all intermediaries, however, these healthcare purchasers are imperfect agents. For this reason, the U.S. Congress passed the Employee Retirement Income Security Act, or ERISA, in 1974, which imposes a fiduciary duty on employers when they manage employee-benefit dollars.
ERISA enforcement has historically focused exclusively on protecting employee pensions and retirement plans, but it equally applies to employee health benefits as well.23 That means that employers that administer ERISA plans have a fiduciary obligation to be faithful stewards of their employees’ healthcare dollars. Too frequently, employer-sponsored health plans do not invest in shopping for high-value healthcare and instead pay the inflated prices that established hospitals offer. This not only wastes employee dollars but also allows lethargy to spread throughout the market.
The Employee Retirement Income Security Act offers legal levers to compel employer-sponsored plans to be more active, demanding, and creative shoppers for healthcare. Some employers have taken seriously their roles as careful fiduciaries for their employees’ healthcare, and several have forged valuable programs that should become the norm for most U.S. employers: teaming up with centers-of-excellence programs, collaborating with local primary care providers, contracting in bulk for high-volume tertiary care, and similarly creative healthcare purchasing. Policymakers can learn from these innovations, and ERISA enforcement could compel many employers to do so.
Conclusion
There is an urgent need to recognize the unusually serious consequences, for both consumers and the general welfare, of leaving our nation’s healthcare consumers exposed to monopolized healthcare markets. If consumers were both aware of the true cost of their health coverage and conscious that they, rather than someone else, are paying for it, they surely would demand more value from their healthcare purchases.
Aggressive antitrust enforcement can prevent further economic harm and perhaps can undo costly damage from healthcare providers that, in error, were permitted to become monopolists. To be sure, such a policy includes aggressive hospital merger review, but it requires much more. Greater attention—and an antitrust policy update—is necessary to address new waves and types of provider consolidation.
Creative market and regulatory initiatives will be needed to unleash the competitive forces that consumers need. Where there is danger, there is opportunity. Competition-oriented policies can and should yield substantial benefits both to premium payers and to an economy that badly needs to find the most efficient uses for resources that appear to be increasingly limited. This might involve including federal agencies (such as the Centers for Medicare and Medicaid Services) and legal authorities (such as the Employee Retirement Income Security Act) that have not been part of the traditional competition policy toolbox.
—Barak D. Richman is a visiting professor of law at George Washington University School of Law, a professor of law, business administration, and economics at Duke University Law School, and a visiting scholar at the Clinical Excellence Research Center at the Stanford University School of Medicine.
Testimony by Michael Linden before the Joint Economic Committee
Michael Linden
Senior Policy Fellow
Washington Center for Equitable Growth
Testimony before the Joint Economic Committee
Hearing on “The Fiscal Situation of the United States”
March 12, 2024
Introduction
Chair Heinrich, Vice Chair Schweikert, Members of the Committee, thank you so much for extending me the opportunity to testify before you today. My testimony will broadly cover three important aspects of today’s topic.
First, I will discuss how we might assess the economic risks posed by our current fiscal trajectory. Too often in our national discussion of federal fiscal policy, we skip over the critical first step of interrogating just what those risks actually are, how big they might be, and how certain we are of them coming to pass. Given the uncertainty surrounding the risks posed by rising debt, I argue that we should approach our fiscal future from a “risk management” standpoint.
Second, I’ll consider how to use “risk management” to evaluate policies designed to alter our fiscal trajectory. Not all risk reduction is created equal. We want to meaningfully reduce our future risks, without causing undue harm today.
Finally, I will turn to a brief discussion of how federal fiscal policy has changed over the past several decades, and how those changes have affected the fiscal outlook. To the extent that the current trajectory does carry real risks, it is valuable to understand what policies have contributed to exacerbating or mitigating those risks because that can help us identify which areas of the federal budget deserve the most attention.
It’s useful to begin where almost everyone agrees. Debt, as a percent of our economy, cannot rise forever without there eventually being some negative consequences. Many economists reasonably worry that an ever-increasing debt load could result in higher and higher interest rates, crowd out private investment and lead to slower economic growth, and could force us to spend a larger and larger share of our national resources paying off old debt, rather than investing for the future, among other plausible risks.
There is little to suggest that current levels of national debt are causing any of these potential harms, yet there is a real risk that any or all of these harms could come to pass in the future, as debt continues to rise. Reasonable projections, including those from the Congressional Budget Office, forecast a persistent mismatch between revenues and spending, which causes the debt to rise, as a percent of GDP, forever and ever. That is quite obviously a risky debt trajectory.
But how risky?
Surprisingly, that is a question without a clear answer. It is important to approach questions of our fiscal future with a degree of humility. Projections are inherently uncertain, fiscal risks have been overstated in the past, there are aspects of U.S. fiscal and economic policy that make it difficult to compare to other countries’ experiences. And, crucially, it turns out that there is remarkably little agreement on the magnitudes of the risks we face.
Take interest rates, for example. For decades, many economists believed and warned that higher debt would necessarily mean higher interest rates. And after all, that relationship should make sense. As a borrower takes on more debt, lenders perceive that borrower to be a riskier bet, and therefore demand a higher interest rate before they are willing to lend more.
But in fact, the observed relationship between publicly held debt and interest rates has been just the opposite. Interest rates on federal debt have actually fallen precipitously over the past four decades, even as debt has risen substantially. Today, of course, interest rates are, indeed, higher than they were two years ago, but they are still roughly equal to the rates of the early 2000s, when debt was roughly 65 percentage points of GDP lower than it is today.
Furthermore, interest rates today are much lower than they were in the 1980’s, when the debt was 70 percentage points of GDP lower than it is now. Moreover, most of the recent rise in interest rates occurred during fiscal year 2022, a year in which the debt actually fell slightly as a percent of GDP.
None of that should be taken to mean that interest rates will stay low forever or that the assumed relationship between debt and interest rates is actually the reverse of what economists once believed. But the past 45 years of history should teach us to be humble about our basic assumptions today.
Similarly, a traditional concern is that more government borrowing will “crowd out” private investment, as the federal government absorbs some of the credit that would otherwise have gone to private borrowers. This “crowding out” effect is then supposed to reduce national income over time as the country forgoes productive private investments in favor of less productive uses by the public sector.
As it turns out, the evidence for both the phenomenon itself and the underlying theory is quite mixed, to say the least. Some academic studies have found a significant crowding out effect. Others have found almost none.24 And some studies have even found that public investments have had a so-called “crowding-in” effect, whereby private investors follow the public sector’s lead and total investment goes up, not down.25
Once again, the lesson from the evidence is not that there are no potential harms from rising debt, but rather that higher debt creates risks. Those risks are of an uncertain magnitude, but that does not make them nonexistent.
Indeed, the most responsible course is to take a “risk management” approach to our long-term fiscal trajectory. Prudent and responsible governance means neither ignoring those risks, nor trying to eliminate them entirely. It means taking appropriate steps to mitigate risks and minimize them, without causing necessary harm now. After all, it would be a poor swap to trade the uncertainty of potential damage of unknown magnitude in the future for the certainty of major damage today.
That’s why it is important to consider both the benefits and the costs associated with any policy intervention designed to reduce fiscal risks. The more certain we are about those risks, the more the benefits will outweigh the costs, and vice versa. Today, as we sit here discussing these issues in this hearing, the risks are quite uncertain. This should make us cautious about taking drastic actions.
But even so, there likely are policies we could pursue over the near term for which the benefits from reducing fiscal risk—however uncertain—nevertheless outweigh the costs. Policies that promote and accelerate shared, broad-based economic growth, for example, are going to both help improve people’s lives and reduce fiscal risks in the future. We know that investments in early childhood education and in scientific research and technology development are going to pay enormous dividends, expanding our economy in ways that will benefit all Americans and simultaneously make it far easier to reduce the risk posed by increasing debt.26
Put another way, the best approach to reducing our debt-to-GDP ratio is by expanding GDP. And indeed, it is noteworthy that recent economic growth has produced exactly that result. The CBO’s projections of long-term debt, as a percent of GDP, have actually declined in each of the last four years, in part because CBO’s estimates of the size of the economy have increased.
The CBO’s most recent forecast put debt in 2050 at roughly 20 percentage points of GDP lower than its forecast in January 2020, before the pandemic. In response to the pandemic, the federal government spent more than $4 trillion, and yet debt projections today are better than they were before the pandemic largely because the CBO now believes the economy will be much bigger than it forecast it would be before the pandemic.27
Of course, the converse is also true and worth explicitly mentioning. Policies enacted in the name of fiscal risk reduction that slow or impede shared growth—either by cutting productive investments or by increasing inequality—are not only harmful on their own merits but are also likely to fail to achieve their stated goal.
Indeed, if we are to take a serious approach to fiscal risk management, we should start by understanding which policies have contributed to increasing fiscal risks in the past, and which have contributed to reducing them.
Simply put, the primary (if not sole) reason why current projections have the debt rising in perpetuity instead of falling is because of tax cuts. If not for the series of tax reductions enacted in 2001 and 2003 and then extended in 2010 and 2012, and then added to in 2017, the debt, as a percent of GDP, would be on a permanent downward trajectory.28
How do we know this? We know this because we can directly identify what fiscal policies have changed relative to the last time debt was projected to be stable or declining. That was in 2012, before the majority of the Bush tax cuts were permanently extended. In June of that year, the CBO released long-term projections that showed the debt declining forever. Without those tax cuts, which were slated to expire after 2012 (and obviously before the 2017 tax cuts) the tax code would have been able to generate sufficient revenues to fully finance the federal government’s spending commitments—even as those costs rose with an aging population—without having to take on debt faster than the economy grew.6 In other words, without the tax cuts enacted over the past several decades, there would be no fiscal risk from rising debt.
Put another way, we know that tax cuts are responsible for our riskier fiscal posture because spending projections today are lower, not higher, than what the CBO expected a decade ago. Let me repeat that. We will spend less over the next decade, as a percent of GDP, than what the CBO thought we would be spending the last time it forecast a permanently declining debt-to-GDP ratio. So if debt is now rising instead of falling, and spending is lower, the culprit has to be lower revenues.
And that’s exactly what we see. Take this very year as a good example. The CBO now expects the federal budget deficit in fiscal year 2024 to be about 4 points of GDP higher than what it expected it would be back in 2012. And yet, primary spending this year—that is spending aside from net interest payments—is almost exactly the same as what CBO projected. That’s right. The deficit is higher, but spending is the same. That means the entire reason why the deficit is higher today than what was expected a decade ago is because revenues are also about 4 percentage points of GDP lower, reflecting the extension of the Bush-era tax cuts at the end of 2012 and the enactment of the Trump tax cuts in 2017.
And it also must be noted that a disproportionate share of the reduced tax revenue has gone to very high-income households. Across all of the tax cuts enacted since 2001, close to half of the total benefit has gone to the richest 5 percent of households.7 For a household in the richest 1 percent, their combined tax cut from all the changes enacted since 2001 is roughly 45 times larger than the tax cut for a family in the middle income quintile.
Furthermore, a recent academic study found that 81 percent of the benefits from the 2017 corporate tax rate cut went to the top 10 percent of the income distribution.
Now, let me be very clear. Federal spending is indeed higher today than what it used to be in the late 1990’s and early 2000’s. But it has grown more slowly than expected. Some growth was always expected as the population ages and more Americans retire and rely on Social Security, Medicare and Medicaid. But the actual increase has been smaller than expected, not larger. We are spending less today on those three bedrock commitments to America’s seniors than what we thought we would have to spend two decades ago, or even a decade ago.
Healthcare spending growth in particular has slowed dramatically compared to what was predicted a dozen years ago. In its 2012 projection, the CBO expected that federal spending on Medicare, Medicaid and the Affordable Care Act would average 7.3 percentage points of GDP over the ten-year period from 2024 to 2033. Now, the CBO expects that spending to average just 5.9 percent of GDP. That difference of 1.4 percent of GDP is equivalent to $4.7 trillion in savings over the next decade.
Those trillions of dollars in savings from lower-than-expected healthcare spending will, however, be more than wiped out by trillions of dollars in lower tax revenues, the result of repeated tax cuts. Over the next 10 years, the CBO now expects the federal tax code to generate an average of 17.7 percent of GDP in revenue, and that assumes the expiring provisions of the 2017 tax cuts do, indeed expire or that any extensions are fully offset with new revenue. That is fully 4.5 percentage points of GDP lower than what the CBO projected the tax code would generate over that period had the Bush tax cuts not been extended. Those 4.5 points of GDP are equal to $15 trillion over the next 10 years.
So, we may be spending $5 trillion less on healthcare than expected over the next decade, but we’re also essentially “spending” $15 trillion more on tax cuts, roughly half of which is going to the richest 5 percent of households. And that is why the debt is on an upward trajectory, rather than downward.
When I look at that debt trajectory, I see risk. The magnitude of that risk is uncertain, yes, and that should make us cautious about taking drastic actions. But by employing a “risk management” approach we can see that there are prudent steps we can take now without causing unnecessary harm, such as investing in ways that we know support shared growth and prosperity. And we can certainly begin to reverse the revenue losses that are the primary contributor to our fiscal risks by asking the wealthy and corporations to pay more in taxes.
Thank you, and I look forward to taking your questions.
Equitable Growth hosts State of the Union press briefing with leading U.S. economists

The Washington Center for Equitable Growth last week hosted an online press briefing in prelude to tonight’s State of the Union address to the U.S. Congress by President Joe Biden. The briefing—attended by journalists from leading news organizations, including The Associated Press, The Atlantic, The Economist, and CNN—took a deep dive into recent economic indicators and timely research, the Biden administration’s economic policy agenda, and what’s ahead for the U.S. economy amid current congressional debates over enacting a federal budget this month and in the run up to the presidential and congressional elections in November.
The webinar featured three leading U.S. economists: Alan Blinder, the Gordon S. Rentschler Memorial Professor of Economics and Public Affairs at Princeton University and a founding member of Equitable Growth’s Steering Committee; David Autor, the Ford Professor in the Department of Economics at the Massachusetts Institute of Technology and a new member of Equitable Growth’s Research Advisory Board; and Lenore Palladino, an assistant professor in the Department of Economics and the School of Public Policy at the University of Massachusetts Amherst. The briefing was moderated by Michael Linden, a senior policy fellow at Equitable Growth and former executive associate director of the White House Office of Management and Budget in the Biden administration.
Linden set the stage for the audience and the three panelists with a brief run through of some telling economic data. He noted that in many respects, 2023 was a remarkable year for the U.S. economy, with overall real Gross Domestic Product up 3.1 percent over 2022 and with that strong growth powered by an extremely resilient and robust U.S. labor market, characterized by low unemployment, continued job creation, and solid real wage growth after accounting for inflation.
Linden said many observers were surprised by the good economic news in 2023 and now had many questions about the U.S. economy going forward. He pointed out that as the 2024 election approaches, there will be an extremely consequential national debate about the future of economic policies at both the executive and legislative levels. He then proceeded to drill down into some of those debates with Blinder, Autor, and Palladino. The four of them and audience participants discussed:
- The sudden and surprising decline in wage inequality after the sharp but brief COVID-19 recession in 2020 and subsequent economic recovery over the past 3.5 years
- The lessons policymakers can take from these years of economic progress, exemplified by the soft landing of the U.S. economy
- The strong productivity growth in 2023 and why it is so important for the overall U.S. economy going forward
- The Biden administration’s approach to industrial policy and why it is working for the U.S. economy and paying off for the broad majority of Americans
- The importance of the care economy, including child care, early childhood education, long-term care, and paid family and medical leave, to strong and sustained economic growth
- The new challenge of artificial intelligence to U.S. economic growth and stability, and whether AI can play a role in decreasing income inequality to ensure U.S. workers come out ahead
These and other topics were tackled in lively discussion and Q&A session, with the participants expressing their interest in contributing to further public engagement about inequality and U.S. economic growth and stability.
For more information, please contact Equitable Growth Communications Manager Katie Wilcoxson at kwilcoxson@equitablegrowth.org.
The state of the U.S. labor market 4 years after the start of the COVID-19 recession

Over the past 4 years, the U.S. economy—in particular the U.S. labor market—weathered some incredible shocks and fluctuations. From the COVID-19 pandemic and supply chain breakdowns to global energy shocks and massive shifts in consumer behavior, U.S. workers have been through a lot. This month, 4 years on from the start of the pandemic in the United States, it is valuable to take stock of what the U.S. labor market has been through and where it currently stands.
Given the incredible challenges of the past several years, it is, in many ways, remarkable to report that the livelihoods of U.S. workers are very strong—and in fact, it is even possible to argue that the U.S. labor market is the strongest it has ever been. Of course, this does not mean there is no additional progress to be made or that every single worker in the United States has seen their circumstances improve. But it does mean that, in general, the U.S. labor market is currently delivering very concrete and measurable gains for most workers.
This column looks at several indicators, from the unemployment rate to wages and worker power to productivity, to assess and bolster this claim. Taken together, the data on these indicators show how strong the economy is for U.S. workers on the eve of President Joe Biden’s 2024 State of the Union address on March 7.
Unemployment
The overall unemployment rate is a good place to begin. Fundamentally, when joblessness is low, it means that U.S. workers can find jobs relatively easily, they can find better jobs if and when they want to, and they have leverage in their relationships with their employers, leading to higher wages and better working conditions. Today, all of those things are true.
U.S. workers are currently enjoying extremely low levels of unemployment. While the overall unemployment rate spiked to 14.8 percent in April 2020 before falling rapidly to 6.8 percent by the fall of 2020, progress then slowed, with unemployment falling just 1 percentage point over the next 8 months. Then, starting in the spring of 2021, the rate began to drop more quickly and reached 4 percent by the end of 2021—and has been at or below 4 percent for 26 straight months, the longest sustained, continuous stretch of 4 percent unemployment since the late 1960s.
Furthermore, over those 26 months, the unemployment rate has averaged 3.6 percent. That is a slight improvement, compared to the 26 months prior to the start of the pandemic, when the unemployment rate averaged 3.8 percent.
To put that in perspective, it took 8.5 years for the unemployment rate to drop below 4 percent after the end of the Great Recession in 2009. Yet after the COVID-19 recession of 2020, it took less than 2 years to accomplish the same feat.
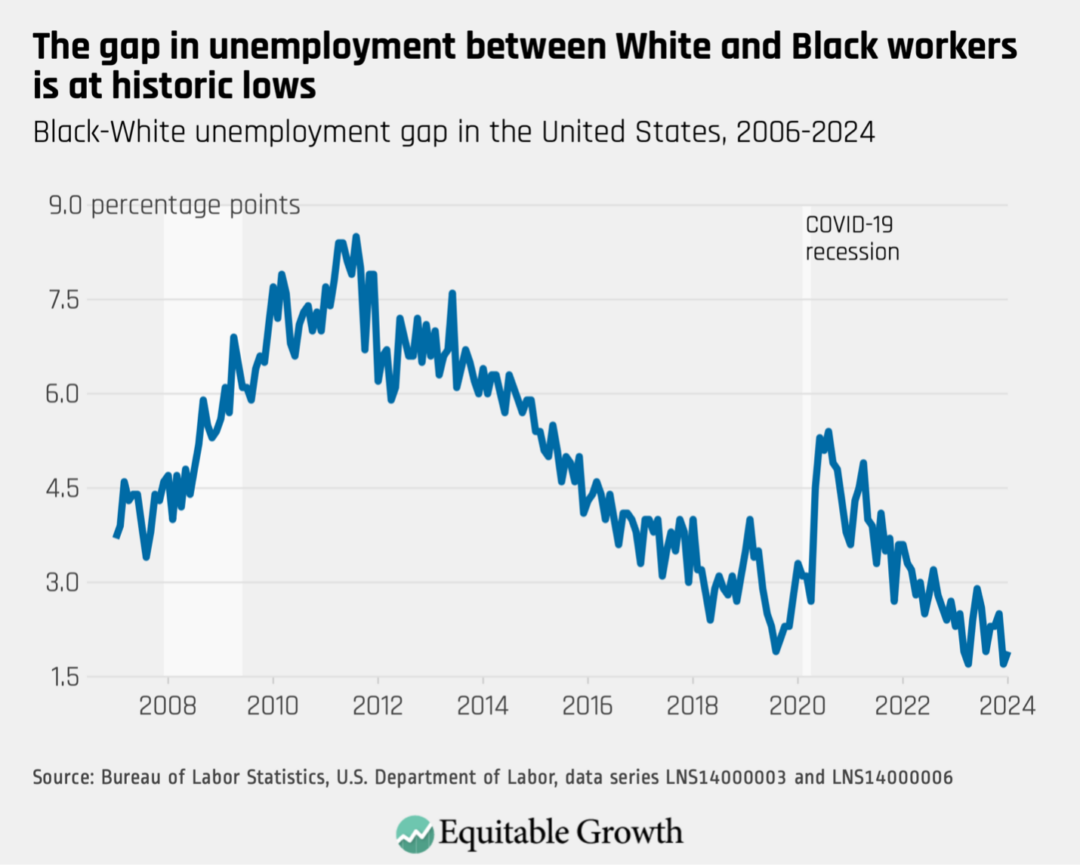
Sometimes, however, low overall unemployment can mask important variations across demographic groups. In 2000, for example, when the overall unemployment rate averaged 4 percent, the unemployment rate for Black workers was almost double that, averaging 7.6 percent.
Today, the unemployment rate for Black workers in the United States is 5.3 percent. That’s still higher than the overall unemployment rate of 3.7 percent, but the difference between the unemployment rate for White workers and Black workers is, today, at the lowest level it has ever been. (See Figure 1.)
Figure 1
Similarly, when the labor market is weak, younger workers often bear the brunt of that weakness. More than 3 years into the recovery from the Great Recession of 2007–2009, for example, the youngest workers, those aged 20 to 24, still faced an unemployment rate of more than 13 percent—fully 6 points higher than the overall unemployment rate. Meanwhile, four years into the COVID-19 economic recovery, the unemployment rate for young workers is less than 6 percent—only about 2 points higher than the overall rate.
Workers also are less likely to experience a long bout of unemployment today than they were at a similar point in the previous economic recovery after the Great Recession. Today, about 1 in 5 unemployed workers has been out of work for more than 27 weeks, the same rate as immediately prior to the pandemic. In 2012, however, more than 1 in 3 unemployed workers had been out of work for that long or longer. Despite this clear improvement, this is one area where there is still some room to do better for U.S. workers: In the late 1990s, only 1 in 10 unemployed workers faced long-term unemployment.
Labor force engagement
Because the unemployment rate measures those out of work but looking for a job, it is possible for the unemployment rate to decline not because jobs are available, but because discontented and discouraged workers simply stop looking for work. Therefore, another important indicator of the overall health of the labor market is how many potential workers are actually attached to the labor market—employed or actively seeking out work if they are not currently employed.
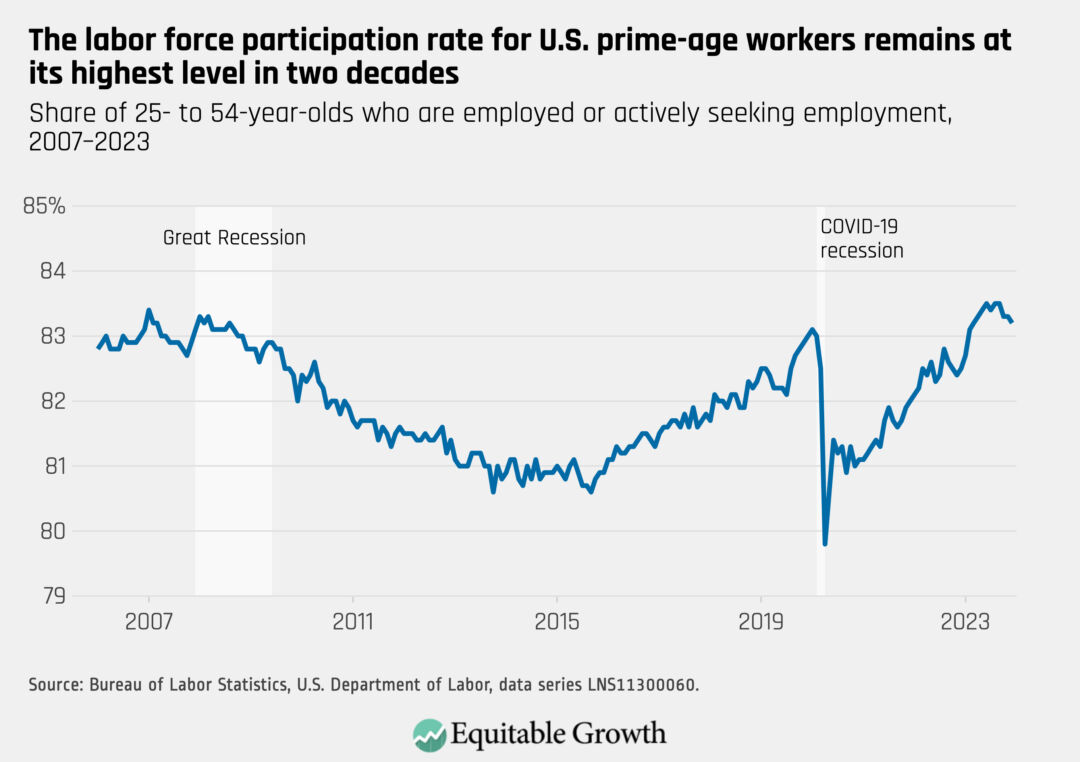
By most measures, today, the overall size of the U.S. labor force and the share of potential workers who are working has fully recovered from the COVID-19 pandemic—and, in fact, has now fully recovered from the Great Recession as well. As of January 2024, 83.3 percent of 25- to 54-year-olds were attached to the labor force, whether employed or actively looking for work. That’s up nearly 2 full percentage points from 2020. It also exceeds the average rate in 2019 by almost 1 percentage point. In fact, the so-called “prime age” labor force participation rate hasn’t been this high since the year 2000, when it averaged 84 percent. (See Figure 2.)
Figure 2
Over the course of 2023, roughly 72 percent of all people aged 16 to 64, whether in the labor force or not, were employed. That was the highest annual average employment share in 15 years. Only in the late 1990’s did the employment-to-population ratio exceed 2023’s.
Coming out of the pandemic, there was a concern that women in particular would encounter barriers to reentering the workforce in a soft labor market. Women workers bore a disproportionate brunt of the damage from the pandemic-induced recession, with the service sector—where women are overrepresented—particularly hard hit and many working mothers leaving the labor force to care for their children in the wake of school and daycare closures. Indeed, the unemployment rate among women went from being slightly below the unemployment rate for men before the COVID-19 pandemic to being 2.5 points above it in the spring of 2020.
Yet today, according to the U.S. Bureau of Labor Statistics, more than 77 percent of women between the ages of 25 and 54 are back in the labor force. That’s actually higher than it was in 2019, when the average labor force participation rate among women in that age group was 76 percent. Moreover, more than 75 percent of all women ages 25 to 54 are currently employed, which is an all-time high.
Wages
With low unemployment and high labor force attachment, we would expect to see robust wage growth for workers. That’s because in strong labor markets, workers have the leverage to demand higher wages from their current employers or to switch to jobs that better reward their efforts with higher wages. And in 2023, that’s exactly what we saw.
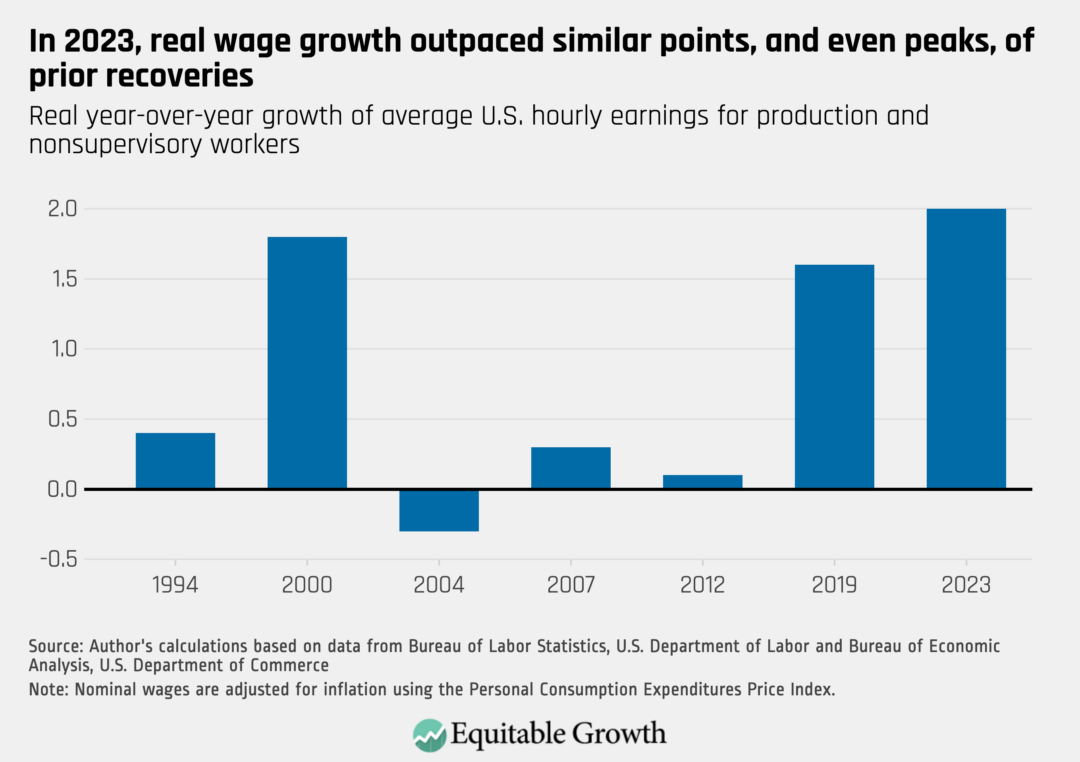
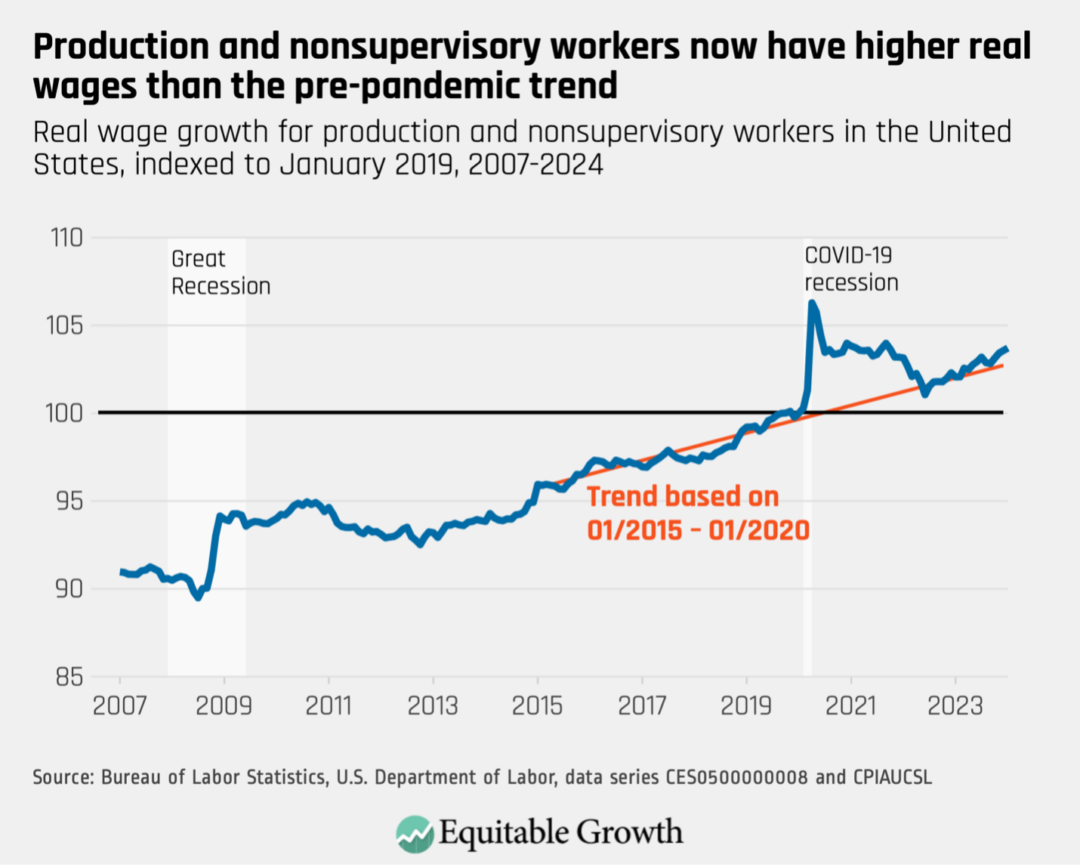
By the end of 2023, the average hourly wage for production and nonsupervisory workers was 2 percent higher than it had been in 2022, after adjusting for inflation—far stronger wage growth than at this point in previous economic recoveries. In fact, 2023 was a stronger year for real wage growth than 2007, 2019, or even 2000—all of which were the peaks of their respective economic expansions. (See Figure 3.)
Figure 3
Additionally, the Federal Reserve of Atlanta—which measures wage growth on an individual basis year over year—reports that overall real wage growth in the United States for 2023 was 3.1 percent. That’s significantly higher than it was prior to the COVID-19 pandemic, when it was around 2.1 percent.
Furthermore, according to economists Arindrajit Dube of the University of Massachusetts Amherst, David Autor of the Massachusetts Institute of Technology, and Annie McGrew of UMass Amherst, workers at the bottom and in the middle of the U.S. income distribution enjoyed the highest wage growth in 2023. Dube and his co-authors find that wages grew for workers in the middle quintile by nearly 4 percent over the course of 2023 (adjusted for inflation), whereas in 2019, the median inflation-adjusted wage grew by just 1 percent over the prior year. grew by just 1 percent over the prior year.
Workers at the bottom of the U.S. income distribution are also faring better in this recovery. The Economic Policy Institute finds that the share of the total workforce now working for less than $15 an hour has declined to just 11 percent. That’s the lowest level since the think tank began tracking this metric. In 2019, about 20 percent of all workers earned less than what $15 an hour would be today.
Worker power
Beyond the availability of jobs and even the wages of those jobs, it’s also important to consider how much power workers have. In weak labor markets, workers feel trapped in their jobs, are unable (and often unwilling) to bargain for better wages or improved working conditions, and have little leverage to advocate on their own behalf. Yet today, it is clear that the power has shifted toward employees in a number of measurable ways.
For one thing, in 2023, U.S. workers felt more comfortable voluntarily leaving their current jobs than they have in the past—a sign they felt confident they could transition to a better job situation. The share of workers who quit their jobs hit an all-time high in 2022 at 3 percent, and while the rate declined in 2023, it still remained higher than the quits rate immediately prior to the pandemic. Indeed, the rate of workers choosing to leave their jobs was higher in 2023 than it was at the peak of the past three economic expansions.
U.S. workers also felt more comfortable taking direct action to improve their working conditions. In 2023, there were 35 major strikes (work stoppages involving more than 1,000 workers) across U.S. industries, affecting 16,700 total days of work. Both of those measures were the highest in more than two decades. Major strike activity in 2023 involved 460,000 U.S. workers, the second-highest number of workers involved in a major strike since 1983. Work stoppages are still far below the levels that were common prior to 1980, but 2023 was a marked departure from the last several decades.
Despite the significant increase in strike activity, however, the overall unionization rate in the United States declined slightly in 2023. The number of workers in unions grew year-over-year but not enough to keep up with the overall growth in employment. That said, there were 410,000 more union members in 2023 than in 2021, making 2022 and 2023 the second-best two-year period for union member growth since at least the early 1980s.
Productivity
U.S. workers face low levels of unemployment, can find jobs relatively quickly when they do become unemployed or choose to seek better opportunities, and are earning higher wages because of the leverage these conditions deliver to them. This is also the set of circumstances that typically leads to higher worker productivity. Workers can do more with the same amount of time and resources when they are well-compensated for their time, when employers have to compete for workers, and when employers invest in their current workforce. And indeed, 2023 saw the beginnings of what could turn into a productivity boom.
Over the course of 2023, productivity—the total amount of output produced per worker—grew at an annual average rate of 2.7 percent. That was the fourth-best year for productivity growth since 2000 (excluding recession years) and a dramatic improvement over the equivalent points in prior recoveries. In 2012, for example, productivity was essentially flat.
It’s even possible that the good news in 2023 is hiding even better news. While the overall annual average productivity growth in 2023 was 2.7 percent, the average annualized growth rate over the last three quarters of 2023 was a whopping 3.9 percent. An annual rate of 3.9 percent productivity growth would make 2023 the second-best year for productivity growth since the turn of the 21st century, and exceeding productivity growth in 2019.
Conclusion
All of the numbers detailed in the above sections point to one inescapable conclusion: The state of things for U.S. workers right now is very strong.
Next month will mark 4 years since 20 million workers lost their jobs in a single month—by far the worst and most sudden collapse in the U.S. labor market since World War II. Based on the outcomes of the most recent recessions and recoveries, workers had little reason to be optimistic that they would be able to recover quickly, and even less reason to hope that they could come out of the COVID-19 recession stronger than they were before. But, by most metrics, that’s exactly what happened.
Of course, the gains of 2023 did not wipe out the many years of slow wage growth or poor job quality that so many Americans experienced during prior decades. Nor did it fully close the racial and gender gaps that persist in the U.S. labor market or fully reverse the pernicious rise in income inequality that has hampered the U.S. economy since 1980.
Even so, there are now more jobs and higher wages for workers than at almost any point in recent history. There are more people working, and more people leveraging their newfound power in the workplace. These gains are flowing especially to lower-wage workers, to workers of color, and to younger workers—groups that have so often been left out of previous economic recoveries. And the broader impact is that workers could be on the verge of an historic boom in productivity.
The bottom line is this—when policymakers enact laws and regulations designed to empower workers and foster and protect strong labor markets, then U.S. workers can enjoy more years like 2023, in which they made real progress toward an economy that delivers robust growth and shared prosperity.
Ahead of President Biden’s State of the Union address, the U.S. economy is strong

On March 7, President Joe Biden will deliver the 2024 State of the Union address to the U.S. Congress and the American public, in which he will tout his economic and other policy achievements. This charticle preemptively assesses the state of the U.S. economy by looking at some of the key indicators of aggregate economic health. Overall, the data suggest that the U.S. economy is strong and poised to continue growing.
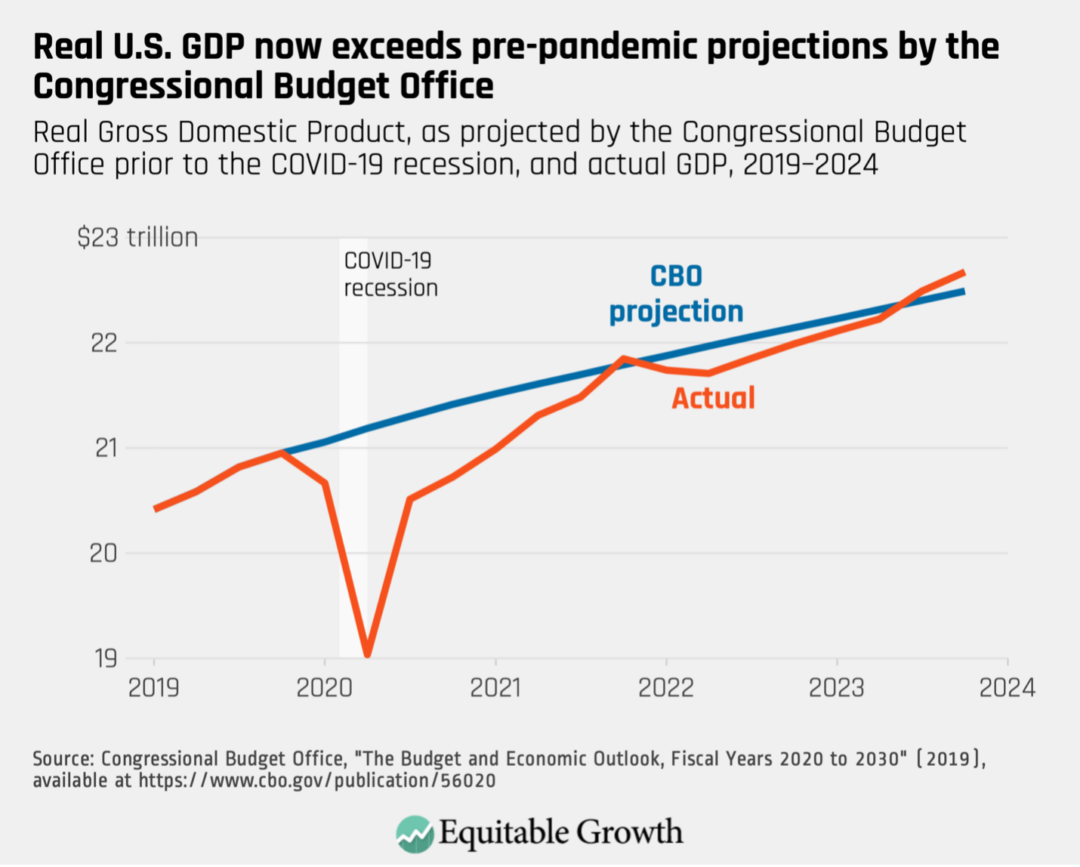
First, let’s look at scarring, or the permanent damage to the economy caused by recessions. The economic recovery from the COVID-19 pandemic has been rocky at times, but 3.5 years after the official end of the recession, the U.S. economy accomplished a remarkable feat: It completely avoided scarring (which economists also call hysteresis).
By contrast, the Great Recession of 2007–2009 caused lasting damage to the U.S. economy. Figure 1 shows how the U.S. economy contracted to well below levels forecasted by the Congressional Budget Office before the recession and stayed depressed for the length of the recovery. (See Figure 1.)
Figure 1
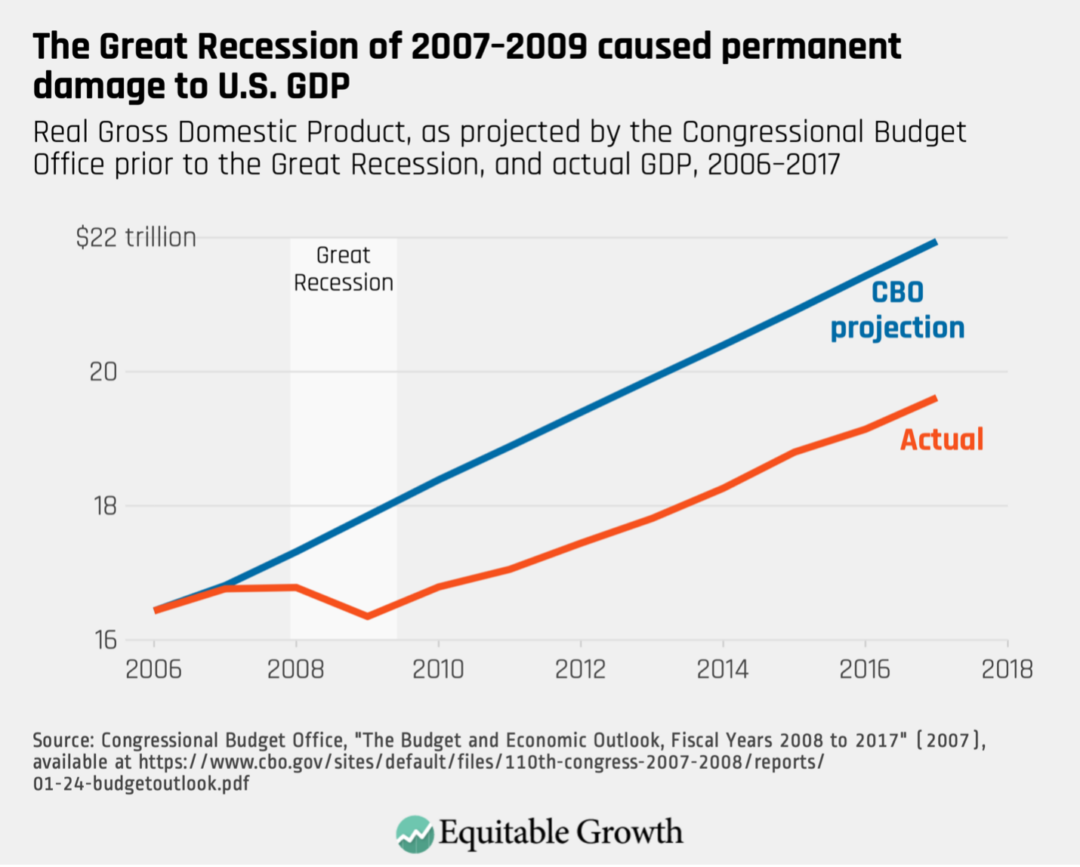
Meanwhile, the post-pandemic U.S. economy has now caught up to—and exceeded—CBO projections of Gross Domestic Product from before the COVID-19 recession. (See Figure 2.)
Figure 2
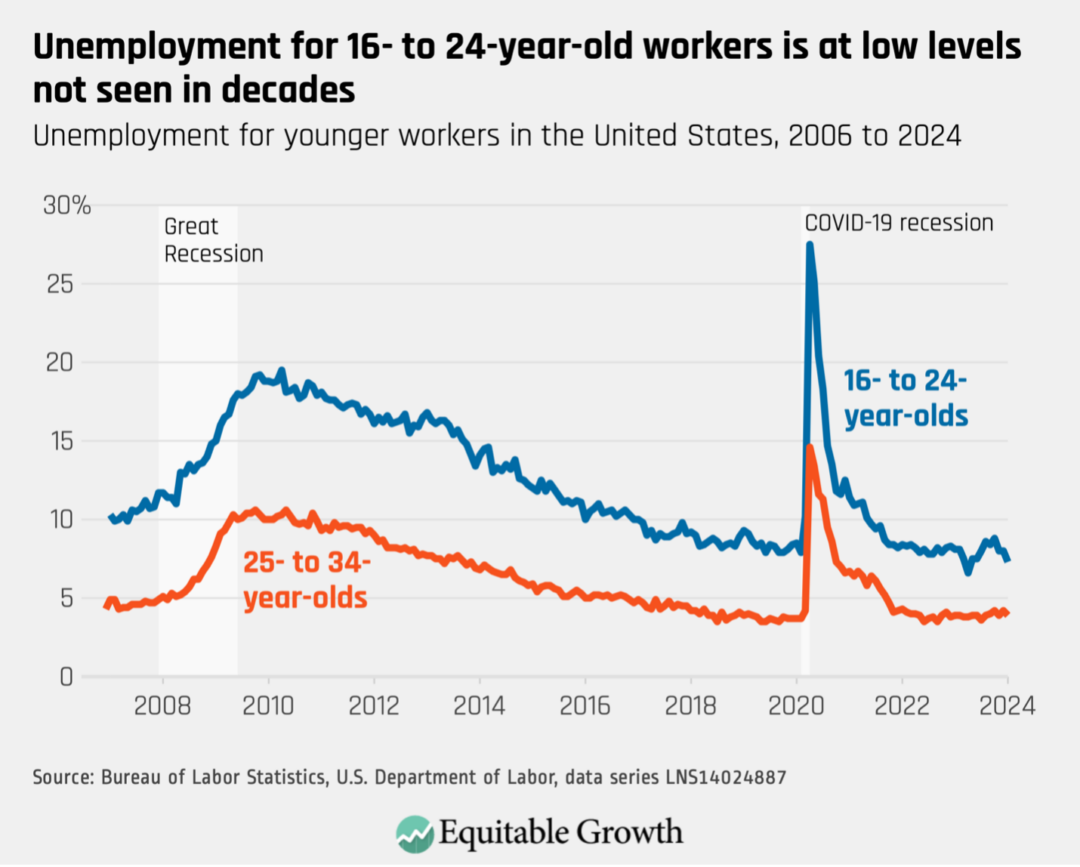
Scarring can be particularly harmful for young workers who are looking for employment for the first time. Research shows that these workers face long-lasting negative impacts from graduating into a poor labor market. Even 10 years later, these workers have lower wages, higher chances of unemployment, and worse health outcomes than their peers. So, it’s especially encouraging that young U.S. workers have fared well in the post-pandemic economic recovery: Unemployment for 16- to 24-year-olds is at its lowest level in decades. (See Figure 3.)
Figure 3
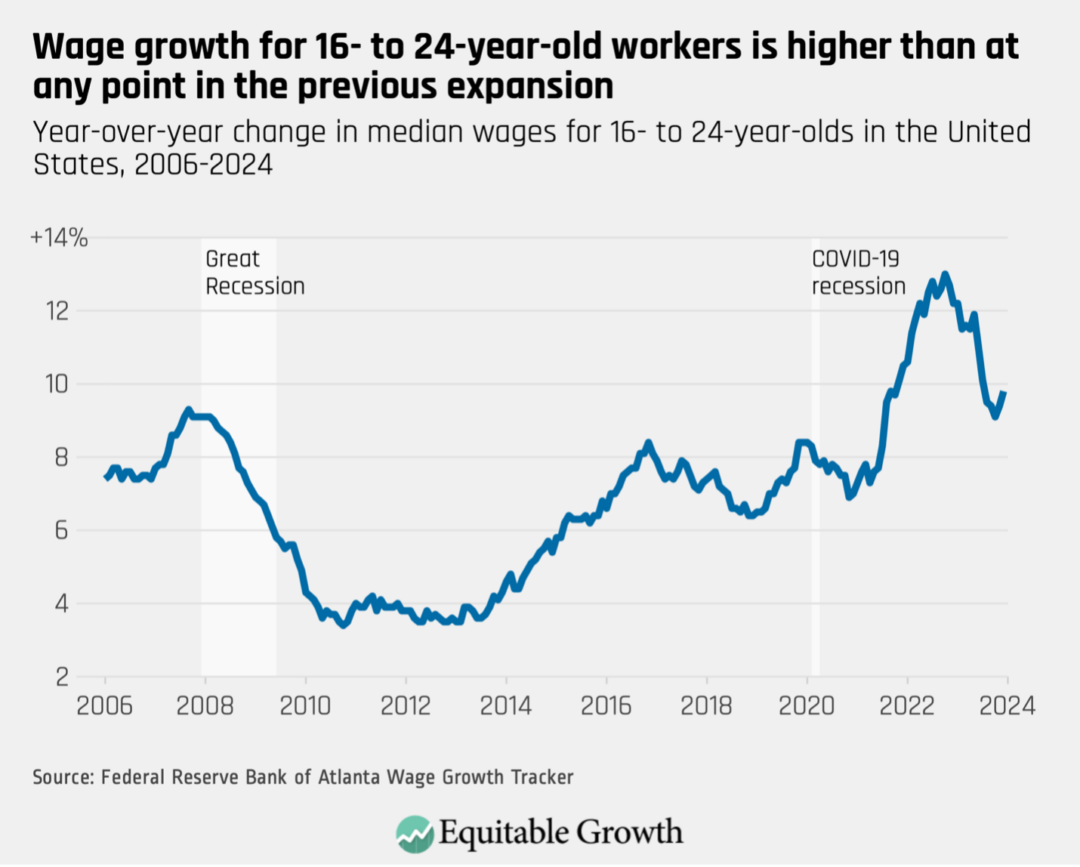
Moreover, the Atlanta Federal Reserve finds that these same workers saw significant wage increases after the pandemic. Strong wage growth for these workers suggests they have avoided the labor market scarring that usually impacts young workers after a recession. (See Figure 4.)
Figure 4
These wage gains are primarily attributable to a tight U.S. labor market that has pulled more workers into the labor market. Prime-age women’s labor force participation rates are at historic highs, for example. Additionally, the gap in unemployment between White and Black workers is at its lowest point since both rates have been measured. (See Figure 5.)
Figure 5
Much of this success can be attributed to the strength of consumption in the U.S. economy. Thanks in large part to aggressive fiscal policy during the pandemic, Americans emerged from lockdown with money to spend—and they are spending it. Consumption should remain strong as wage growth is now outpacing inflation for most workers. (See Figure 6.)
Figure 6
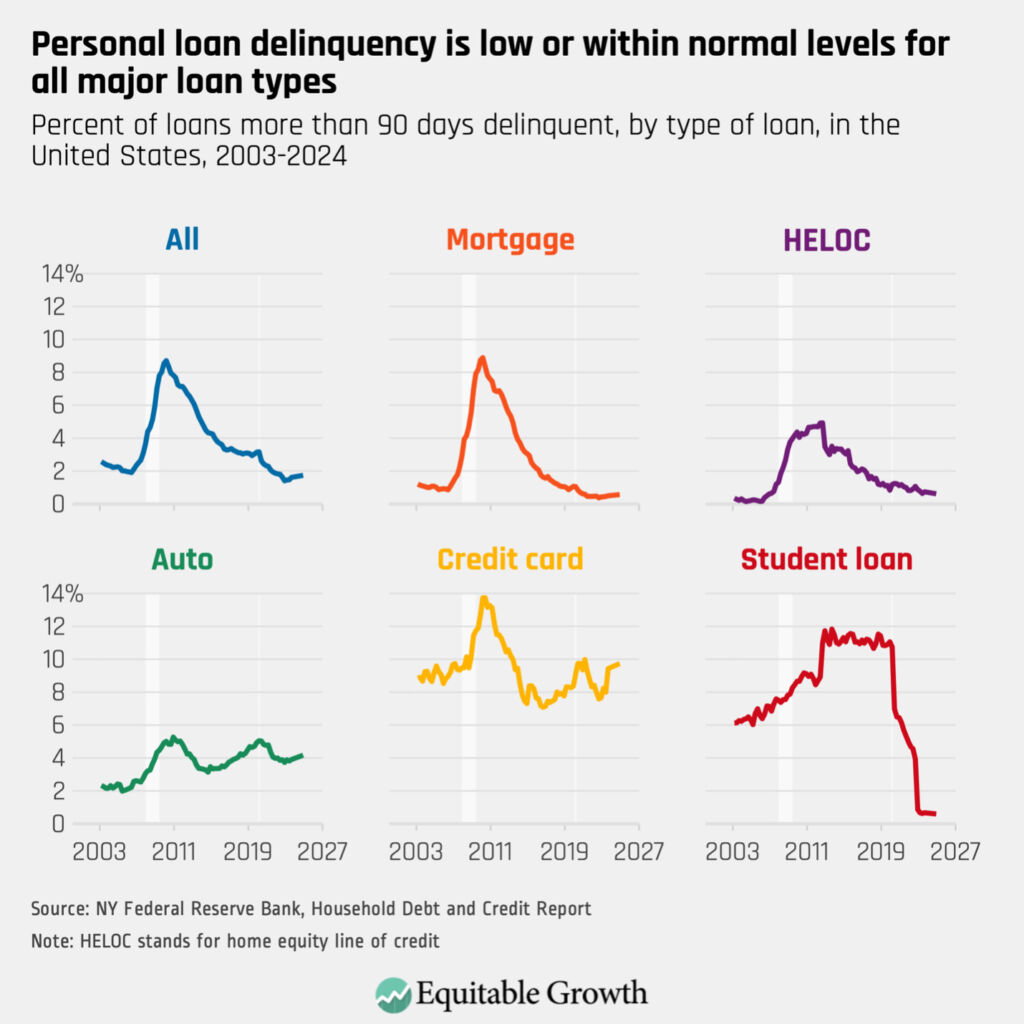
According to the New York Federal Reserve, consumer debt also remains low by historical standards. Although credit card delinquency has crept up lately, it is within normal levels historically, and delinquencies for other types of debt are at extremely low levels. (See Figure 7.)
Figure 7
Taken together, the aggregate data paints the picture of a strong economy, with relatively few threats on the horizon. After months of erroneous recession speculation over the past couple of years, the indicators clearly show that the state of the U.S. economy is strong.
Equitable Growth’s recent ‘Econ 101’ assessed the state of the U.S. economy and recovery for Capitol Hill staff

The Washington Center for Equitable Growth hosted a briefing last week—part of a series we call “Econ 101”—presenting insight on the state of the U.S. economy and how the current recovery from the COVID-19 recession compares both to recoveries in other countries and to U.S. recoveries from previous recessions. The briefing also delved into the possible medium- and long-term consequences for the U.S. economy stemming from the recent recession and recovery.
This “Econ 101,” presented by Equitable Growth Senior Fellows Austin Clemens and Michael Linden, came at a pivotal moment as many policymakers struggle to make sense of current economic conditions and draw useful lessons for future economic policy. The state of the economy can be difficult to interpret, as evidenced by the fact that so many economic observers mistakenly predicted a recession throughout 2023. Making matters even more murky is the seeming disconnect between the public’s economic sentiment and the traditional data we use to measure economic performance.
Clemens and Linden guided congressional staffers from both the U.S. House of Representatives and the U.S. Senate through the thicket of data and competing narratives to help shed some light on the economy’s underlying strengths and weaknesses. The briefing touched on overall growth and key elements of the labor market—including how the U.S. labor market is delivering for women and people of color—as well as other important metrics such as wealth and income inequality. Most of these metrics point to an economy and a labor market that is performing remarkably well, especially for low- and moderate-wage workers in the United States.
Clemens also discussed what the economic evidence tells us about the long-term effects of deep economic downturns, why it’s so important to protect workers and their families from those long-term effects, and what lessons we might draw from the U.S. response to the COVID-19 recession.
Economic policies can have dramatic and persistent consequences for millions of people, especially in response to recessions and other economic crises. Making good choices starts from having a good understanding of what’s happening in the economy right now and how we got here. Equitable Growth’s recent “Econ 101” provided an evidence-based approach for grappling with today’s most consequential economic debates.
Review the presentation slides from the February 6 congressional briefing to learn more.
Closing the billionaire borrowing loophole would strengthen the progressivity of the U.S. tax code

Overview
The vast majority of Americans are concerned that some wealthy people don’t pay their “fair share” of federal taxes. They’re right to be bothered: Loopholes in the U.S. tax code allow some billionaires to pay taxes equal to only 1 percent of the increases in their wealth, which tax textbooks across the country consider “income.”
How is this possible? The low effective tax rate arises in part because U.S. billionaires with large stock portfolios and other appreciated assets can borrow money using their considerable financial assets as collateral and then pay little to no taxes on the cash they use to finance their lifestyles. Some of the wealthiest people in the United States take advantage of this loophole, including Larry Ellison and Elon Musk. Without borrowing, they would have to sell more of their appreciated assets, “realizing” these gains and thus triggering income taxes.
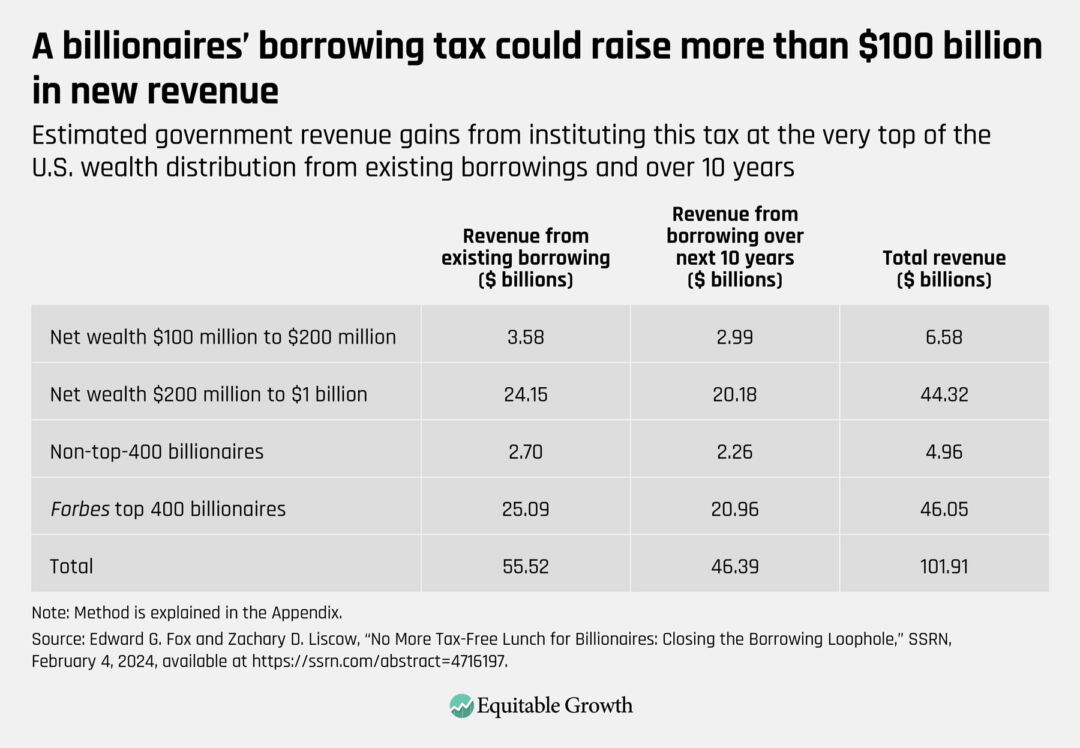
Indeed, Americans with more than $100 million of wealth were recently estimated to hold $8.5 trillion in unrealized capital gains. According to that analysis, these 64,000 households hold as many unrealized gains as does 84 percent of the population, or 110 million households. Closing this billionaire borrowing loophole could raise more than $100 billion over 10 years in a highly progressive and reasonably efficient way.
These are among the findings in our new paper, “No More Tax-Free Lunch for Billionaires: Closing the Borrowing Loophole,” in which we suggest a simple way to close the loophole (and from which this piece is adapted). We propose that the borrowing of those billionaires and centi-millionaires be taxed as realizing income. This new revenue is not only sorely needed from the top 0.05 percent of households, but is fairly owed by them under the progressive principles of our federal tax system.
What’s more, there is an important upcoming window to close this gaping tax loophole. Some of the federal budget-busting provisions in the Tax Cuts and Jobs Act of 2017 will expire in 2025. This would be a good time for federal policymakers to act to restore some fiscal discipline by fixing this part of the U.S. tax code.
This issue brief will quickly detail how taxes levied on U.S. households with net assets of more than $100 million would close this loophole, what the timeframe for levying the tax on borrowed income would be, and how compliance with this change in the federal tax code could be enforced. We will then briefly summarize the economic benefits of enacting this kind of tax reform and demonstrate why possible legal and fiscal arguments against this proposed reform are off the mark.
The design features of our proposed tax on billionaires’ borrowed income are workable ways to address these possible challenges. As policymakers in the Biden administration and the U.S. Congress confront the serious federal budget challenges ahead—after decades of high wealth inequality in the United States—our paper presents a new option to raise revenue fairly and efficiently.
How to close the billionaire borrowing loophole
Let’s begin with some basic illustrative numbers to show how the tax would work. Suppose, for simplicity’s sake, that a billionaire holds all his wealth in the shares of a single Big Tech company. Let’s also suppose that the billionaire originally paid $1 billion for his earliest-purchased stock, but those shares are now worth $10 billion. In other words, among those shares, 90 percent of the value is gains on that stock that have not been taxed because they have not yet been sold. (Under the U.S. tax code, taxes typically accrue only upon “realization” events such as selling stock.) Now suppose that the billionaire borrows $10 billion, which he is only able to do because the banks know he has the (appreciated) assets to repay. We propose that this billionaire pay income tax on his borrowing. The tax would apply to borrowing regardless of whether the billionaire explicitly pledged some assets as collateral or not.
The tax would be easily calculated. Under our proposal, that $10 billion of cash—which is at least implicitly secured by the billionaire’s stock ownership—would be realized and thus become taxable. When income is realized, the tax code subtracts the “basis,” or the amount that the owner paid for the asset and has already paid tax on. We propose using the taxpayer’s basis in his oldest assets, so that taxpayers don’t avoid taxes by selectively pledging their highest-basis assets to borrow and avoid tax. Imposing this “first in first out” assumption for borrowing would considerably lower compliance costs because it requires only valuing the portion of assets whose total value equals the borrowing.
In our example, the oldest tranche of stock purchased by the billionaire for $1 billion is now worth $10 billion. So he would get a basis offset of $1 billion and pay income tax on $9 billion of gains when he borrows $10 billion. In return, when the billionaire sells his stock, he would pay less income tax. That $9 billion of income that is taxed is added to the basis of his oldest stock, making its basis $10 billion. Going forward, should the billionaire borrow additional amounts, then his basis offset is calculated based on his oldest assets not yet revalued under this new borrowing tax.
We would apply this tax, which we detail in our paper and summarize below, to borrowing for any purpose (including mortgages) by U.S. households with assets more than $100 million. The tax would be phased in for households with $100 million to $200 million in assets, with each increase of $1 million of assets beyond $100 million corresponding to a 1 percentage point increase in the share of borrowing covered by the tax. The tax would apply to all future borrowing, as well as borrowing currently on the books. For the tax on existing borrowing, taxpayers would have 5 years to pay, with the ability to pay in five equal installments.
To reduce compliance and administrative costs, the tax on existing borrowing would exempt households with less than $1 million of borrowing. There would also be a yearly de minimis threshold, under which households could borrow without triggering the tax, of $200,000. We selected this threshold to minimize avoidance opportunities while also avoiding costly revaluations of taxpayers’ assets. We further reduce compliance costs by only considering the basis of easier-to-value “major assets,” like stocks and large businesses, rather than homes and art.
To administer the tax, taxpayers covered by the new borrowing tax would report their borrowing in the same way that those with mortgage interest report their borrowing today. Third-party reporting from banks on their lending could back this up, but audits could be sufficient. Everything else in the tax system stays the same. In future years, taxpayers are taxed on increases in net borrowing versus the amount already taxed.
The fiscal reach of closing this loophole
We estimate that U.S. individuals covered by this new tax will have borrowed about $260 billion as of April 2024. This borrowing is explicitly or implicitly backed by assets, whose value we estimate is roughly 55 percent from unrealized gains. Put differently, ultra-wealthy Americans have likely accessed roughly $140 billion of their gains via borrowing, and therefore without paying any income tax. The proposal would tax this use of unsold gains as current income.
Under the tax rates proposed by the Biden administration, this new tax would raise about $56 billion in income tax from existing borrowing. We estimate that new borrowing over the decade following enactment of the tax would generate an additional $46 billion of income taxes on new borrowing using those same tax rates. (See Table 1.)
Table 1
This static “budget score” does not incorporate some behavioral effects, such as the chance that high-net-worth taxpayers could sell high-basis assets rather than borrow in response to the new tax. That said, the presence of substantial borrowing now, despite the interest costs of borrowing, suggests that there is not a superabundance of high-basis assets to sell.
There are three important fiscal components of our new borrowing tax that are worth emphasizing:
- A majority of the revenue comes from existing borrowing, so a proposal that was just forward-looking would raise far less.
- Our estimate for revenue over the next decade is more speculative, and possibly more upward-biased, than our estimate on existing borrowing because it is possible to avoid taxes on future behavior but not past behavior.
- Exactly half of the estimated revenue comes from billionaires, and 90 percent of that is from the richest 400 individuals in the United States. This makes the tax sensitive to the activity of a very small number of individuals.
The economic benefits of closing this tax loophole
Our proposed billionaire borrowing tax would raise considerable revenue in an equitable and relatively economically efficient way. Specifically, it would:
- Eliminate the tax bias favoring borrowing against assets instead of selling appreciated assets, thereby reducing wasteful tax planning. This tax bias has helped to build up a huge business in which the wealth management divisions of large banks lend to wealthy clients against their securities portfolios. In our paper, we document more than $175 billion worth of these loans as of the second quarter of 2023. Eliminating this bias for individuals covered by the new borrowing tax would eliminate many economically wasteful transactions whose primary purpose is tax avoidance.
- Reduce the tax bias favoring assets that do not regularly produce realized income. The U.S. tax code currently strongly incentivizes owning assets such as growth stocks or land that do not regularly produce realized income over owning assets such as bonds or stocks that pay a regular dividend—even if all the assets have the same risk and produce the same pre-tax return. Part of the reason that high-net-worth taxpayers prefer assets that do not regularly produce realized income is that, under current tax law, taxpayers can access some or all of the unsold gains on their assets by borrowing without triggering income tax. By eliminating this bias, billionaires will be less likely to choose assets with lower pre-tax returns simply because of their tax advantages, likely improving economic outcomes.
- Equalize the tax treatment of income used to fund consumption. Ordinary Americans are typically able to consume only after they pay income tax on their income, which comes primarily in the form of wages. Even when they borrow, they must repay with after-tax dollars. In contrast, the current treatment of borrowing allows wealthy Americans to consume their income without paying taxes on it. Moreover, wealthy Americans may never pay income tax on that appreciation—despite having used it to fund consumption—if they hold their assets until death, at which point the basis is “stepped up” for heirs. Our borrowing tax would equalize the taxation of consumed income for rich and ordinary Americans.
- Minimize distortion in the U.S. tax code by taxing existing borrowing. Importantly, much of the revenue (55 percent) would be raised from funds that have already been borrowed, reducing any potential distortion, because taxing an action that has already happened cannot directly cause any distortion.
Why arguments against closing this loophole are off-base
Importantly, our proposed borrowing tax would likely have little effect on incentives for entrepreneurship, which is one likely argument against it.Economic theory suggests that the efficiency costs of this proposal in terms of a reduced incentive to save or invest for entrepreneurs will be small because they will only be covered by the new borrowing tax if they become enormously wealthy through their ventures.
Entrepreneurs may know that if they do eventually become incredibly wealthy, and thus covered in the future by our proposed borrowing tax, then they will have a low marginal utility of additional after-tax funds—economics parlance for the idea that an extra $100 for a billionaire is worth less than $100 for a lower-income person.
Furthermore, this tax would discourage the current practice of mischaracterizing (higher-taxed) labor income as (lower-taxed) capital income by effectively taxing the entrepreneurial capital income of very high-net-worth individuals covered by the borrowing tax.
Similarly, our proposed borrowing tax would have modest effects on the incentives of those individuals covered by the tax incentives to save or work, another likely line of attack. To be sure, this proposal would likely—but only modestly—increase the effective marginal tax rate on capital income, and there could be small impacts on work efforts as some individuals anticipate slightly increased taxes on the returns to saving earnings from working. Any effects, however, are likely to be small because borrowing represents only a small portion of wealth—about 1 percent to 2 percent, our paper finds.
Furthermore, the resulting disincentive to save is mitigated by the fact that the alternative to saving—consuming—is also taxed a little more by closing the borrowing loophole.
Some may argue that our proposal is unconstitutional because it taxes unrealized income. We explain the legal arguments in more detail in our paper, but briefly, the U.S. Supreme Court has upheld taxes similar to our proposal as a constitutional excise tax on the activity at issue (here, borrowing). Likewise, the existing income tax already taxes apparently unrealized income in a variety of areas, including in partnerships and international taxation, as well as the taxation of some financial products. Finally, borrowing is itself arguably simply a realization of existing gains—the borrowers get cash for their own use, which they could not have obtained but for the gain on their assets.
Yet another likely argument against our proposed borrowing tax is that it would have prohibitively high compliance costs. Our proposal would certainly impose compliance and administrative costs, but we expect these costs to be manageable in part because of the small number of applicable taxpayers. There are only about 35,000 households in the United States that would be covered by this new tax, and fewer than 14,000 of them have more than $1 million in existing debt, according to data collected by the Board of Governors of the Federal Reserve System. And, as we noted earlier, about half of the revenue is raised from only 400 individuals.
Furthermore, available estimates suggest that the compliance costs would be modest. Many of the compliance cost issues in our proposal overlap with those that already occur in the estate tax, so that new innovations would not be needed. Estimates of the costs of such valuation vary substantially, but one widely cited estimate by Greg Leiserson, then-director of tax policy at the Washington Center for Equitable Growth, calculates the compliance costs of the U.S. estate tax as about 0.2 percent of wealth subject to valuation. Applying that estimate, the compliance costs for our proposal would be about 0.8 percent of revenue raised by the proposal.
But our proposal is even easier to administer than the estate tax—and valuation is easier—because we suggest valuing only major assets, such as stakes in corporations, rather than every asset, some of which can be hard to value. This would further decrease compliance costs.
The billionaire borrowing tax has advantages over other potential new taxes, such as periodic taxes on all unrealized gains or a wealth tax. Our research suggests that the billionaire borrowing tax is more politically feasible than a periodic tax on unrealized gains. In particular, in a representative survey of the population, we find that taxing borrowing is 19 percentage points more popular than taxing unsold gains.
Compared to a wealth tax, the borrowing tax is on firmer constitutional grounds and can feasibly be enacted as a small fix to the current income tax, rather than a new tax on a new base. Taxing borrowing also would raise fewer liquidity concerns compared to a periodic tax on unrealized gains or a wealth tax because borrowers have received cash prior to being taxed. Still, it is difficult to compare the borrowing tax to these much more ambitious proposals, which would have both larger revenue potential and larger administrative costs.
Conclusion
There are many details discussed in our paper on the specific design features that would minimize compliance costs and maximize revenue without harming the entrepreneurial work ethic that helps power innovation in the U.S. economy.
Certainly policymakers who decide to take up our proposal will have to keep in mind that billionaires can afford the most pricey tax lawyers to lower their tax bills. In our paper, we discuss a number of ways to make sure that, as the billionaire borrowing loophole is closed, those hunting for new loopholes are stymied by the law. Others will object to taxing the wealthy unless they actually use their gains, but many of the wealthiest actually do use their gains through the borrowing loophole: They get rich, borrow against those gains, consume the borrowing, and do not pay any tax. This is unfair.
Our nation faces concerningly high wealth and income inequality, and strong revenue needs. Closing the borrowing loophole on the super wealthy would combat both challenges and raise more than $100 billion in a highly progressive and reasonably efficient way.
New Circular A-4 offers opportunities for researchers interested in disaggregating the costs and benefits of U.S. regulations

This column is adapted from remarks I made at the Allied Social Sciences Associations 2024 annual meeting, held earlier this year in San Antonio, Texas, as part of a panel on “The Missing Piece: How Are Regulatory Costs Distributed?”.
The Circular A-4 is a government guidance document focused on the methodologies federal agencies use when conducting benefit-cost analysis of proposed regulations. Federal agencies are tasked with determining the most efficient policy approach and ensuring cost-effective implementation, running benefit-cost analyses as needed based on the guidance in the Circular A-4.
Many of the regulations at issue can seem fairly arcane—updating energy efficiency standards for dishwashers, ceiling fans, or other consumer products, for example—and they can be small in scope from an economic efficiency or macroeconomic perspective, often seeming to impact firm costs, prices, and wages only marginally. Yet these are largely misconceptions.
Regulations are an incredibly important way in which economic policy is made in the United States, posing complicated policy-design questions with tens of billions of dollars at stake. In fiscal years 2020–2022, the federal government promulgated 266 regulations that were reviewed by the U.S. Office of Management and Budget to ensure compliance with Circular A-4 and general administration priorities. These regulations included rules on:
- Passenger car and light truck corporate average fuel economy standards, delivering total benefits and costs, including those accruing to firms, workers, and the government, of $7.2 billion and $6.9 billion, respectively
- Enactment of new health information technology guidelines, delivering $3.7 billion in benefits and $1 billion in costs
- Implementation of the Coronavirus State and Local Fiscal Recovery Fund program, transferring $234.9 billion to state, local, and tribal governments
In addition to their efficiency and macroeconomic relevance, U.S. regulations also can have major distributional implications, determining “winners” and “losers” across income, wealth, geography, race, and gender, to name a few key socioeconomic and demographic groups. Take, for example, the 2023 rule increasing the minimum wage for federal contractors from $15 per hour to $17.20 per hour. This regulation is expected to lead to higher wages totaling $1.96 billion paid to low-income workers in the United States by the government and other employers.
Historically, these two considerations—efficiency and equity—have been analyzed separately, or worse, pitted against one another, with an assumption baked into classical economic theory that there is an inevitable trade-off between the two. The Washington Center for Equitable Growth was founded in part to question this assumption and, 10 years later, the empirical evidence identifies the many ways in which equity and economic growth are indeed complementary.
In November 2023, the Biden administration released an updated Circular A-4, which relies on extensive research from Equitable Growth-funded and other academics. This new version marks a an important and overdue update: Federal agencies no longer can ignore the distributional considerations of their proposed regulations. Instead, the new conventional wisdom is that equity and efficiency go hand-in-hand and must be analyzed concurrently, as exemplified in the beefed-up sections on distributional analysis in the new Circular A-4. (See Figure 1.)
Figure 1
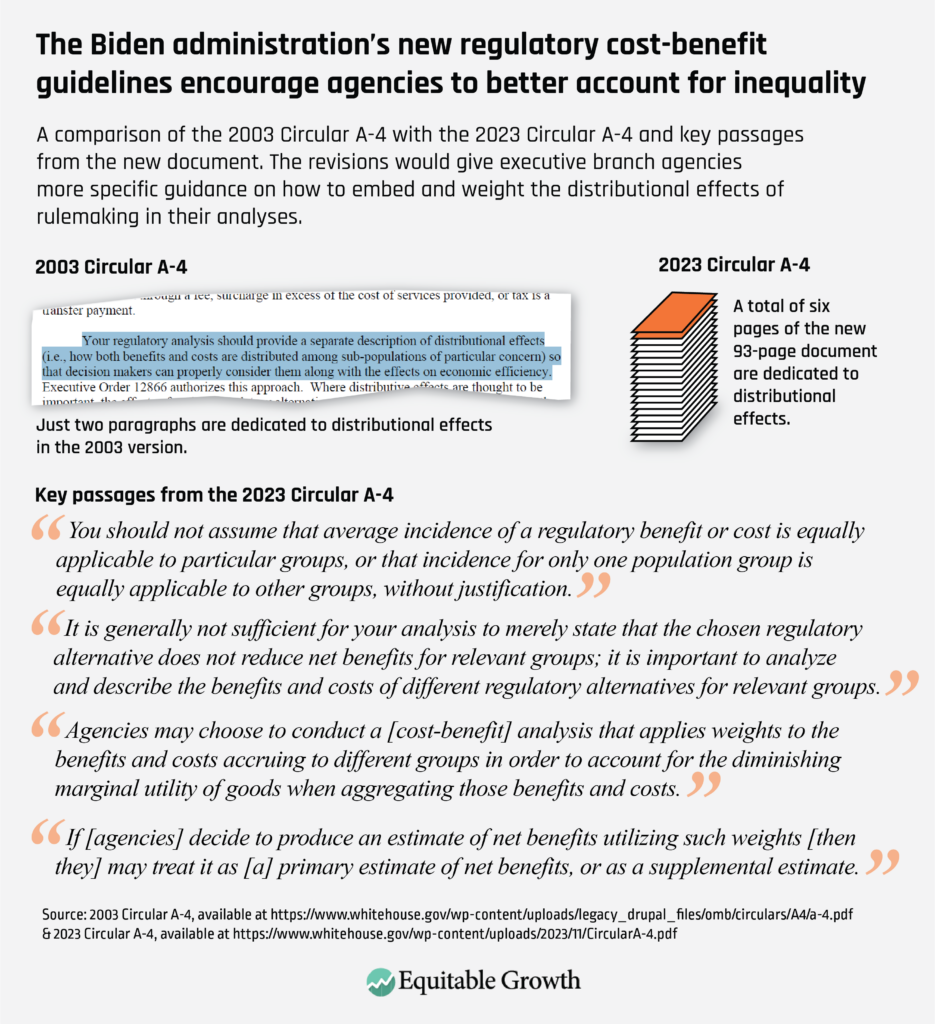
Equitable Growth is committed to seeing the Circular A-4 successfully implemented and is well-positioned to aid both academics and government officials alike in this quest. We offer grants to academics studying these and similar issues, help researchers navigate government and policy debates, and connect policymakers to academic work that can build the evidence base and make the case for change. Our strong relationships with both government officials and academic researchers mean that we are uniquely able to identify the policy issues and research questions most in need of investigation.
Below, I discuss how the latest revisions to the Circular A-4 might change researchers’ approach to their work and offer opportunities to directly impact policy and set new methodological norms.
Opportunities to directly impact policy
Even before the new Circular A-4 was finalized in November 2023, it was clear that federal agencies were taking distributional analysis more seriously. Genuine efforts to trace the costs of new regulations abounded—for example, the noncompete rule at the Federal Trade Commission, which, as an independent agency, is not actually required to follow the Circular A-4 guidance, and the dishwasher and ceiling fan rules referenced above.
The revised Circular A-4, which encourages but does not require a weighted distributional analysis of all major economic rules, will only increase the number of agencies incorporating this information into their regulatory impact statements. The demand for research—and, specifically, for distributional research on who bears the costs and benefits from regulation—is genuine and growing. But it’s up to researchers to generate the supply needed to meet that demand, and a first step might be better understanding what data the government actually needs.
Indeed, finding the necessary data and analysis in the academic literature is a challenge. The abovementioned FTC noncompete rule, for example, relied on just two academic papers that were on point. And though the U.S. Department of Energy attempted to determine how the dishwasher and ceiling fan rules would affect low-income and senior-only households—two key vulnerable consumer groups—the analysis employed was fairly crude, given a dearth of in-depth studies of these admittedly niche markets.
As a recently issued White House Office of Science and Technology Policy report points out, the Federal Trade Commission and the Department of Energy are not the only federal agencies that need additional research to more holistically analyze the impact of federal regulations. In fact, the report identifies several regulatory policy areas that require more research, including the administrative burdens placed on beneficiaries of public benefit programs, the distribution of transportation costs and benefits, and the impact of improved contract market transparency on poultry growers, to name just a few.
Additionally, every federal agency publishes a regulatory agenda twice a year that lays out the actions the agency expects to pursue over the coming years. These can help researchers better understand the areas where agencies are still building a research base, thus offering a moment of maximum leverage to assist agencies in framing the problems they want to address, as well as possible solutions. Likewise, thanks to a law that was enacted in 2019, agencies are also now required to produce a “learning agenda” every 5 years, which summarizes research questions that agencies flag as important to their ongoing work.
For instance, one regulation on the U.S. Department of Labor’s most recent regulatory agenda—which has been the subject of Equitable Growth-funded research—is the Occupational Safety and Health Administration’s national heat standard. While many states have experimented with their own heat standards, providing potential natural experiments to investigate these questions, the OSHA standard would benefit from a more granular understanding of whether and how employers pass on the costs of providing shade, breaks, or air conditioning to workers. Indeed, the agency dedicated a specific section of its advance notice of proposed rulemaking to data sources that could help reveal whether there are inequalities in exposure to hazardous heat in working conditions and resulting health and safety impacts.
Researchers also can weigh in during a proposed rule’s comment period, which opens after the draft proposal is officially published in the Federal Register. But the impact of research at this stage is more on the details and rationale of a rule, helping agencies determine and defend specific policy design choices, rather than building the research base or guiding agencies as they define the issues they want to address.
It is also important to remember that government officials facing pressing policy questions often have to take the academic literature where it stands and make decisions with the information available to them at the time. This means findings that are not yet formally published, such as those found in working papers or online appendixes, are very valuable. Additionally, researchers can help policymakers by publishing:
- Point estimates of market elasticities, even with wide confidence intervals, so that regulators can estimate the effect of price changes on supply and demand
- Marginal impacts, since regulators are usually interested in the effects of small policy changes rather than the creation of whole new programs
- Distributional information in various forms so that agencies can use the data that best suits their needs (for instance, data by income decile rather than just above and below the federal poverty line)
A lack of timely evidence and data can tilt the process in favor of large, well-resourced organizations—typically private-sector businesses and trade associations most directly affected by the regulations. The bigger the research gaps facing policymakers, the more likely business interests will fill those gaps with their own, often biased analysis. Policymakers understand that preliminary findings are better than nothing—and will eventually be refined over time.
Take, for example, the history of tax incidence research. Policymakers are understandably very interested in knowing who ultimately bears the cost of tax increases and, conversely, who benefits from tax cuts. Over the past several decades, the academic literature on this question has matured considerably, from abstract theory around the mobility of labor and capital to more granular, empirical work that actually traces which workers and firms are affected over both the short term and long term. All the while, government analysts at the U.S. Congress’s Joint Committee on Taxation, the Congressional Budget Office, and the U.S. Treasury Department have followed the academic progress and updated the assumptions that go into their “scores” of tax proposals, a version of distributional benefit-cost analysis, accordingly.
Other disciplines should be open to a similar evolutionary approach to building precision in distributional analysis.
Opportunity to set new methodological norms
While the new Circular A-4 provides more direction to agencies on how to conduct distributional analysis, there are still a number of unanswered methodological questions on just how it will work in practice—for example, on which “subgroups of interest” agencies should focus. The White House Office of Science and Technology report explicitly concedes that the federal government still needs to reach alignment on this point—and the answer will likely look different across different federal agencies and programs.
This provides an opportunity for academic researchers, especially those who have already been grappling with these questions at their universities. Academic initiatives that develop methodological norms built up at universities on, say, how to disaggregate Gross Domestic Product can be adopted by government statisticians, who often see them as proofs of concept to provide the necessary nudge toward action.
Other areas for methodological innovation that could help set new, influential government norms include:
- The threshold of estimated differentiated impact at which a distributional analysis should be triggered and how to more rigorously choose the relevant subgroups for inclusion. For instance, should rulemakings on the Special Supplemental Nutrition Program for Women, Infants, and Children take into account the impact the program has on Black mothers in particular, given the unique challenges they face?
- How to better and more systematically draw from qualitative accounts, such as using surveys, ethnographic research, interview research, and comments, to characterize hard-to-quantify or hard-to-monetize benefits, including those related to equity, dignity, and fairness. Take, for example, the recent rule from the U.S. Department of Transportation on airplane lavatories, which struggled to quantify the benefits of making plane bathrooms wheelchair accessible.
- How to present distributional information in regulatory impact statements so as to make the greatest impression on busy policymakers. Experiments comparing various approaches, and the resulting ability of readers to recall and act on the information, could be helpful.
- How distributional weighting—a novel, and optional, approach to quantifying the value of costs and benefits to individuals up and down the income spectrum (See Figure 2)—can interact with the already somewhat income-weighted “value of a statistical life” calculation used across government.
Figure 2
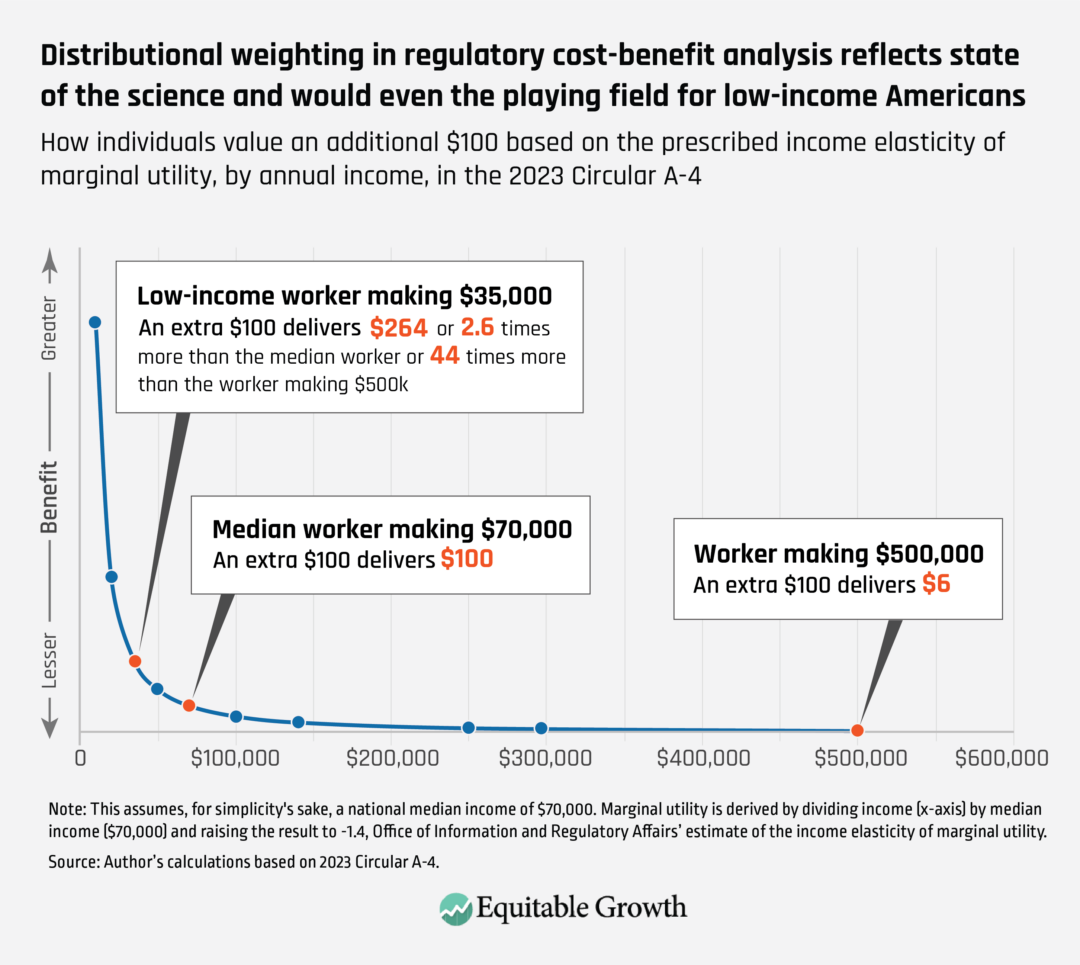
Conclusion
The new Circular A-4 offers opportunities for researchers to get involved in regulatory design and methodology and for policymakers to work with academics to get the evidence they need to assess and back up their proposals. Given these opportunities for policy impact, it would be a shame if academics find themselves, and their research, sitting on the sidelines. Regulations are critical for making economic policies and have major impact on both economic efficiency and equity. If we want regulations to be based on rigorous evidence, then academics have to play a larger role in producing relevant research than ever before.
I would like to thank Lisa Robinson for moderating the ASSA panel on which this column is based and for inviting me to participate, as well as the Society for Benefit-Cost Analysis for hosting. I would also like to thank my fellow panelists Ann Wolverton, Donald Kenkel, and Lori Bennear for their thoughtful contributions to the discussion.
The impacts of increasing U.S. hospital consolidation on Medicaid recipients

Introduction
The U.S. healthcare sector is a consequential part of the overall economy. As of 2021, U.S. healthcare expenditures alone would rank third among the world’s largest economies in terms of estimated GDP.
The importance of understanding the structure of such a large portion of the U.S. economy is self-evident. But it is made all the more essential given healthcare’s profound impact on the well-being of the population. The United States has stark inequality in health outcomes, and as such, the value of better understanding how the structures of the healthcare market contribute to or mitigate these disparities cannot be overstated.
One trend that is rapidly changing the structure of U.S. healthcare delivery is the consolidation of hospital systems. Mergers and acquisitions mean healthcare markets across the country are dominated by fewer and larger health systems. Indeed, 48 percent of U.S. hospitals operate in markets with two or fewer competitors, according to a recent analysis.
Economists and other researchers have long raised concerns about the impacts of reduced competition on healthcare costs, quality-of-care delivery, and whether consolidation could widen inequality and disproportionately harm lower-income populations. These apprehensions are particularly salient to hospital-based care because hospitals play a crucial role in serving individuals from diverse socioeconomic backgrounds with varying levels and types of insurance. More specifically, these concerns are pertinent to populations covered by Medicaid, which typically offers lower reimbursement rates compared to private insurers.
The heightened attention on hospital mergers and concentration is not just from researchers alone. Policymakers and regulators also have raised concerns about the trend and released guidance on several aspects of reduced competition in healthcare. A 2021 White House executive order on promoting competition throughout the U.S. economy, for instance, highlights increasing hospital concentration, acknowledging that such concentration has important impacts on patients’ access to healthcare. The Federal Trade Commission also has warned that Certificates of Public Advantage—laws that favor state oversight over competition in attempts to insulate hospital mergers from antitrust regulation—are insufficient to protect against the downsides of increasing market concentration.
A large share of existing research on this topic does not focus directly on the care provided to low-income patients, instead analyzing data derived from private insurance markets and Medicare. Yet hospital mergers may have meaningful impacts on low-income patients for several reasons.
For one, a plethora of evidence demonstrates that hospitals in more concentrated markets can negotiate higher reimbursement rates from private insurers. These higher prices may widen the gap between what hospitals are reimbursed for when caring for privately insured patients relative to those insured by government programs such as Medicaid. Whether this payment gap harms Medicaid patients is not theoretically clear-cut. On the one hand, it could create a disincentive for hospitals and providers to care for low-income patients or invest in the quality of their care. On the other hand, it also is possible that hospitals may use higher revenues from private insurer payments to subsidize care for low-income patients.
In addition, the large presence of nonprofit hospital systems could shape the effects of consolidation activity on vulnerable populations. Nonprofit hospitals are privately owned hospitals that have special tax status, with the understanding that profits will be reinvested in the hospital and used for improving patient care. They differ from public hospitals, which are owned by a city or state government, are funded by tax revenue, and typically provide a large volume of charity care.
Nonprofit hospital mergers have historically been approved on the basis that they would not raise prices—or if they did, they would invest incremental profits to benefit lower-income patients. Given their ostensible community-serving mission, one might expect exactly this kind of behavior from nonprofit hospitals, but there is ample evidence that nonprofit hospitals act like for-profit organizations.
These challenging-to-predict market dynamics underscore the importance of and need for more empirical work in this area. Indeed, it motivated our own research on the topic, in which we find that increasing hospital concentration is associated with decreases in the number of Medicaid patients admitted to nonprofit hospitals and increases in Medicaid admissions at public hospitals. This suggests that increasing concentration may lead systems to prioritize treating privately insured patients over those insured by Medicaid. It also adds gravity to the question of whether nonprofit hospitals act in accordance with the explicit community-serving mission that their legal status endows.
Our paper, co-authored with our New York University colleagues Prianca Padmanabhan, Alan Z. Chen, Ashley Lewis, and Sherry A. Glied and published recently in the Journal of Health Economics, has direct implications for state and federal policymakers with respect to the impacts of hospital mergers and increasing market concentration on low-income patients. It is particularly relevant in terms of investments in the healthcare delivery system for low-income populations and regulatory approaches to merger and acquisition activity in healthcare.
The remainder of this brief is structured as follows. First, we provide an overview of trends in U.S. hospital mergers and market concentration. Then, we offer a more detailed discussion of the theoretical and empirical impacts of mergers on low-income patients before turning to an overview of our recent research. We close with a summary of the implications of our work in the context of the literature, as well as recommendations for regulators, policymakers, and researchers.
Trends in U.S. hospital mergers and healthcare market concentration
In recent decades, there has been significant consolidation in the U.S. hospital market. A key driver of that trend is mergers and acquisitions of hospitals into larger systems.
A 2022 study by the University of California, Berkeley’s Brent Fulton and his co-authors finds a steady trend toward greater hospital consolidation over time. In 1970, approximately 10 percent of hospitals were part of a hospital system, with the remaining 90 percent being independent hospitals. But Fulton and his co-authors find, in 2019, that 65 percent of hospitals belonged to a system, and between 2010 and 2019, that 1,500 hospitals were acquired or merged with a hospital system.
Another method that economists and regulators use to characterize the level of competition or concentration in a market is called the Herfindahl-Hirschman Index. The HHI is calculated as the sum of each hospital’s squared market share. This measure is sometimes multiplied by 10,000, and therefore can range from 0 to 1 or 0 to 10,000. An HHI of 10,000 corresponds to a monopoly market, with a single hospital controlling the full market, while a lower HHI indicates a more competitive market. An HHI exceeding 2,500 (or 0.25) is considered a highly concentrated market.
Research using HHI as opposed to tallying up mergers over time corroborates Fulton and his colleagues’ 2022 findings of reduced competition among U.S. hospitals. A 2015 study looked at hospital consolidation at the level of metropolitan statistical areas using the Herfindahl-Hirschman Index and found that in 1990, 65 percent of these metropolitan statistical areas were classified as highly concentrated. By 2016, a separate study found that this had increased to 90 percent of U.S. metropolitan statistical areas.
Conceptual and empirical impacts of hospital mergers on low-income patients
One potential impact of mergers on low-income patients stems from increasing hospital market concentration allowing hospitals and healthcare systems to negotiate higher reimbursement rates from private insurers. Depending on how these increased revenues are used, low-income patients may either benefit or be short-changed.
If acting altruistically, a hospital may use increased revenues from insurers to cross-subsidize care by offering more services for low-income patients or improving those that are already in place. Nonprofit hospitals would be expected to do just that. Yet the evidence for nonprofit hospitals cross-subsidizing care is dubious. Indeed, research published in 2020 suggests that nonprofit hospitals are no more likely to provide charity care or increase unprofitable offerings than their for-profit counterparts in response to increased market power.
Alternatively, if hospitals negotiate for increasingly high reimbursements from private insurers while low-income patients remain reliant on charity care or lower-paying government insurers, then an incentive structure arises that may harm low-income patients. As the opportunity cost of taking care of low-income patients rises, hospitals may aim to capture additional earnings by prioritizing care for those insured by higher-paying organizations or by peeling off services used more frequently by low-income patients.
In terms of the quality of care, theory suggests that growing hospital systems may benefit low-income patients via economies of scale. Larger hospital systems may improve efficiency in many spheres, improving care for all patients. Conglomeration of hospitals may also widen access to high-quality tertiary or specialty care for low-income patients that smaller, community hospitals may not otherwise offer. Yet there is not strong evidence that mergers actually do improve healthcare quality on average.
While the conceptual impact of hospital mergers on healthcare for low-income patients is not clear-cut, the present body of empirical evidence does not offer obvious signs of benefit. One study, which focused on rural communities, finds evidence that following mergers, rural hospitals decrease their offerings of obstetric and outpatient primary care services. Additional evidence suggests similar disinvestment in mental health services in recently consolidated rural hospitals.
Much of the remaining research on mergers, however, does not focus directly on the care provided to low-income patients, likely in part due to greater difficulty obtaining granular claims data for uninsured or Medicaid patients. It is this limited evidence on how mergers impact low-income patients that motivated our research, to which we now turn.
Effects of hospital concentration on Medicaid patients
Our study, titled “Hospital concentration and low-income populations: Evidence from New York State Medicaid,” aims to better understand the effects of changes in hospital market concentration on low-income patients using data from New York state. New York maintains one of the largest Medicaid programs in the country, which makes it an effective setting to study this question. We leverage detailed data on the universe of New York state hospital admissions from the Hospital Cost and Utilization Project State Inpatient Data, the most comprehensive source of hospital care data in the country, developed by a federal-state-industry collaboration and sponsored by the federal Agency for Health Care Research and Quality.
We estimate the effects of changes in market concentration on hospital-level inpatient Medicaid volumes overall and for birth-related admissions separately. We narrow in on birth-related admissions because they account for the plurality of Medicaid-funded admissions, so any impact of changes in market concentration may have the strongest effect in this category. Moreover, inequity in birth outcomes is a topic receiving warranted attention in the popular media and in health policy spaces.
Our data covers the years 2006–2012 and includes detailed information on every inpatient admission in New York state. We pair these data with information on hospital characteristics, as well as a database on hospital mergers during those years to study market concentration.
Our study includes 192 hospitals that make up 135 health systems across the state. Eighty-eight percent of hospitals were nonprofit, and 12 percent were public. Due to restrictions on for-profit hospitals in New York, there were no for-profit hospitals in our study. This differs from the composition of hospitals nationally; 24 percent of U.S. hospitals are for-profit.
During our period of study, 17 hospitals were acquired. To measure market concentration, we construct an HHI measure for each hospital’s market—which we term “hospital-specific HHI.” Because there are many forces that may increase market concentration beyond mergers and acquisitions, such as hospital closures, we construct a second concentration statistic that isolates the effects of mergers and acquisitions, which we call “merger-induced HHI.”
We find that for the average hospital in our study, an increase in hospital concentration—as measured by hospital-specific HHI—is associated with a decrease in Medicaid admissions. Using merger-induced HHI, we find an even more pronounced effect, though only for birth-related admissions as opposed to the birth- and non-birth-related admission effects we see with the hospital-specific HHI measure.
To test whether these results are simply a function of declining patient volumes across all payer groups following a merger, we evaluate for a decrease in Medicaid patient mix, or the proportion of a hospital’s admitted patients insured by Medicaid. We find a statistically significant decrease, suggesting that these decreases in Medicaid admissions were disproportionate, as opposed to being in line with overall decreases among all patients regardless of insurance type.
We then measure changes in Medicaid volumes at nonprofit and public hospitals and identify an important difference between the two. Namely, we note a decrease in Medicaid patients at nonprofit hospitals and an increase at public hospitals, suggesting patient flows from the former to the latter. Using merger-induced HHI, we find that a 1 percent increase in HHI is associated with a 2.2 percent decrease in Medicaid birth-related admissions at nonprofit hospitals and a 9.8 percent increase in Medicaid birth-related admissions at public hospitals.
A back-of-the-envelope calculation, then, suggests an estimated decrease of 1,977 Medicaid birth-related admissions in nonprofit hospitals and an increase of 1,580 Medicaid birth-related admissions to public hospitals in a year. This suggests that with market concentration, nonprofit hospitals may become disincentivized to treat lower-paying Medicaid patients. Public hospitals, which have different objectives with respect to serving Medicaid patients, appear to absorb a significant share of this population—in the above calculation, 80 percent of birth-related admissions.
How exactly might a hospital go about reducing the number of Medicaid admissions? In the case of childbirth, a birthing parent’s hospital choice is largely determined by the hospital at which their physician has admitting privileges. Hospitals may reduce their Medicaid patient mix by not granting admitting privileges to providers who treat a large share of Medicaid patients. Indeed, we find evidence that fewer physicians who serve large shares of Medicaid patients admit patients to hospitals in more concentrated markets. Yet it is also possible that such providers elect to send fewer patients to hospitals in concentrated markets for any number of reasons.
Other potential mechanisms by which hospitals could reduce Medicaid volumes, which we were not able to test, include simply being less likely to grant admission to Medicaid patients or to making efforts to direct or transfer Medicaid patients to other hospitals. Some evidence of this practice exists in the literature.
Policy implications and recommendations
Our results, taken together with literature on the effects of mergers on patient health outcomes, suggest that increasing hospital market concentration may have deleterious effects on care for low-income patients. There is an absence of strong evidence that, on average, patients benefit from quality improvements following mergers.
While our work does not speak to healthcare quality, it does suggest that with increasing hospital market concentration, healthcare systems may prioritize treating privately insured patients over those insured by Medicaid, leaving public hospitals to pick up the slack. These issues are challenging, and predicting the behavior of hospital markets is exceedingly difficult.
Still, high-level policymakers and regulators can play a role in addressing the effects of increasing hospital market concentration in the United States. Our findings yield several policy implications:
- The uninsured and those insured by Medicaid are an important subpopulation to directly consider and analyze in antitrust enforcement. Because of their differing needs and lower reimbursement rates, the impacts of market concentration on Medicaid populations may differ from those on privately insured or Medicare patients. As a result, when considering a proposed hospital merger, examining consumer well-being solely based on Medicare and privately insured patients may overlook detrimental impacts on these vulnerable populations. Such impacts may manifest in changes in quality or accessibility, such as patient flows away from nonprofit hospitals and toward public hospitals that are already overburdened and under-resourced.
- Investments must be made in data assets that facilitate research on Medicaid patients. Inadequate data has long been a barrier to analyzing impacts on Medicaid uninsured populations. The Agency for Health Care Research and Quality’s Hospital Cost and Utilization Project State Inpatient Data, which we used in our study, provides one excellent resource to study this population. Continued investment in expanding and improving the accessibility and usability of this and similar data is essential.
- The impacts of mergers on childbirth admissions deserves particular attention. The necessity of attending to these effects when considering policy reform is important because infant and maternal outcomes are an area in which the United States already markedly underperforms compared to peer nations and in which we observe unacceptable disparities across various segments of our nation’s population.
- Granting nonprofit status to hospitals does not necessarily guarantee actions for public good. Our findings bring into question whether nonprofit hospitals broadly act in sufficient concordance with their charter for public good and, more specifically, the justification for special treatment of nonprofit hospitals when it comes to merger approvals. Our research adds to the body of evidence that nonprofit hospitals behave similarly to their for-profit counterparts. Relatedly:
- States have attempted to use Certificates of Public Advantage, paired with arguments for preservation of quality and equity of access, in pursuit of merger approval, particularly when nonprofit institutions are involved. These efforts have largely been ineffective.
- Payment designs that encourage consolidation within the healthcare market should be reassessed and restructured. Martin Gaynor of Carnegie Mellon University and his co-authors succinctly highlight opportunities for intervention, such as Medicare’s facility fee and reform of the 340B drug pricing program.
- Market consolidation activity should be considered when making investments in healthcare programs for low-income populations or establishing Medicaid payment rates. Our research suggests that in increasingly concentrated markets, patient flows across hospital types may be affected. When constructing policies to bolster care for low-income populations, it is important that these interventions are directed at providers who are prioritizing the medical care of the target population.
Understanding the impacts of mergers on Medicaid and uninsured patients is important. Our work presents evidence that financial incentives may contribute to the deprioritization of care for patients who, on average, are already more vulnerable. Ensuring that the well-being of these patients is considered closely when evaluating the impacts of hospital market concentration is of the utmost importance.
—Sunita Desai is an assistant professor in the Department of Population Health at NYU School of Medicine, with secondary appointments in the Department of Economics at NYU Stern and Health Policy at NYU Wagner. Kyle Smith is a medical student at NYU’s Grossman School of Medicine.