The state of the U.S. labor market 4 years after the start of the COVID-19 recession

Over the past 4 years, the U.S. economy—in particular the U.S. labor market—weathered some incredible shocks and fluctuations. From the COVID-19 pandemic and supply chain breakdowns to global energy shocks and massive shifts in consumer behavior, U.S. workers have been through a lot. This month, 4 years on from the start of the pandemic in the United States, it is valuable to take stock of what the U.S. labor market has been through and where it currently stands.
Given the incredible challenges of the past several years, it is, in many ways, remarkable to report that the livelihoods of U.S. workers are very strong—and in fact, it is even possible to argue that the U.S. labor market is the strongest it has ever been. Of course, this does not mean there is no additional progress to be made or that every single worker in the United States has seen their circumstances improve. But it does mean that, in general, the U.S. labor market is currently delivering very concrete and measurable gains for most workers.
This column looks at several indicators, from the unemployment rate to wages and worker power to productivity, to assess and bolster this claim. Taken together, the data on these indicators show how strong the economy is for U.S. workers on the eve of President Joe Biden’s 2024 State of the Union address on March 7.
Unemployment
The overall unemployment rate is a good place to begin. Fundamentally, when joblessness is low, it means that U.S. workers can find jobs relatively easily, they can find better jobs if and when they want to, and they have leverage in their relationships with their employers, leading to higher wages and better working conditions. Today, all of those things are true.
U.S. workers are currently enjoying extremely low levels of unemployment. While the overall unemployment rate spiked to 14.8 percent in April 2020 before falling rapidly to 6.8 percent by the fall of 2020, progress then slowed, with unemployment falling just 1 percentage point over the next 8 months. Then, starting in the spring of 2021, the rate began to drop more quickly and reached 4 percent by the end of 2021—and has been at or below 4 percent for 26 straight months, the longest sustained, continuous stretch of 4 percent unemployment since the late 1960s.
Furthermore, over those 26 months, the unemployment rate has averaged 3.6 percent. That is a slight improvement, compared to the 26 months prior to the start of the pandemic, when the unemployment rate averaged 3.8 percent.
To put that in perspective, it took 8.5 years for the unemployment rate to drop below 4 percent after the end of the Great Recession in 2009. Yet after the COVID-19 recession of 2020, it took less than 2 years to accomplish the same feat.
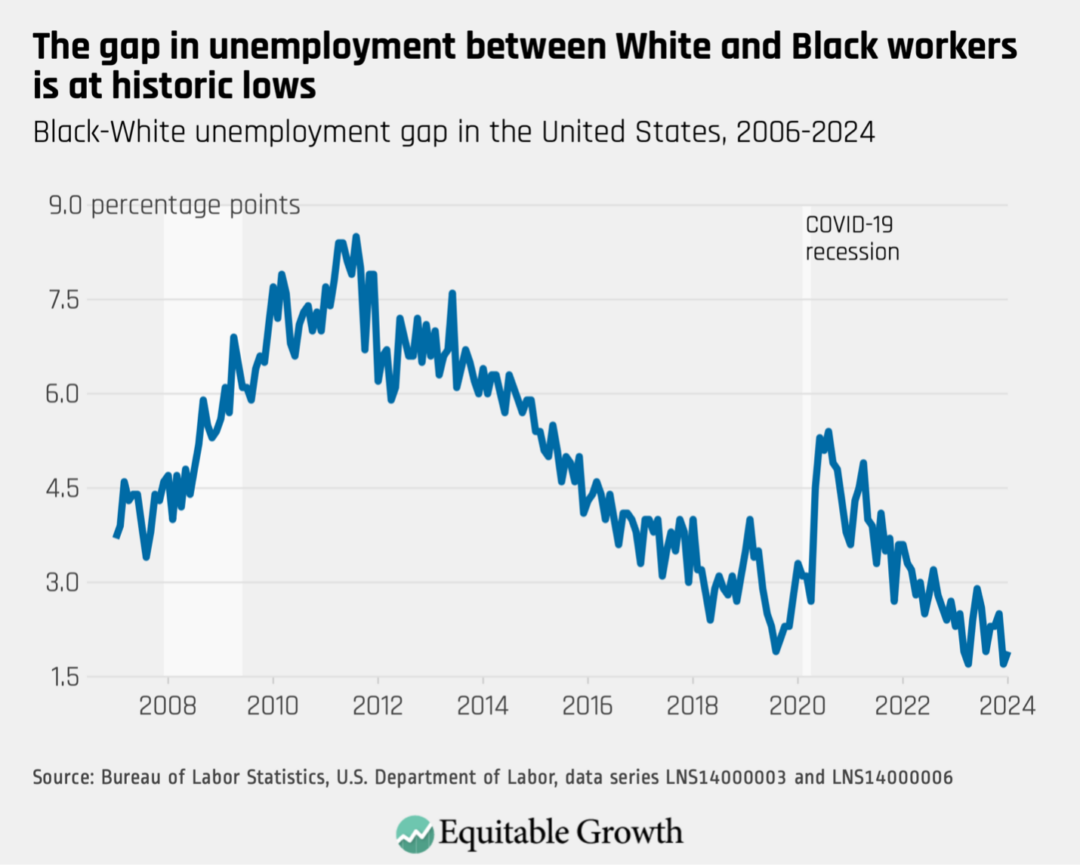
Sometimes, however, low overall unemployment can mask important variations across demographic groups. In 2000, for example, when the overall unemployment rate averaged 4 percent, the unemployment rate for Black workers was almost double that, averaging 7.6 percent.
Today, the unemployment rate for Black workers in the United States is 5.3 percent. That’s still higher than the overall unemployment rate of 3.7 percent, but the difference between the unemployment rate for White workers and Black workers is, today, at the lowest level it has ever been. (See Figure 1.)
Figure 1
Similarly, when the labor market is weak, younger workers often bear the brunt of that weakness. More than 3 years into the recovery from the Great Recession of 2007–2009, for example, the youngest workers, those aged 20 to 24, still faced an unemployment rate of more than 13 percent—fully 6 points higher than the overall unemployment rate. Meanwhile, four years into the COVID-19 economic recovery, the unemployment rate for young workers is less than 6 percent—only about 2 points higher than the overall rate.
Workers also are less likely to experience a long bout of unemployment today than they were at a similar point in the previous economic recovery after the Great Recession. Today, about 1 in 5 unemployed workers has been out of work for more than 27 weeks, the same rate as immediately prior to the pandemic. In 2012, however, more than 1 in 3 unemployed workers had been out of work for that long or longer. Despite this clear improvement, this is one area where there is still some room to do better for U.S. workers: In the late 1990s, only 1 in 10 unemployed workers faced long-term unemployment.
Labor force engagement
Because the unemployment rate measures those out of work but looking for a job, it is possible for the unemployment rate to decline not because jobs are available, but because discontented and discouraged workers simply stop looking for work. Therefore, another important indicator of the overall health of the labor market is how many potential workers are actually attached to the labor market—employed or actively seeking out work if they are not currently employed.
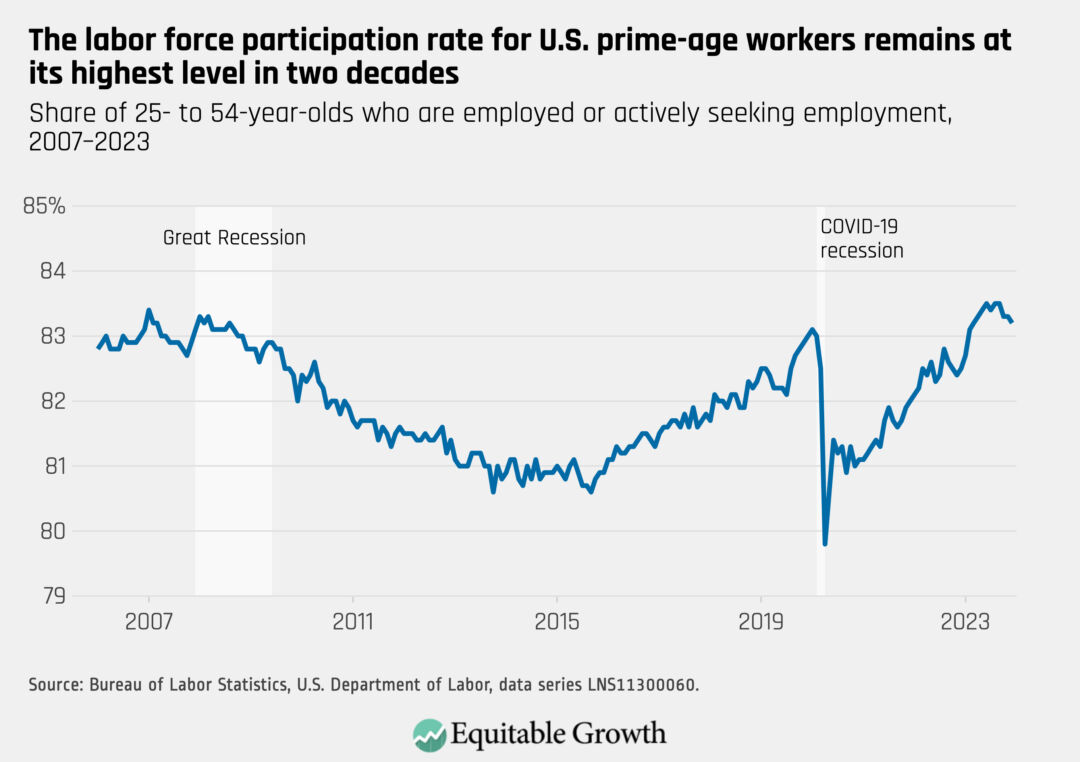
By most measures, today, the overall size of the U.S. labor force and the share of potential workers who are working has fully recovered from the COVID-19 pandemic—and, in fact, has now fully recovered from the Great Recession as well. As of January 2024, 83.3 percent of 25- to 54-year-olds were attached to the labor force, whether employed or actively looking for work. That’s up nearly 2 full percentage points from 2020. It also exceeds the average rate in 2019 by almost 1 percentage point. In fact, the so-called “prime age” labor force participation rate hasn’t been this high since the year 2000, when it averaged 84 percent. (See Figure 2.)
Figure 2
Over the course of 2023, roughly 72 percent of all people aged 16 to 64, whether in the labor force or not, were employed. That was the highest annual average employment share in 15 years. Only in the late 1990’s did the employment-to-population ratio exceed 2023’s.
Coming out of the pandemic, there was a concern that women in particular would encounter barriers to reentering the workforce in a soft labor market. Women workers bore a disproportionate brunt of the damage from the pandemic-induced recession, with the service sector—where women are overrepresented—particularly hard hit and many working mothers leaving the labor force to care for their children in the wake of school and daycare closures. Indeed, the unemployment rate among women went from being slightly below the unemployment rate for men before the COVID-19 pandemic to being 2.5 points above it in the spring of 2020.
Yet today, according to the U.S. Bureau of Labor Statistics, more than 77 percent of women between the ages of 25 and 54 are back in the labor force. That’s actually higher than it was in 2019, when the average labor force participation rate among women in that age group was 76 percent. Moreover, more than 75 percent of all women ages 25 to 54 are currently employed, which is an all-time high.
Wages
With low unemployment and high labor force attachment, we would expect to see robust wage growth for workers. That’s because in strong labor markets, workers have the leverage to demand higher wages from their current employers or to switch to jobs that better reward their efforts with higher wages. And in 2023, that’s exactly what we saw.
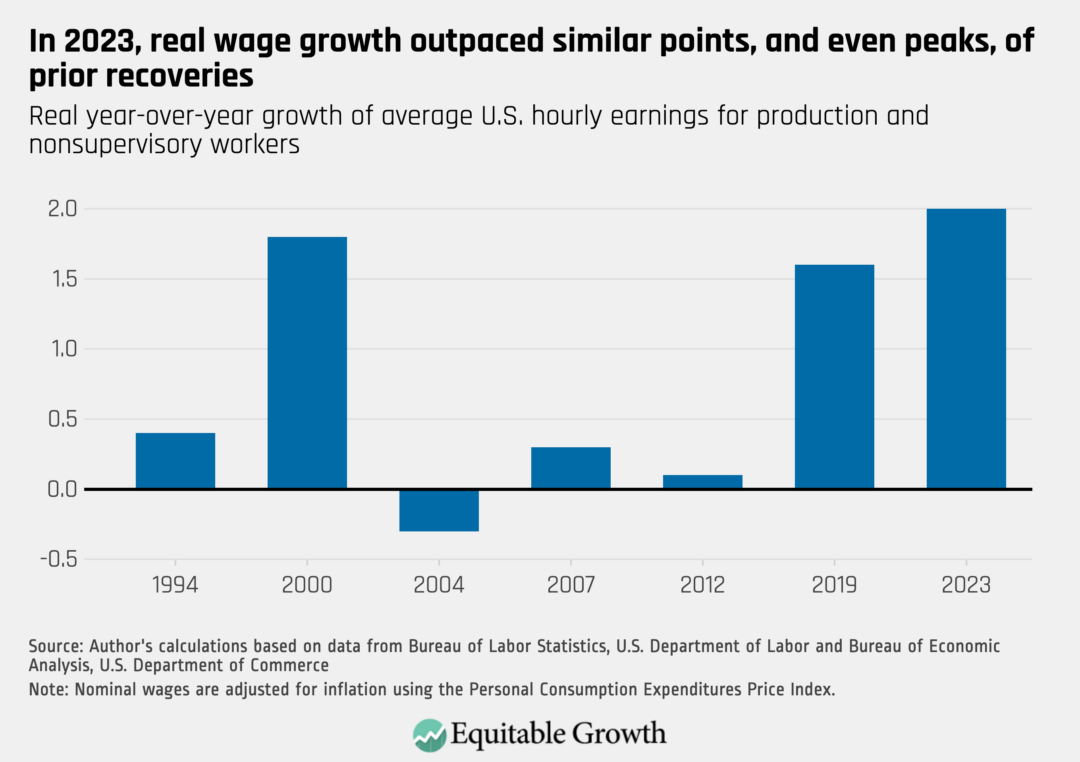
By the end of 2023, the average hourly wage for production and nonsupervisory workers was 2 percent higher than it had been in 2022, after adjusting for inflation—far stronger wage growth than at this point in previous economic recoveries. In fact, 2023 was a stronger year for real wage growth than 2007, 2019, or even 2000—all of which were the peaks of their respective economic expansions. (See Figure 3.)
Figure 3
Additionally, the Federal Reserve of Atlanta—which measures wage growth on an individual basis year over year—reports that overall real wage growth in the United States for 2023 was 3.1 percent. That’s significantly higher than it was prior to the COVID-19 pandemic, when it was around 2.1 percent.
Furthermore, according to economists Arindrajit Dube of the University of Massachusetts Amherst, David Autor of the Massachusetts Institute of Technology, and Annie McGrew of UMass Amherst, workers at the bottom and in the middle of the U.S. income distribution enjoyed the highest wage growth in 2023. Dube and his co-authors find that wages grew for workers in the middle quintile by nearly 4 percent over the course of 2023 (adjusted for inflation), whereas in 2019, the median inflation-adjusted wage grew by just 1 percent over the prior year. grew by just 1 percent over the prior year.
Workers at the bottom of the U.S. income distribution are also faring better in this recovery. The Economic Policy Institute finds that the share of the total workforce now working for less than $15 an hour has declined to just 11 percent. That’s the lowest level since the think tank began tracking this metric. In 2019, about 20 percent of all workers earned less than what $15 an hour would be today.
Worker power
Beyond the availability of jobs and even the wages of those jobs, it’s also important to consider how much power workers have. In weak labor markets, workers feel trapped in their jobs, are unable (and often unwilling) to bargain for better wages or improved working conditions, and have little leverage to advocate on their own behalf. Yet today, it is clear that the power has shifted toward employees in a number of measurable ways.
For one thing, in 2023, U.S. workers felt more comfortable voluntarily leaving their current jobs than they have in the past—a sign they felt confident they could transition to a better job situation. The share of workers who quit their jobs hit an all-time high in 2022 at 3 percent, and while the rate declined in 2023, it still remained higher than the quits rate immediately prior to the pandemic. Indeed, the rate of workers choosing to leave their jobs was higher in 2023 than it was at the peak of the past three economic expansions.
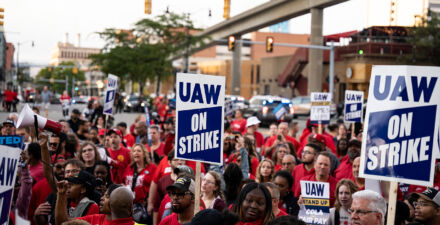
U.S. workers also felt more comfortable taking direct action to improve their working conditions. In 2023, there were 35 major strikes (work stoppages involving more than 1,000 workers) across U.S. industries, affecting 16,700 total days of work. Both of those measures were the highest in more than two decades. Major strike activity in 2023 involved 460,000 U.S. workers, the second-highest number of workers involved in a major strike since 1983. Work stoppages are still far below the levels that were common prior to 1980, but 2023 was a marked departure from the last several decades.
Despite the significant increase in strike activity, however, the overall unionization rate in the United States declined slightly in 2023. The number of workers in unions grew year-over-year but not enough to keep up with the overall growth in employment. That said, there were 410,000 more union members in 2023 than in 2021, making 2022 and 2023 the second-best two-year period for union member growth since at least the early 1980s.
Productivity
U.S. workers face low levels of unemployment, can find jobs relatively quickly when they do become unemployed or choose to seek better opportunities, and are earning higher wages because of the leverage these conditions deliver to them. This is also the set of circumstances that typically leads to higher worker productivity. Workers can do more with the same amount of time and resources when they are well-compensated for their time, when employers have to compete for workers, and when employers invest in their current workforce. And indeed, 2023 saw the beginnings of what could turn into a productivity boom.
Over the course of 2023, productivity—the total amount of output produced per worker—grew at an annual average rate of 2.7 percent. That was the fourth-best year for productivity growth since 2000 (excluding recession years) and a dramatic improvement over the equivalent points in prior recoveries. In 2012, for example, productivity was essentially flat.
It’s even possible that the good news in 2023 is hiding even better news. While the overall annual average productivity growth in 2023 was 2.7 percent, the average annualized growth rate over the last three quarters of 2023 was a whopping 3.9 percent. An annual rate of 3.9 percent productivity growth would make 2023 the second-best year for productivity growth since the turn of the 21st century, and exceeding productivity growth in 2019.
Conclusion
All of the numbers detailed in the above sections point to one inescapable conclusion: The state of things for U.S. workers right now is very strong.
Next month will mark 4 years since 20 million workers lost their jobs in a single month—by far the worst and most sudden collapse in the U.S. labor market since World War II. Based on the outcomes of the most recent recessions and recoveries, workers had little reason to be optimistic that they would be able to recover quickly, and even less reason to hope that they could come out of the COVID-19 recession stronger than they were before. But, by most metrics, that’s exactly what happened.
Of course, the gains of 2023 did not wipe out the many years of slow wage growth or poor job quality that so many Americans experienced during prior decades. Nor did it fully close the racial and gender gaps that persist in the U.S. labor market or fully reverse the pernicious rise in income inequality that has hampered the U.S. economy since 1980.
Even so, there are now more jobs and higher wages for workers than at almost any point in recent history. There are more people working, and more people leveraging their newfound power in the workplace. These gains are flowing especially to lower-wage workers, to workers of color, and to younger workers—groups that have so often been left out of previous economic recoveries. And the broader impact is that workers could be on the verge of an historic boom in productivity.
The bottom line is this—when policymakers enact laws and regulations designed to empower workers and foster and protect strong labor markets, then U.S. workers can enjoy more years like 2023, in which they made real progress toward an economy that delivers robust growth and shared prosperity.