On April 29, the Washington Center for Equitable Growth delivered a comment letter responding to a proposed rule from the Internal Revenue Service that would expand the amount of administrative tax data that is shared with the U.S. Census Bureau. In the letter, Equitable Growth’s Senior Fellow Austin Clemens explains that these data will greatly assist researchers in academia and at the Census Bureau across a range of subjects.
The U.S. Census Bureau has an impeccable record of protecting the privacy of U.S. citizens, and providing the agency with these additional data is consistent with law governing data sharing between the U.S. Department of the Treasury and the U.S. Department of Commerce. Equitable Growth strongly supports the proposed rule.
The launch of ChatGPT in November 2022 captured the world’s attention and illustrated the potential of generative Artificial Intelligence to instantly perform tasks long considered quintessentially “human.” Already, the technology can pass the bar exam, create professional-looking videos, and outperform most humans on a range of tests. In doing so, the technology is rapidly upending broadly shared assumptions about what kind of work technology can do now and into the future and what its enduring impact will be on U.S. workers and workers around the globe.
In forthcoming analysis for the Brookings Institution’s new project on AI and workers, my colleagues Mark Muro, Xavier de Souza Briggs, and I find that generative AI already boasts the potential to substantially disrupt a wide range of (even highly paid) occupations, from law to finance, customer service, engineering, marketing, creative industries, and administrative roles.
These rapid advances have left many U.S. workers wary about the potential threats AI poses to jobs and livelihoods in the United States. According to a recent Pew Research Center poll, most Americans believe that generative AI will have a major impact on jobs in the next two decades, and more believe it will hurt rather than help them in U.S. workplaces.
Yet how U.S. workers fare in this transition is not preordained by technological possibility alone. The impact of generative AI on the future of work and on U.S. workers themselves depends on the choices that employers, policymakers, technology companies, consumers, workers, and civil society make. These choices will shape what is most at stake for workers: whether they benefit from AI’s productivity gains, whether jobs will be enhanced, automated, or degraded, and whether prosperity will be broadly shared or captured by the few at the top.
It is possible for workers to shape the trajectory of AI. As I document in a new case study and worker storytelling series, the remarkable victory of Hollywood writers in 2023 to secure a first-of-its-kind contract that includes AI safeguards provides a blueprint for other workers and their union leaders across a range of sectors who may face similar threats to their livelihoods. By exercising their power, the writers established guardrails that protect their employment and compensation and ensure they benefit from AI’s gains.
Yet the replicability of their stunning success is hampered by the stark mismatch between the industries most exposed to generative AI and the sectors where workers have substantial union density and access to worker organizations. Today, only about 6 percent of U.S. private-sector workers are represented by a union—and the percentage is even lower in fields such as business and financial operations, the law, and science, technology, engineering, and mathematics—all of which are highly exposed to AI’s disruptive potential.
This mismatch underscores the importance of labor law reforms at the federal and state levels that enhance workers’ ability to exercise power in their workplaces. It also points to the need for a wider range of institutions—from worker groups to policymakers, civil society organizations, employers, industry, and consumer groups—to proactively open opportunities for worker voice, collaboration, and guardrails.
Recent history shows that unmitigated technological advancement can exacerbate inequality and cause lasting pain for workers and their communities. Whether generative AI in U.S. workplaces lives up to its potential to unlock new possibilities for U.S. workers and spread shared prosperity will depend on the ability of workers to shape it.
Interested in hearing more? Register to attend our upcoming event, “Research on Tap: Three Forces Shaping the 2024 Economy,” where panelists will discuss how powerful forces, such as climate change, generative AI, and economic inequality, are shaping the U.S. economy in this critical election year.
Four years after George Floyd was murdered in Minneapolis by three city police officers and the Black Lives Matter movement led large-scale protests across the country, workplaces across the U.S. economy are dropping their efforts to promote racial diversity, equity, and inclusion, spurred in part by recent U.S. Supreme Court decisions. This trend is dispiriting for a variety of reasons, not least because it threatens the future competitive strength of our nation’s manufacturing and services industries as they rapidly embrace AI and slowly but steadily adopt solutions to deal with climate change.
This retreat is especially concerning given that failing to recognize the full promise of equal opportunity in U.S. workplaces and society costs our economy dearly. In 2019, researchers at the Federal Reserve Bank of San Francisco found that “labor market disparities by gender and race cost the U.S. $2.6 trillion in foregone [Gross Domestic Product] in 2019, and we estimate that these annual costs will continue to grow, reaching $3.1 trillion in 2029.” And a Citigroup report in 2020 finds that “if four key racial gaps for Blacks—wages, education, housing, and investment—were closed 20 years ago, $16 trillion could have been added to the U.S. economy. And if the gaps are closed today, $5 trillion can be added to U.S. GDP over the next five years.”
The persistent racial bias and discrimination Black workers encounter up and down job ladders and across career choices should not come as a surprise in the wake of a powerful social movement such as Black Lives Matter. After all, the brief attempt at racial equity during Reconstruction after the Civil War was followed by nearly 80 years of Jim Crow legal discrimination against African Americans. The Civil Rights Movement of the 1960s was followed by the mass incarceration of Black men and women and continued discrimination in housing and workplaces over the next 60 years. And now the brief shining light on the baleful consequences of conscious and unconscious racial bias in workplaces in this decade is being dimmed by new legal restrictions on DEI programs and the loud backlash against the Black Lives Matter movement.
This latest convergence of historic economic and social discrimination with new technology and innovation means that new “gray areas”—the social, cultural, and relational patterns that allow racial bias and discrimination to persist in U.S. workplaces—could well hold back the full economic benefits of AI and solutions to climate change.
Constance also works in an organizational culture that talks about diversity but does so in a very “race-blind” fashion, leaving her colleagues oblivious to the overtly and implicitly racial challenges that she encounters. And without a culture that acknowledges racial inequality, there’s no language or mechanisms to deal with this conscious and unconscious bias.
Constance relates the challenges associated with trying to find someone to serve, as she puts it, as an advocate who can just help her navigate promotion, advancement, and leadership amid this race-blind discrimination. All of those career paths are really blocked to her, despite purportedly being in a very merit-based scientific field.
Yet pathways for solutions are there. Companies do not have to accept racial disparities that compromise productivity and employee well-being. But this fundamental DEI work has to be adapted and structured by organizations, and it has to be buttressed and supported by government policy.
Indeed, the opportunity to infuse diversity, equity, and inclusion practices and policies into the use of AI and technology by businesses and policymakers alike could not be more timely. The consequences of climate change are equally important to workers of color, especially those laboring in industries where climate change is a workday hazard. I really believe a bigger shift toward a national policy agenda where workers of all ideologies and backgrounds—and in all sectors of the economy—receive more support, rather than the direction we’re going in now, is achievable.
Interested in hearing more? Register to attend our upcoming event, “Research on Tap: Three Forces Shaping the 2024 Economy,” where panelists will discuss how powerful forces, such as climate change, generative AI, and economic inequality, are shaping the U.S. economy in this critical election year.
Across the U.S. economy, the risks posed by unchecked automated surveillance and management technologies are widespread—and growing. These technologies can sometimes be beneficial for workers, customers, and businesses alike. For instance, GPS tracking devices paired with panic buttons can help keep hotel housekeeping staff safe when facing possible harassment or assault. AI-powered cameras also can help proactively identify potential health and safety risks involved in operating heavy machinery and alert workers before they hurt themselves.
But automated surveillance and management technologies can pose risks to workers’ physical and mental health and undermine workers’ rights under equal opportunity, labor, and employment laws. Such risks are already playing out across the U.S. economy. Take these two examples, cited in responses to a recent White House Request for Information on Automated Worker Surveillance and Management,1 from workers in very different sectors of the economy: a call center at a financial institution and an Amazon.com Inc. warehouse:
“I spent 7 years working in a call center at a financial institution doing customer support, sales, and retirement planning … a huge amount of data was collected about my activities throughout the day … [electronic monitoring of time spent “on task” meant that] people went to great lengths to stay on schedule … if you got a call from your kid’s school or your bank, you couldn’t simply sign out and take the call. I and almost everyone I knew there frequently held our bladders for an uncomfortably long time because we didn’t have a break scheduled … I would not be able to do that job today. Due to the strictness of the adherence policy, and its incompatibility with a number of health conditions, pregnant people, single parents with young kids, and disabled people did not last long in these job roles.”
“I was a seasonal Amazon warehouse employee in 2019 at the Rialto, California fulfillment center … My Amazon job was the most physically and mentally exhausting job I have ever had. I walked in on my first day excited to be working there, but the joy quickly faded because of the model of working until you are hurt, driven by the use of technology to constantly track worker productivity … the surveillance system constantly monitors worker productivity, how many items we pack per second and per hour. If you have not scanned or moved a box for a couple of minutes, the system alerts a manager … It is really stressful and physically demanding to keep up … They never told us if we were making rate, so you are never really sure how well you are doing. Managers just told us to keep going. The pressure forces workers to work faster and faster.”
These vivid accounts illustrate how employers are increasingly using workplace surveillance to track workers’ activities and productivity. Researchers, responding to the same White House RFI, also drew attention to how faulty surveillance technologies can inadvertently discriminate against workers with disabilities if, for example, automated productivity tracking does not permit sufficient accommodations for workers whose disabilities affect their performance on such tracking schedules.
These technologies are being used by employers not only to surveil workers on the job but also to chill union organizing efforts and single out and discipline workers who take collective action. Cornell University researcher Kate Bronfenbrenner, for instance, finds that the use of surveillance by employers to monitor or investigate organizing drives has more than doubled over the past 20 years—and the use of such technologies is associated with lower union success rates.
While we lack gold-standard estimates of the prevalence of automated surveillance and management technologies because the federal government does not regularly collect such information and employers are not required to report the use of such technologies, suggestive evidence points to widespread adoption across different sectors. According to a 2022 investigation by The New York Times, eight of the 10 largest private U.S. employers tracked individual workers to assess their productivity.
Additionally, recent research cited in responses to the White House RFI by two labor scholars found that more than half of workers surveyed in the retail, warehousing, and telecommunications industries reported that their managers electronically monitor their productivity on the job. And, in a 2021 study, the worker-power-building nonprofit Coworker documented how the worker surveillance vendor market is large and growing.
Read collectively, the evidence indicates that the risks posed by automated surveillance and management technologies are large—and likely will continue to grow.
New legislation introduced by Rep. Christopher Deluzio (D-PA) in the U.S. House of Representatives—the Stop Spying Bosses Act—would take important steps to protect workers against misuses of automated surveillance and management systems and ensure these technologies are not used to undermine workers’ rights. The proposed law—which complements parallel legislation introduced in the U.S. Senate by Sens. Bob Casey (D-PA), Cory Booker (D-NJ), and Brian Schatz (D-HI)—also would create new capacity in the federal government to regulate new and evolving workplace technologies and their impacts on the U.S. workforce.
The bill takes three important steps forward. First, it would require employers to disclose to workers and the general public any workplace surveillance being conducted, including what is being collected, how it is being collected, the purposes for which it is being used (including if it will affect employment-related decisions), and whether the collected information is being transferred or sold to other entities. Employers also would need to share with workers when they make decisions on the basis of surveillance technologies and give workers a chance to contest those decisions if they were made erroneously—a critical step, given the many reports of workers being penalized on the basis of faulty automated decisions.
These disclosures would clarify for workers how their employers are using technology, helping to address the uncertainty that many workers feel about monitoring. Such uncertainty can create a chilling environment for workers as they fear taking actions that might trigger a backlash from their employers even if they are legally protected, such as actions in support of forming a union. These disclosures also would help the government, labor organizations, and researchers piece together a clearer picture of how prevalent automated surveillance and management technologies are in different industries and occupations, and study their adoption across firms.
Second, the bill would explicitly bar employers from using workplace surveillance to collect and act on certain types of information. Notably, employers could not use automated surveillance to single out workers who are trying to exercise their rights to form, join, or support a labor union or engage in collective workplace action. Nor could employers use surveillance technologies to collect health or disability information unrelated to workers’ jobs. And employers could not use surveillance to monitor workers while they are off-duty—an especially important provision, given concerns about employer surveillance of remote work that might be done in a worker’s home.
These protections for workers would provide, for the first time, explicit federal limits on employer surveillance and data collection and analysis. As it stands now, there is only a patchwork set of similar protections that vary across agencies, states, localities, and sectors of the U.S. economy.
Third, the bill would create a new office within the U.S. Department of Labor responsible for enforcing this law, including by conducting investigations, coordinating with other enforcement agencies in the federal government, and issuing new regulations. The proposed new office would be led by a new administrator, who could hire staff with expertise in technology, privacy, and labor issues and who could regularly consult with outside experts.
Creating a new federal office with an explicit mandate to enforce the provisions of this law would go a long way to building the capacity within the federal government to address the risks that automated surveillance and management presents. This step also would help keep the government responsive to new and evolving risks from such technologies in the future.
There are good reasons to consider bolstering existing enforcement capacity around labor issues, too, both as part of new legislation such as the Stop Spying Bosses Act and as part of the regular appropriations that the U.S. Congress provides to the federal government. U.S. Department of Labor subagencies, such as the Wage and Hour Division and the Occupational Safety and Health Administration, face the herculean task of enforcing protections for workers with limited resources and inspectors. The Wage and Hour Division, for instance, has around 1,400 employees protecting a workforce of more than 165 million U.S. workers.
The Wage and Hour Division and Occupational Safety and Health Administration could use existing laws to regulate the impacts of automated surveillance and management technologies, such as the extent to which workers’ health and safety is threatened in ways that could cause death or serious physical harm, or whether hourly workers are not paid for the work they perform. Yet these agencies have other competing priorities, making it challenging for them to tackle additional activities, which is why added capacity, staff, and resources would help address the negative effects from workplace surveillance and automated management technology.
Another action not included in the Stop Spying Bosses Act that would complement its objectives is support for the National Institute for Occupational Safety and Health—the primary federal research agency studying worker safety and health. Added support for this agency would enable it to investigate the issues that automated surveillance and management systems pose to workers’ well-being. High-quality research could then help inform enforcement and regulatory activities by the federal government, such as new Occupational Safety and Health Administration standards.
Even so, the Stop Spying Bosses Act is a much-needed step forward that would protect workers from employer surveillance and bolster the federal government’s ability to regulate the use of management technologies. Addressing the harms and risks posed by workplace surveillance would be good for workers’ well-being without removing the benefits that some technology can offer.
Did you find this content informative and engaging? Get updates and stay in tune with U.S. economic inequality and growth!
Among the many regressive and ineffective elements of the Trump administration’s Tax Cuts and Jobs Act of 2017, one provision stands out as the most convoluted, unfair, and ripe for abuse. Section 199A of the Internal Revenue Code delivered a 20 percent deduction to the “qualified business income” of pass-through business owners. Pass-through businesses were already complicated, lightly taxed, and often used for tax avoidance.
Section 199A, also known as the pass-through tax cut or qualified business income deduction, made matters worse, though it has been difficult to analyze in a rigorous way. Thankfully, a newly revised working paper helps fill the gap, illuminating with empirical specificity just how regressive and ineffective Section 199A has been since it first came into effect in 2018. In short, this paper, as well as recent analysis from other sources, find that:
More than half of the deduction’s benefits were captured by those in the top 1 percent by income in 2019, and 82 percent went to those in the top 10 percent.
By a ratio 45-to-1, the benefits of the deduction flowed disproportionately to White households, compared to Black ones, and it is likely that beneficiaries also skew male and old.
Pass-through owners artificially adjusted the amount of labor income declared on their tax returns to maximize their qualified business income deduction, a costly form of tax avoidance.
The pass-through tax cut did not produce an increase in business investment, jobs, wages, or output.
Despite claims that the deduction would spur small business hiring, 45 percent of Section 199A deductions were generated by businesses that had no actual employees.
This issue brief will dive into these findings in more detail. It first provides some background on how Section 199A works, and then details recent estimates of who benefits and how much it costs. Next, it analyzes how certain taxpayers are gaming the system to maximize their deductions, then reviews findings on the provision’s lack of effect on real economic activity. The issue brief closes with a policy recommendation that Section 199A be allowed to completely expire as scheduled at the end of 2025.
How Section 199A works
How “qualified business income” is defined and who is eligible for the deduction are extremelycomplicated, and were the subject of intense, conflict-ridden lobbying both in the run-up to the passage of the Trump tax cuts in 2017 and in the writing of accompanying regulations.
An overly simplified summary is that qualified business income includes all business income other than wages, capital gains, and dividends (note that the latter two income categories already receive preferential treatment when “passed through” to owners), and that all pass-through business owners who make less than $191,950 are fully eligible.2 For those who make more than this amount, there are still a number of ways to receive at least a partial deduction, including by:
Not being engaged in a “specified service trade or business,” or SSTB, an inexact attempt to exclude professional services firms that rely on the reputation or skill of workers, such as lawyers, doctors, financiers, and consultants. To qualify, these high-income non-SSTB businesses must also either pay out a substantial amount of wages or have invested in a substantial amount of capital assets, such as real estate.4
Section 199A is also available, without limit, to those receiving real estate investment trust dividends and income from publicly traded partnerships, a major carve-out that helps high-income investors qualify for Section 199A despite being in otherwise-excluded professions and above the income thresholds.5
Who benefits, and at what cost?
Section 199A was a large, expensive tax cut, costing the federal government $415 billion over 10 years, according to the Joint Committee on Taxation estimate at the time of passage. A more recent estimate from the committee put the cost at $174.2 billion just between fiscal years 2023 and 2025. In fiscal year 2025 alone, the U.S. Treasury Department expects Section 199A to cost $65.2 billion, making it the seventh-largest tax expenditure in the tax code that year.
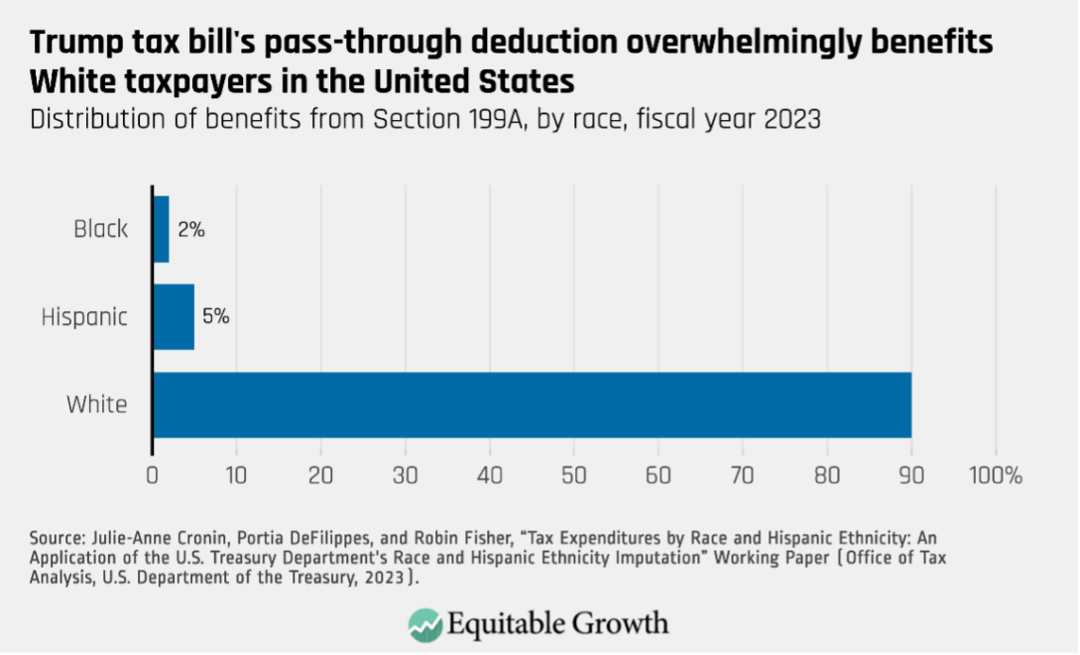
This tax cut also was one of the most regressive provisions in the Trump tax bill since it targets benefits at already-wealthy business owners, who are disproportionately old, White, and male. In fact, an analysis from the Treasury Department estimates that 90 percent of Section 199A’s benefits in fiscal year 2023 will accrue to White households in the United States, compared to 5 percent accruing to Hispanic households and 2 percent to Black households. (See Figure 1.)
Figure 1
White households also received a larger benefit, averaging $410, compared to $91 for Hispanic households and $49 for Black households. Like all deductions, Section 199A is worth more to higher-income taxpayers who face higher marginal tax rates. According to investigative reporting by ProPublica, Section 199A delivered $1 billion in tax savings to just 82 ultrawealthy households, including a $67.9 million windfall to billionaire and former New York City mayor Michael Bloomberg.
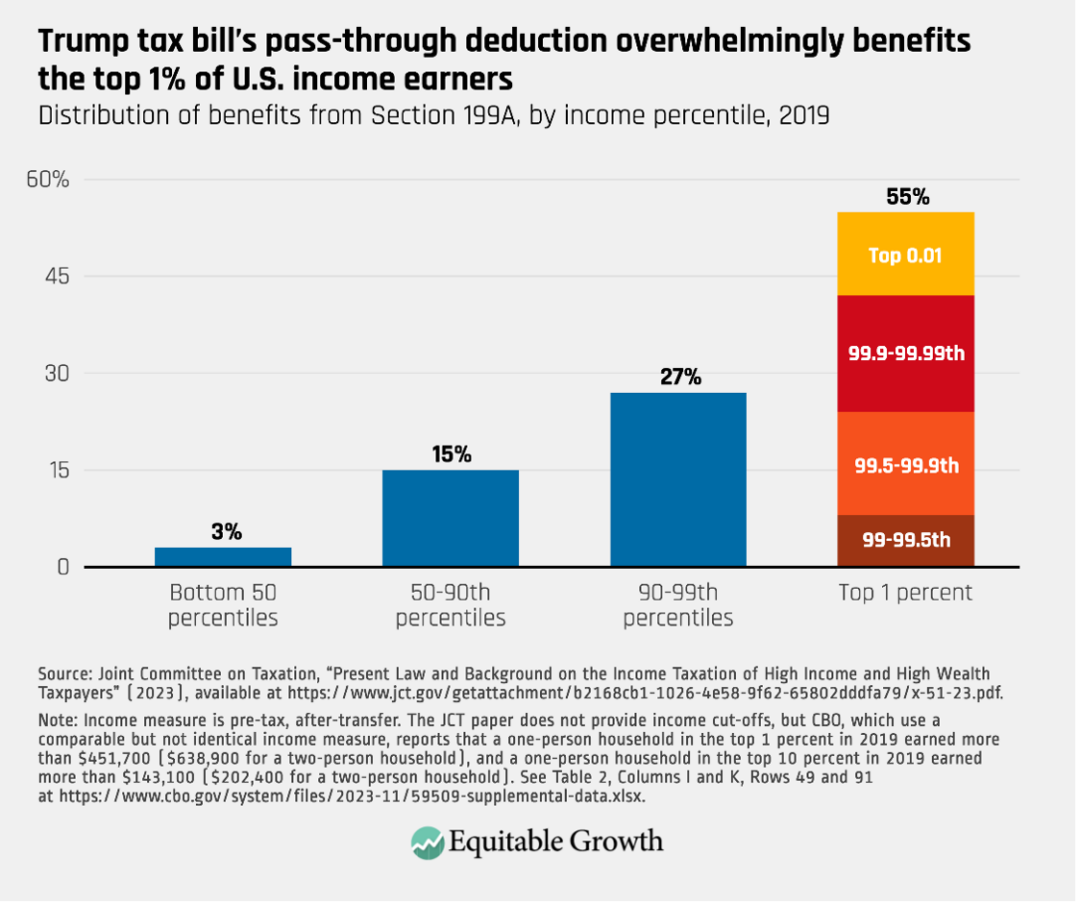
A recent distributional analysis of the Section 199A deduction, which mimics one that was simulated right after the tax bill passed, finds that 55 percent of the benefits were captured by those in the top 1 percent by income in 2019 (roughly $638,900 for a two-person household) and 82 percent went to those in the top 10 percent (roughly $202,400 for a two-person household). (See Figure 2.)
Figure 2
One reason for these regressive distributional findings despite the provision’s restrictions on high-income taxpayers is that those restrictions are ridden with loopholes. Additionally, the deduction’s phase-out threshold uses “taxable income” as the relevant metric, rather than the higher and more accurate “adjusted gross income.”6 Taxable income is generally calculated by reducing adjustable gross income by the $14,600 standard deduction, or a higher amount of itemized deductions.7
There also is evidence that a high proportion of lower-income taxpayers who are eligible for Section 199A did not claim it, likely due to the deduction’s complexity.8
In addition to being skewed toward high-income earners, it is likely that certain industries, such as construction and real estate, benefit disproportionately from Section 199A, while the phase-out rules substantially limit the deduction for the professional services, health, finance, and insurance sectors.
How are certain taxpayers gaming the system?
All of the aforementioned complexity built into Section 199A means there is ample opportunity for lawyers and accountants to help their wealthy business-owner clients further minimize their tax bills. Even before Section 199A, there was strong evidence that pass-through owners often mischaracterize labor income as business income in an attempt to avoid self-employment taxes. Section 199A only increased this perverse incentive, and there have been anecdotal accounts, based on investigative reporting, that executives have been exploiting this loophole.
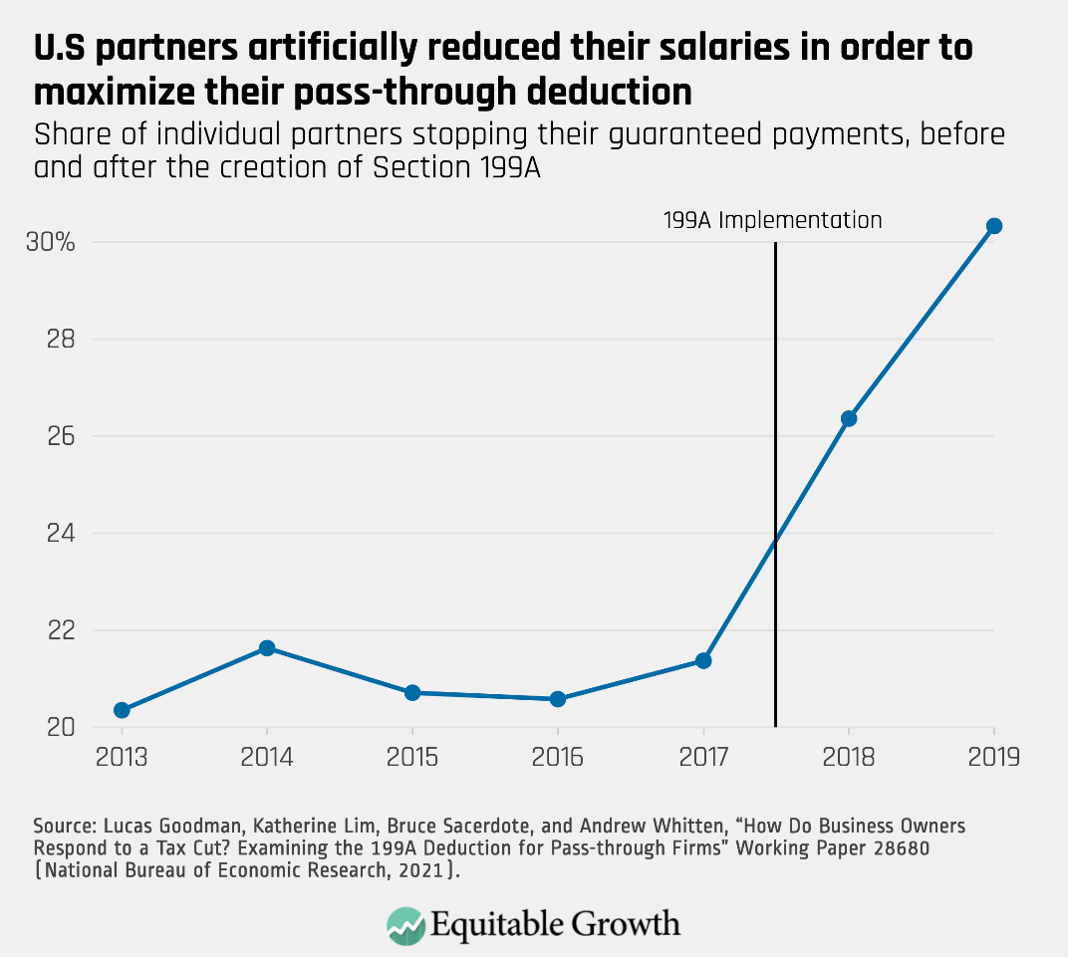
Now a newly revised working paper authored by Treasury Department economists Lucas Goodman and Andrew Whitten, Katherine Lim from the Minneapolis Federal Reserve Bank, and Bruce Sacerdote from Dartmouth College brings empirical specificity to the question. The researchers use administrative tax data and sophisticated econometric techniques to show that pass-through owners artificially adjusted the amount of labor income declared on their tax returns to maximize their qualified business income deduction. The research reveals that, as a result of Section 199A, many partners reduced or altogether stopped paying themselves “guaranteed payments,” a term of art for labor income that is not eligible for the pass-through deduction, so that income would instead flow to owners as profits, which is eligible. (See Figure 3.)
Figure 3
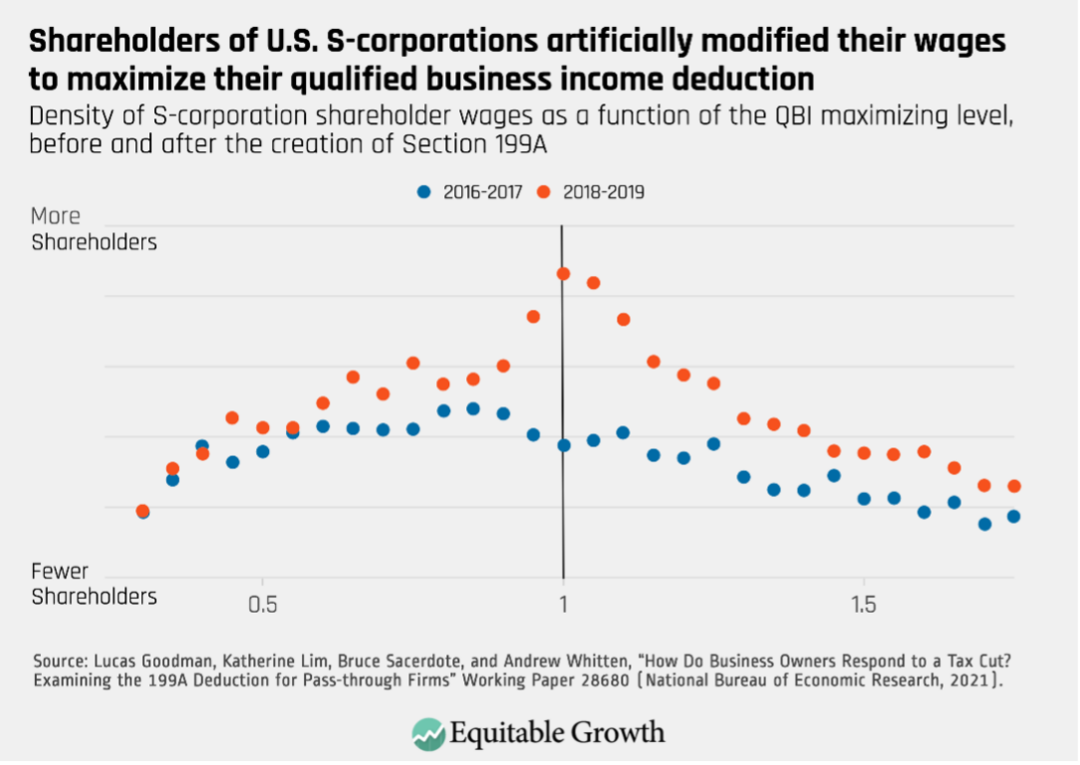
The same researchers also demonstrated how S-corporation shareholders exploited a flaw in Section 199A’s design. The flaw allows these business owners—who also are often considered employees of the corporation—to increase their own wages and count those wages toward the phase-out exception granted to firms that pay a certain amount to employees in order to qualify for a larger pass-through deduction.
The four researchers calculated what the qualified business income maximizing rate of shareholder wages would be for each firm—since wages are not themselves eligible for this deduction, S-corporation shareholders will only want to pay themselves the amount of wages that meets the phase-out exception threshold and no more—and then tested whether more firms did in fact pay that amount in the years immediately after Section 199A was created. There is strong evidence that S-corporation shareholders are using this ploy, which is a form of pure tax avoidance without any economic substance, to maximize their qualified business income deduction and reduce their tax liability. (See Figure 4.)
Figure 4
This working paper also finds evidence of business owners modifying their purported industry in order to qualify for the Section 199A deduction. As mentioned above, high-income owners of “specified service trades or businesses” are excluded from receiving the deduction. So, to test if high-income business owners were changing how they were describing their industry after Section 199A was created, the researchers zoomed in on S-corporation owners who described themselves as “consultants,” one of the restricted professions, in the 2 years before Section 199A went into effect.9
The researchers find that those same taxpayers were nearly four times more likely to claim they worked in a non-SSTB industry in the 2 years after Section 199A went into effect. These owners also were more likely to claim a non-SSTB industry than a control group of similarly situated low-income owners who would qualify for the deduction no matter what industry they were in. Though not dispositive, this is suggestive evidence that taxpayers are gaming the new deduction, claiming to be working in eligible industries in order to qualify for the deduction without actually responding to the new incentives in any substantive way.
There also is anecdotal evidence of pass-through firms splitting in two so that the parts of the business that qualify for the qualified business income deduction on their own do so. This often involves sophisticated legal and accounting maneuvers to get around the deduction’s income limits. The recent working paper was not able to cleanly test for these so-called cracking-and-packing tactics.
These efforts at tax avoidance are not costless. A rough estimate from the Tax Foundation put the compliance cost in 2021 for taxpayers who claimed the Section 199A deduction—including hours spent preparing their returns and money spent on tax professionals—at $17.8 billion. Considering the Section 199A deduction was a worth a total of roughly $51.8 billion in benefits to taxpayers that year, these represent very high administrative costs.
The risk that some workers would change their labor status from W2 employees to 1099 independent contractors in order to take advantage of Section 199A has not materialized, likely in part because Treasury regulations were strict on this issue (as well as the many labor law protections and other benefits associated with being a W2 employee).10
Section 199A’s effect on the economy
Section 199A did not produce a boom in U.S. business formation, job creation, or economic dynamism, to the extent that the provision’s proponents even offeredthese as rationales. In fact, the same recent working paper finds that Section 199A had no impact on real economic activity—no increase in tangible investment, no increase in the number of nonshareholder employees, and no increase in total employee wages over the first 2 years the policy was in place.
The results for 2020 and 2021 are more mixed, in part because the econometric techniques the researchers use lose power as they get further away from the moment of policy change and in part because of the many conflating factors introduced by the COVID-19 pandemic beginning in early 2020. The researchers nevertheless conclude that “taken together, the results suggest it is unlikely that large increases in capital and labor investments occurred due to the deduction in the first [four] years it was available.” This finding is somewhat corroborated by Joint Committee on Taxation’s analysis of 2021 tax records, which finds that 45 percent of Section 199A deductions were generated by businesses that had no actual employees.11
This was a very predictable outcome. In 2012, Kansas experimented with a similar reform, excluding self-employment and pass-through business income from the state income tax (and reducing income tax rates) in the name of promoting economic growth and increasing employment, especially among small businesses. That experiment unequivocally failed. A number of rigorousstudies find that the reform did not produce any of the promised benefits, but instead led taxpayers to artificially reclassify income so that more would qualify for the exclusion—and reduced state revenue to such an extent that the legislature reversed the policy 5 years later.
Some proponents of Section 199A claimed it was needed to keep pass-through businesses competitive from a tax perspective with C-corporations, which received a very large tax cut in the 2017 Tax Cuts and Jobs Act. Even with the pass-through deduction ultimately included in the bill, some analysts predicted it would lead to a “mass conversion” of pass-throughs incorporating to take advantage of the lower C-corporation tax rate. Though there is some limitedevidence of certain S-corporations switching to C-corporations after the passage of the 2017 bill, switching of that kind seems to be rare.
One likely reason is that the taxconsiderations associated with choosing an organizational form are highly idiosyncratic and complex. The tax treatment of C-corporations, for example, becomes more favorable for their shareholders if firms retain earnings rather than distributes dividends, or if their early investors are eligible for the qualified small business stock exclusion, a potentially lucrative—and highly flawed—tax break on capital gains. Pass-through owners, in contrast, can often benefit from self-employment tax and net investment income tax loopholes unavailable to C-corporations.
The ideal tax system would be perfectly neutral between business forms, thus ensuring that tax policy is not distorting business decisions. Under the current system, though, someresearchsuggests that many productive pass-through firms choose to remain artificially small—unable to access public equity markets because of their pass-through status—purely for tax reasons. This acts as a drag on hiring and economic growth. Our recent factsheet on pass-throughs goes into greater detail on these points.
But outside of creating a new integrated business tax regime, achieving the ideal of complete parity between business forms is challenging. And Section 199A only makes things morecomplicated, putting a higher premium on unproductive tax planning.
What can policymakers do about Section 199A?
Section 199A is scheduled to expire at the end of 2025. Extending the provision would cost between $700 billion and $980 billion over 10 years (from 2026 to 2035), and, according to the Tax Policy Center, another $722 billion between just 2036 and 2040. Extending the provision in its entirety would also violate President Joe Biden’s pledge that he will not extend Trump tax cuts for those making more than $400,000.12
Allowing the deduction to expire will mean a tax increase on pass-through business owners, but the evidence predicts that the high-income owners themselves will shoulder the vast majority of that burden, reducing inequality.
It also will only get politically harder over time to rescind the provision as more and more taxpayers come to expect it. And it could become a bigger problem in the future, potentially undermining other progressive reforms by being used as an escape hatch to reduce taxes for rich taxpayers who will get more creative at converting wage income into qualified business income.
Based on the evidence above, it is clear that Section 199A is an ineffective, expensive, and regressive tax provision, and, as such, it should be allowed to expire in full.
Acknowledgements
I would like to acknowledge the invaluable assistance I received in writing this factsheet from Samantha Jacoby, Gregg Polsky, and Jean Ross. All errors are my own.
Did you find this content informative and engaging? Get updates and stay in tune with U.S. economic inequality and growth!
In recent years, so-called pass-through businesses have taken center stage in a number of crucial tax policy debates. This large and growing category of U.S. business—which includes sole proprietorships, partnerships such as law firms, private equity companies, and hedge funds, and S-corporations such as retail stores, banks, and other private, closely held companies—receive special tax benefits. Pass-throughs also received a large, regressive tax break known as the qualified business income deduction, or the Section 199A deduction, as part of the Tax Cuts and Jobs Act of 2017.
Why do these tax preferences exist for pass-through businesses? Are they justified? This factsheet dives into existing academic evidence on the rise of pass-throughs and how their lax regulation and low taxation contribute to U.S. income and wealth inequality, as well as efficiency losses that are a drag on overall U.S. economic growth. This factsheet also looks at opportunities for tax avoidance and evasion, which many pass-through owners take advantage of, draining critical resources from the public fisc.
Though this factsheet is focused on federal tax treatment of pass-throughs, it is important to note that state tax treatment can be different, including entity-level franchise fees, withholding requirements, and, more recently, the option of entity-level taxes in order to help pass-through owners circumvent the cap on the state and local tax deduction instituted in 2017.
First, let’s turn to the basics: What is a pass-through business?
What is a pass-through business?
All businesses in the United States that are not C-corporations are treated as “pass-throughs” for purposes of federal taxation. These businesses’ profits (and losses) are “passed through” to the owners, who pay taxes on the business via their personal income tax. C-corporations, in contrast, pay a corporate income tax at the entity level, and then C-corporation shareholders generally pay a second tax if and when they either sell their stock for a “capital gain” or receive a dividend.
The form the income takes when earned by the pass-through business—such as capital gains from investments and ordinary income from general business operations—remains intact when it flows to the owner’s personal tax return, meaning pass-through business owners often pay different tax rates on their different types of income and, for ordinary income, face the progressively structured individual income tax.
Pass-through businesses are able to take many of the same tax deductions to which C-corporations are entitled, such as write-offs for employee wages, equipment depreciation, investment in research and development, and other miscellaneous expenses such as business-related meals. But owners of pass-through businesses must pay tax on their businesses’ incomes in the year that they are earned, even if that income is never actually distributed to owners. Allowing business owners to indefinitely defer tax on undistributed profits, as owners of C-corporations are generally allowed to do, would incentivize inefficient “capital lock” and turn pass-through structures into tax shelters.
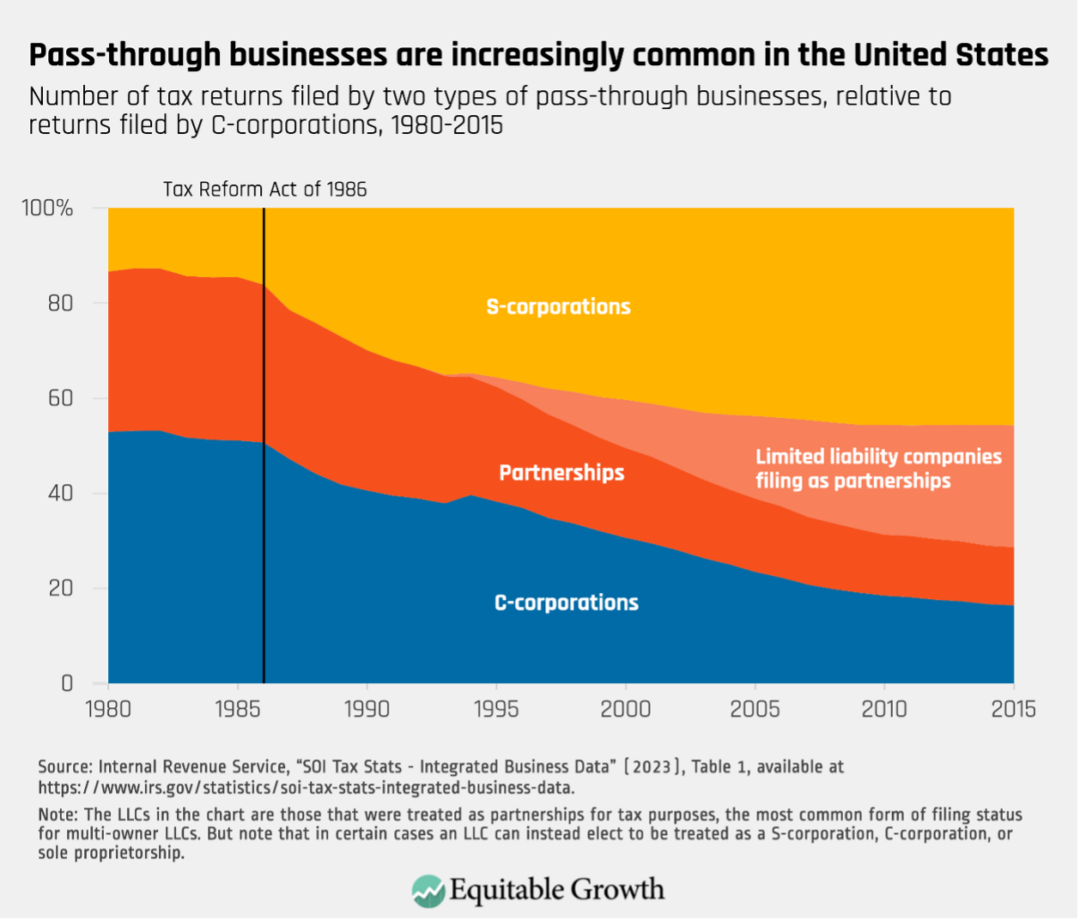
Since the 1986 tax reform bill—which made pass-throughs more attractive by drastically lowering individual tax rates—pass-throughs have become by far the most popular business type in the United States. In 1985, 51 percent of business tax returns, not including sole proprietorships, were filed by C-corporations; in 2015, that figure had plummeted to 16 percent. Pass-throughs have made up the difference, exploding in popularity in part because of the advent of limited liability companies in the 1990s, which, in their multi-owner form, are usually treated as partnerships for tax purposes. (See Figure 1.)
Figure 1
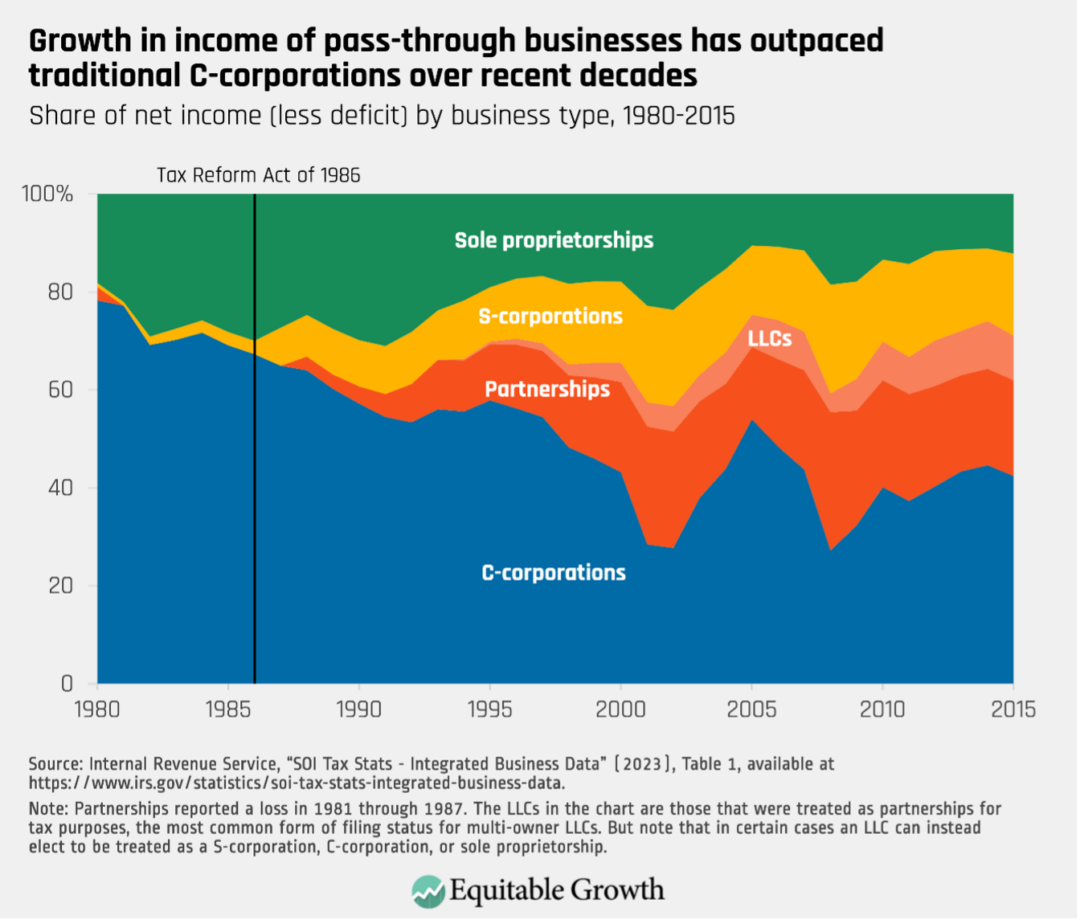
According to tax records—which are probably providing underestimates—pass-throughs earned $1.57 trillion in total net income in 2015.13 That income was generated by 33.4 million tax units, or 95 percent of all business returns. By comparison, 1.6 million C-corporations14 earned a total of $1.15 trillion in net income that same year. (See Figure 2.)
Figure 2
In 2021, pass-throughs employed 43 percent of the U.S. workforce and 35 percent of total U.S. payroll.15 The United States is an outlier in its widespread use of pass-throughs: It ranks second among the advanced-economy member nations of the Organisation for Economic Co-operation and Development for share of noncorporate businesses at 15 percentage points above the OECD average, which does not include S-corporations, since those are technically still a corporate legal form.
What are the different types of pass-through businesses?
There are three main types of pass-through businesses: sole proprietorships, S-corporations, and partnerships.16 Limited liability companies are usually treated as partnerships for federal tax purposes or, if they have only a single owner, as a sole proprietorship, referred to by tax practitioners as a disregarded entity17
Sole proprietorships
A sole proprietorship is a business run by a single individual or a married couple.18 These businesses generally pay income tax on their business earnings via Form 1040 Schedule C of their owners’ individual tax returns. The types of businesses that file as sole proprietorships are quite varied and include lawyers, contractors, taxi drivers, insurance agents, home healthcare workers, and restaurateurs. Indeed, in 2021, the most popular sectoral classification for sole proprietorships was “other services,” which includes personal and laundry services and auto repair and maintenance, among many others.
There are a lot of sole proprietors in the United States, but they tend to be very small in terms of total income and assets, compared to other business types. In 2021 (the most recent year for which the IRS has released data), there were 29.3 million sole proprietor returns with a total net income of just $411 billion (averaging roughly $14,000 of income per sole proprietor).19 In 2020, sole proprietor profits amounted to 21 percent of total business receipts.
S-corporations
S-corporations have a larger number of shareholders than sole proprietorships, but no more than 100 owners. All owners must be U.S. individuals holding the same class of stock, not foreigners or other business entities. The firms most likely to file as S-corporations are in professional, scientific, and technical services (16.3 percent), construction (13 percent), or real estate and rental and leasing (11.2 percent).20
In 2017 (the most recent year for which the IRS has released complete data), there were 4.7 million S-corporation returns.21 In total, these businesses declared $578 billion of net income and held $4.5 trillion in assets.22
Partnerships
Unlike S-corporations, shareholders of partnerships need not be individuals, but instead can be corporations or other partnerships, which themselves can have other corporations and partnerships as shareholders. Partnerships can also easily switch to C-corporation status should that become advantageous, whereas it is much more difficult for C- and S-corporations to change into partnerships.
Many different types of businesses are treated as partnerships for tax purposes, including limited liability companies (71.7 percent of all partnerships in 2021), general partnerships (12.6 percent), limited partnerships (9.9 percent), and limited liability partnerships (3.2 percent).23 More than half of partnerships are in the real estate and rental and leasing sector, but partnerships in the finance and insurance sector earn the most total net income and hold the most assets.
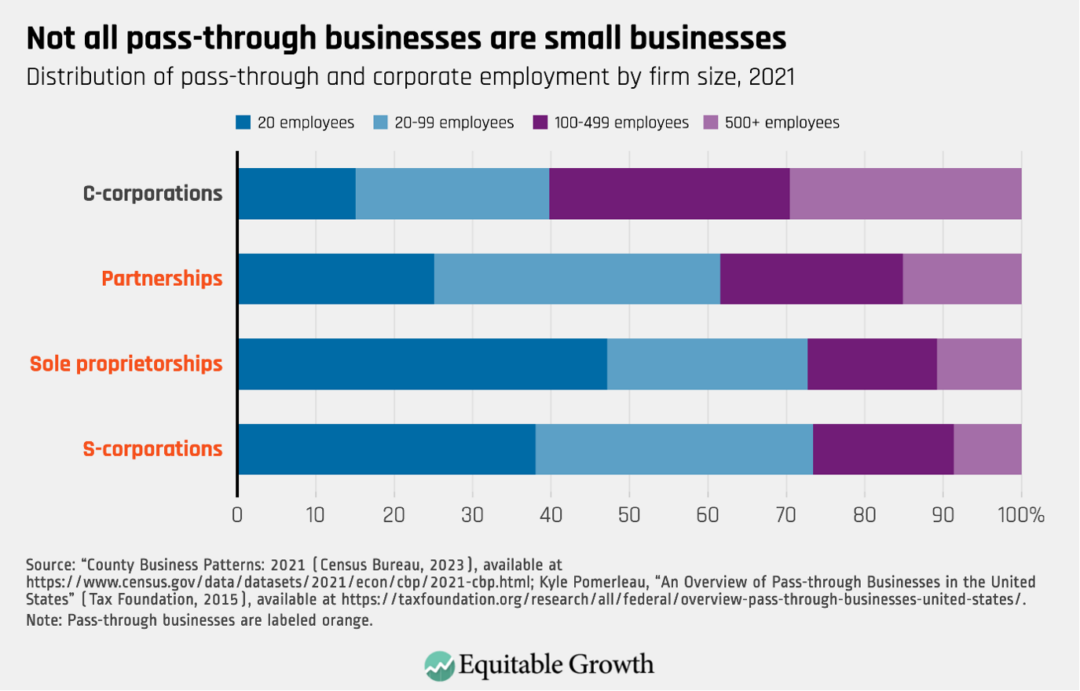
This is a common misconception. While pass-through businesses tend to be smaller both in terms of their number of employees and earnings than C-corporations, there are several exceptions. (See Figure 3.)
Figure 3
In fact, some of the most profitable firms in the United States, even including some publicly traded companies, are pass-throughs.25 Activist investor Carl Icahn’s conglomerate Icahn Enterprises, for example, is a publicly traded partnership, as is the gas pipeline behemoth Energy Transfer. Indeed, many oil and gas companies are structured as master limited partnerships, a special form of pass-through business. And, as variousinvestigativereportshaverevealed, many large and highly profitable privately held companies—including ABC Supply Co. (roofing), Bechtel (engineering), Blackstone Group (finance), Bloomberg (media), Carlyle Group (finance), Georgia-Pacific (paper), Fidelity Investments (finance), Kinder Morgan (energy), KKR (finance), MidFirst Bank (finance), Oaktree Capital Management (finance), Pretium Partners (real estate), RMR Group (real estate), StoneMor (funeral services), certain Trump Organization companies (real estate), Uline (packaging), and WeatherTech (auto supplies)—are pass-throughs.
This hasn’t stopped pass-throughs from claiming “small business” status in political debates, exploiting the fact that there is no universally accepted definition of “small.”26 But when U.S. Treasury Department researchers attempted to estimate the number of legitimately small business entities in 2010, they identified 22.2 million pass-through filers,27 which is just more than half of all pass-through returns that claim some business activity.28 These bona fide small businesses account for just 26 percent of net pass-through business income, and only 4 million of them, or fewer than 1 in 5, employ any workers.29 This means that, in 2010, just 1 in 4 dollars in pass-through net income was earned by a bona fide small business, and fewer than 1 in 10 pass-throughs were both legitimately small and employed even a single worker.
In 2010, just 1 in 4 dollars in pass-through net income was earned by a bona fide small business, and fewer than 1 in 10 pass-throughs were both legitimately small and employed even a single worker.
Why are pass-throughs advantageous from a tax perspective?
One major reason pass-throughs have grown in popularity is their tax treatment.30 While C-corporations face both an entity-level tax (the corporate income tax of 21 percent) and a shareholder-level tax on dividends (20 percent if “qualified” and received by a high-income investor) and capital gains (20 percent if sold by a high-income investor after holding longer than one year),31 pass-throughs only face one level of tax. This tax has historically been lower than the combined C-corporation rate, even for those owners in the highest marginal income tax rate bracket (currently 37 percent).32
In fact, one analysis of partnerships in 2011 estimated that those businesses face an average effective tax rate of just 15.9 percent, largely because partnerships in the finance sector can classify much of their income as capital gains and can deduct various expenses and losses. Considering that the Tax Cuts and Jobs Act of 2017 lowered taxes for pass-through firms, this number is likely even lower today.
How does the rise of pass-throughs contribute to U.S. economic inequality?
Owners of pass-through businesses tend to be White, male, and older—demographic groups that already earn more than their non-White, female, and younger peers. They also tend to be high-wealth individuals: In 2023, it is estimated that 20 percent of the top 1 percent’s total assets are in “private businesses,” a category that largely overlaps with pass-throughs. This amounts to 53 percent of all private business assets.33
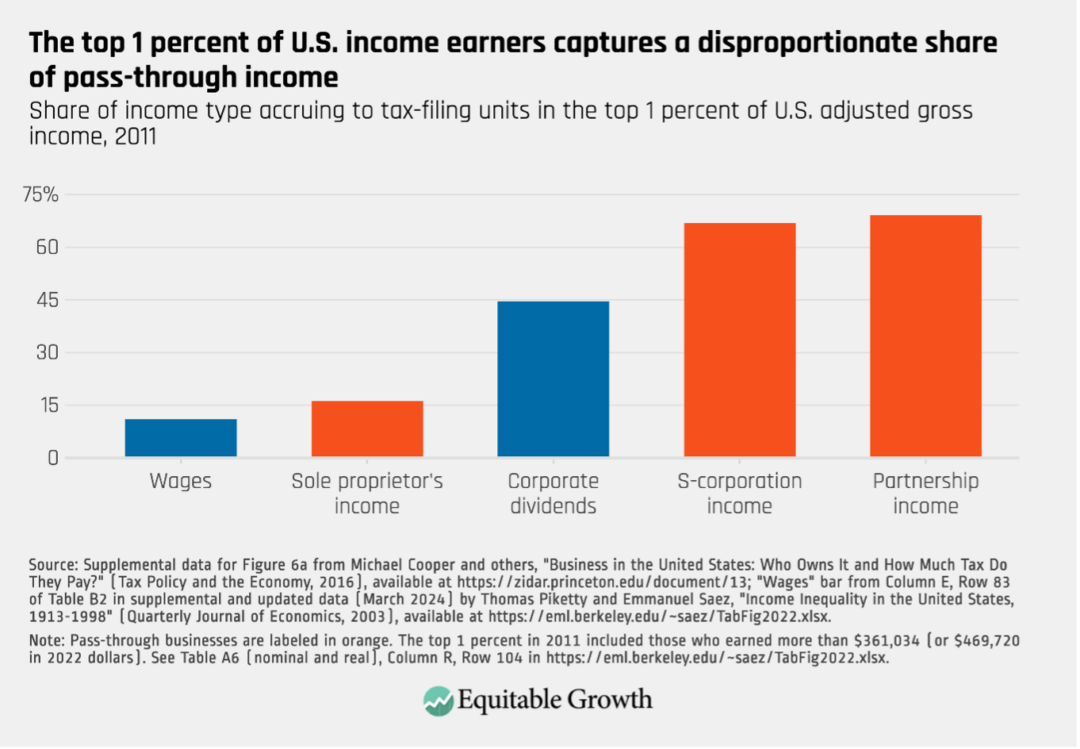
Pass-through owners not only tend to come from wealthy backgrounds but also tend to have high incomes. A Congressional Research Service analysis from 2011 finds that 63 percent of pass-through income was earned by taxpayers with an adjusted gross income higher than $250,000, and 32 percent was earned by individuals with an AGI of more than $1 million. The Joint Committee on Taxation estimates that the top 0.01 percent earned 35 percent of its total income via pass-throughs in 2019, whereas the bottom 90 percent received just 9 percent of its income via pass-throughs. An academic analysis of 2011 tax returns finds that 69 percent of partnership income and 67 percent of S-corporation income accrued to the top 1 percent (those making more than $361,034) that year.34 (See Figure 4.)
Figure 4
Before 1986, most profitable firms were organized as C-corporations. After the tax reform of 1986, however, rich business owners began converting to—or began new firms as—pass-throughs to take advantage of the lower tax on owners.
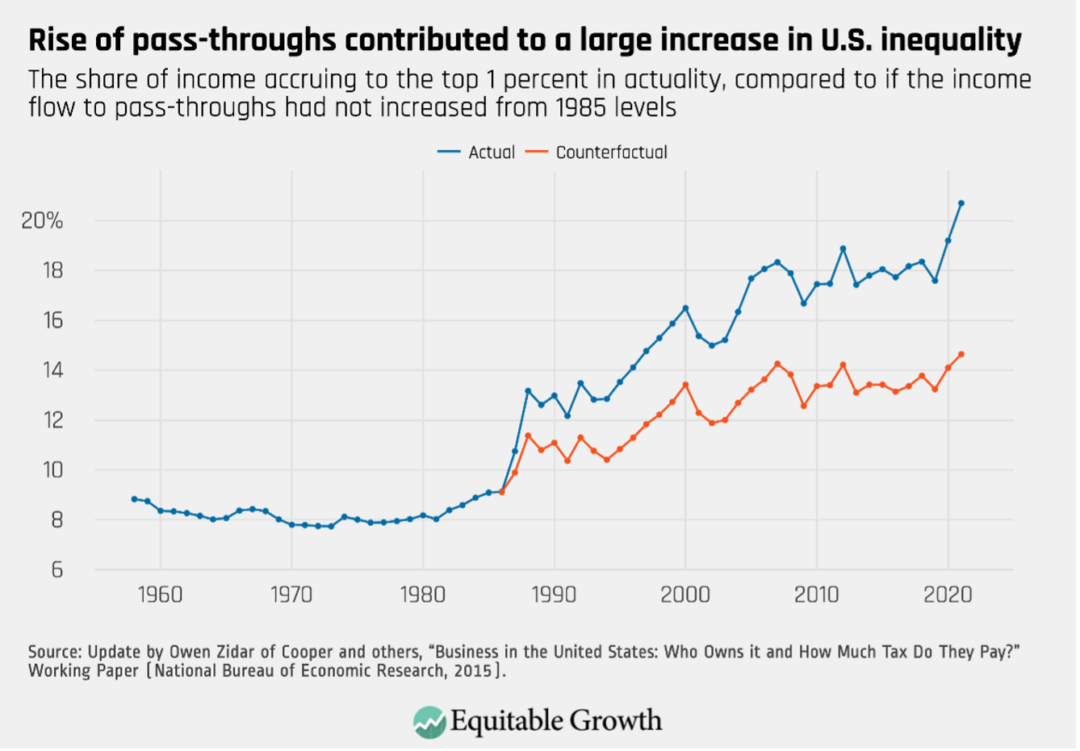
Not surprisingly, then, the rise of pass-throughs has contributed to an explosion in income inequality in the United States, as the rich earn more and pay less in taxes. One rigorous analysis from researchers at Princeton University, the University of Chicago, the University of California, Berkeley, and the U.S. Treasury Department finds that 52 percent of the increase in the income share going to the top 1 percent between 1985 and 2021 came in the form of higher pass-through business income.
In other words, if pass-through income had stayed at its 1985 level, the top 1 percent’s income share would be up just 5.55 percentage points, compared to 1985, from 9.09 percent to 14.64 percent. Instead, the top income share skyrocketed 11.61 percentage points over that period, from 9.09 percent to 20.7 percent. (See Figure 5.)
Figure 5
Another study from 2019 finds similar results, noting that the pass-through-fueled increase in U.S. inequality is not simply a matter of the form in which the income happens to be generated and reported on tax returns, but also the result of real economic phenomena, including reduced overhead costs for pass-throughs, higher fractions of profits being distributed to pass-through owners, and riskier investments taken on by pass-throughs (to compensate for a less diversified capital raise), compared to C-corporations.35
How has the rise of pass-throughs undermined tax enforcement and contributed to tax avoidance and evasion?
Pass-throughs can be complicated legal structures, and current tax law allows pass-throughs many opportunities for game-playing to reduce federal tax burdens. The result is low audit rates and high levels of tax avoidance and potential evasion.
Partnerships also take advantage of lax rules around partner contributions of capital or labor to the business, as well as allocations—how tax gains and losses are distributed—to engage in sophisticated tax planning.37 Two classic examples of this are:
The now well-documented “carried interest” loophole, which allows partners of investment firms to be paid for services in the form of long-term capital gains rather than wages, reducing high-income partners’ income tax rate and completely eliminating their self-employment tax liability.
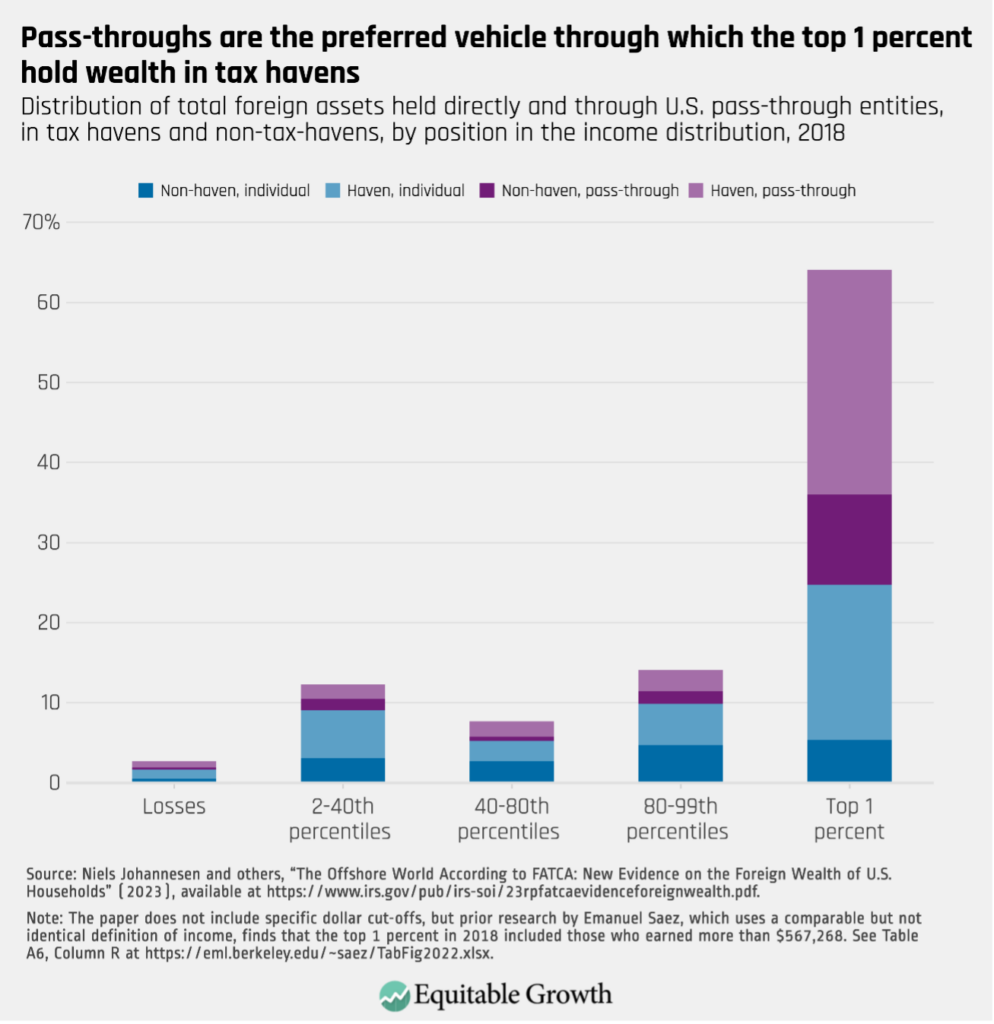
So-called blocker corporations in tax havens, through which partnerships, particularly private equity firms and hedge funds, can funnel money to shield foreign investors from filing and paying U.S. taxes and to prevent tax-exempt investors, such as pension funds and university endowments, from paying unrelated business taxable income.38 These schemes are powered in part by highly flexible “check the box” rules that allow business entities to choose their organizational form for tax purposes. The same firm can select partnership status for the United States and corporate status for a foreign jurisdiction. This is likely one of the reasons why one recent study using new data from the Foreign Account Tax Compliance Act, or FATCA, finds that partnerships are the preferred vehicle through which excessively rich Americans hold wealth in tax havens. In fact, 64 percent of U.S.-owned foreign wealth is held by the top 1 percent, 61 percent of which is funneled through pass-throughs. (See Figure 6.)
Figure 6
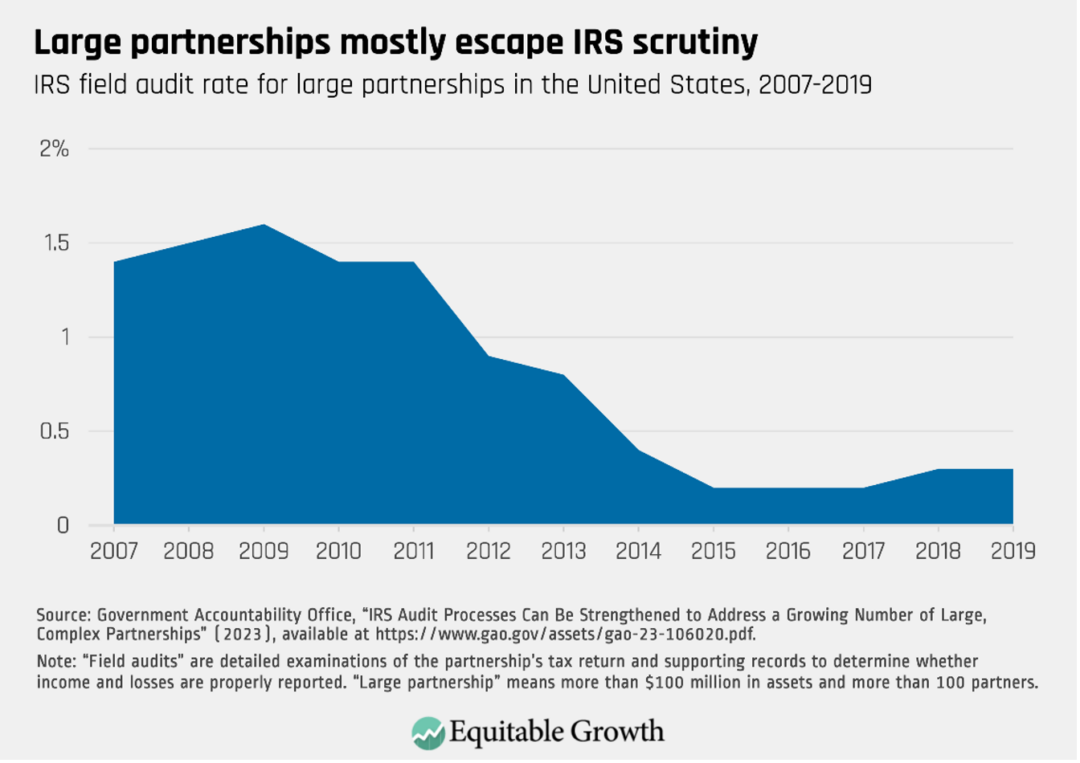
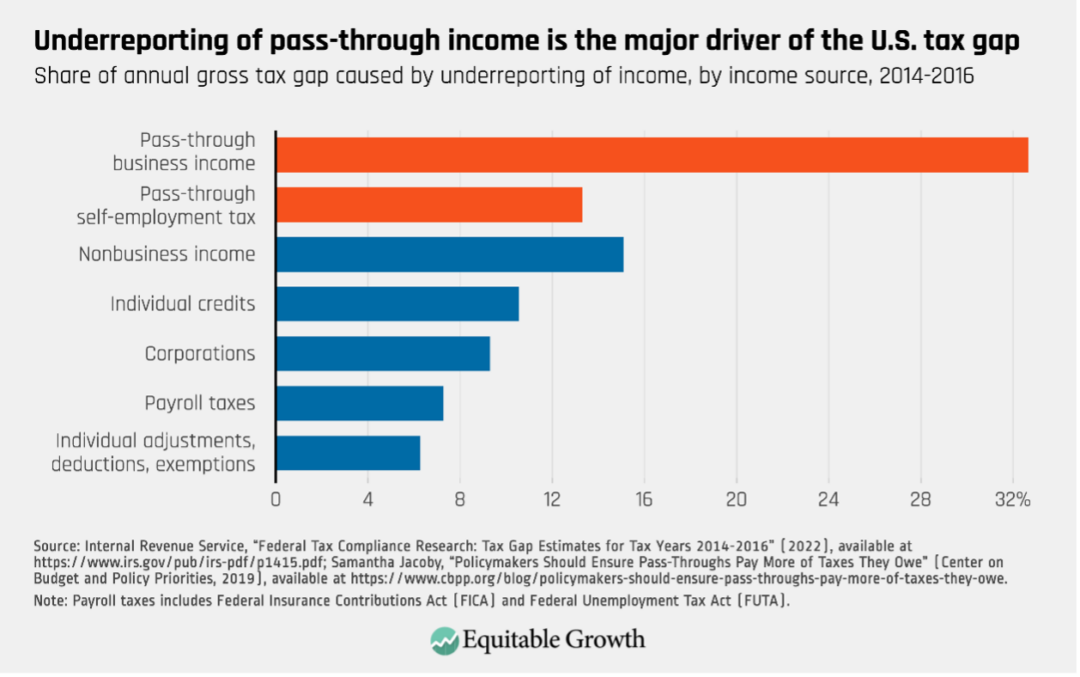
These findings are consistent with other evidence that tax evasion is prevalent among large,39 complex partnerships, which are veryrarely audited by the IRS.40 (See Figure 7.)
Figure 7
New audit procedures that went into effect in 2018, alongside additional funding for the IRS as part of the Inflation Reduction Act of 2022, may close some of these enforcement gaps.41 One promising enforcement tactic is the use of sophisticated machine-learning, nonlinear models to identify potential underpayment. Academics have shown that these approaches are superior to traditional linear prediction models at identifying tax evasion by partnerships.
S-corporations are also problematic from a tax compliance and enforcement standpoint. Many service companies, such as law firms and doctors’ offices, often miscategorize their owners’ labor income as business income to avoid self-employment taxes.42 Famously, former U.S. Sen. John Edwards (D-NC), former U.S. Rep. Newt Gingrich (R-GA), and President Joe Biden have all taken advantage of this loophole. Self-employment taxes help pay for Medicare and Social Security, so this ploy drains resources from those critical social insurance programs.43 Limited partnerships are also able to play this game, though it’s not as straightforward and has been the subject of tougher IRS scrutiny.44
How has the rise of pass-throughs affected the overall U.S. economy?
Low tax rates on rich business-owners and loophole-laden tax regulations for pass-throughs are not just bad for equality and tax compliance, but also for the overall U.S. economy. It means fewer resources are available to invest in productivity- and growth-enhancing public programs, such as universal child care, high-quality public education, and green technologies.
In addition to draining the federal government of much-needed resources, this trend toward pass-throughs has negative efficiency effects, keeping businesses artificially small and capital constrained. This is because most pass-throughs are not able to be listed on public stock exchanges, putting them at a disadvantage in terms of raising capital. Some academic researchers have modeled this effect, including:
Katarzyna Bilicka and former AEA Summer Economics Fellow at the Washington Center for Equitable Growth Sepideh Raei, both from Utah State University, find that eliminating the artificial tax difference between C-corporations and pass-throughs, while keeping total revenue collected constant, would boost aggregate economic output by 1.3 percent due to a more efficient allocation of capital as the most productive firms choose to be C-corporations rather than pass-throughs.
Sebastian Dyrda from the University of Toronto and Benjamin Pugsley from University of Notre Dame estimate that the Tax Reform Act of 1986 pushed the most productive firms—and those firms with the richest active owners—to pass-through status, leading each firm to reduce its employment growth by an average of 1.86 percentage points, reducing employment across the U.S. economy by 0.8 percent and reducing aggregate output by 1.1 percent.46 The same authors also helpfully point out that more than three-quarters of all pass-through establishments are nonemployers, belying claims that pass-throughs are engines of job growth.
Daphne Chen from Econ One Research, Inc., and Shi Shao Qi and Don Schlagenhauf from Florida State University find that funneling productive businesses toward the pass-through structure also probably costs the economy jobs because C-corporations are less capital-constrained and can thus do more hiring.
A separate study from Florida State’s Qi and Schlagenhauf looked at a policy in Kansas that eliminated the state tax on pass-through income, concluding that the reform likely led more businesses to organize as pass-throughs instead of C-corporations, which would explain the reduced output, reduced capital formation, and reduced employment growth experienced after the reform took effect in the state.
There also is an efficiency cost to the amount of time, effort, and money that goes into pass-through tax planning. Many investment funds, for example, expend considerable expense to set up multiple partnerships and blocker corporations to maximize tax savings. The cost of these activities, which serve no real business purpose and could be better spent on any number of other productivity-enhancing endeavors, are what economists call deadweight loss.
How can policymakers improve the taxation of pass-throughs?
There are strong efficiency, fairness, and anti-evasion arguments for equalizing the tax treatment of different business forms. Completeharmonizationbetween C-corporations and pass-throughs, which would require a substantial rewrite of the tax code, is unlikely in the near term.
Even so, some more immediate policy actions could include:
Fully funding enforcement efforts at the IRS
Closing the “carried interest” loophole, something the most recent Biden administration budget proposes47
Closing self-employment tax loopholes, also something the most recent Biden administration budget proposes48
Allowing Section 199A—a large, unjustified tax break for pass-through business owners—to expire as scheduled at the end of 2025
Acknowledgements
I would like to acknowledge the invaluable assistance I received in writing this factsheet from Karen Burke, Jason DeBacker, Sebastian Dyrda, Zorka Milin, Gregg Polsky, Kyle Pomerleau, Daniel Reck, and Owen Zidar. All errors are my own.
Did you find this content informative and engaging? Get updates and stay in tune with U.S. economic inequality and growth!
A new report from the National Academy of Science’s Committee on National Statistics is packed with recommendations for building an integrated system of national statistics that can provide accurate and timely measurement of the distribution of income, consumption, and wealth in the United States. Implementing this report’s recommendations would supercharge policymakers’ understanding of U.S. inequality and provide them with critical economic intelligence for steering the U.S. economy.
There’s not nearly enough room here to provide a summary of all the panel’s findings, but this column provides some context on the importance of this report and its proposals, while summarizing a few of the panel’s findings. It also briefly touches upon areas for future research that can support the goal of a federal system of integrated income, wealth, and consumption data.
The importance of a unified system of income, consumption, and wealth data
Just as importantly, in the context of an integrated set of statistics, these three metrics are related to one another by the so-called budget identity of “income = consumption + change in wealth.” That is, the amount households consume, plus the amount they save (which is their change in wealth) must add up to their incomes each year.
This identity is fundamental to understanding household well-being in the United States. If, for example, we look only at consumption data, then a household that spends $60,000 in a year might seem to be doing well. But if that consumption was financed by only $40,000 in income, then it dramatically changes our view of that household’s well-being. They must either have existing wealth to fund this deficit or else are incurring debts that may lead to reduced well-being in the future.
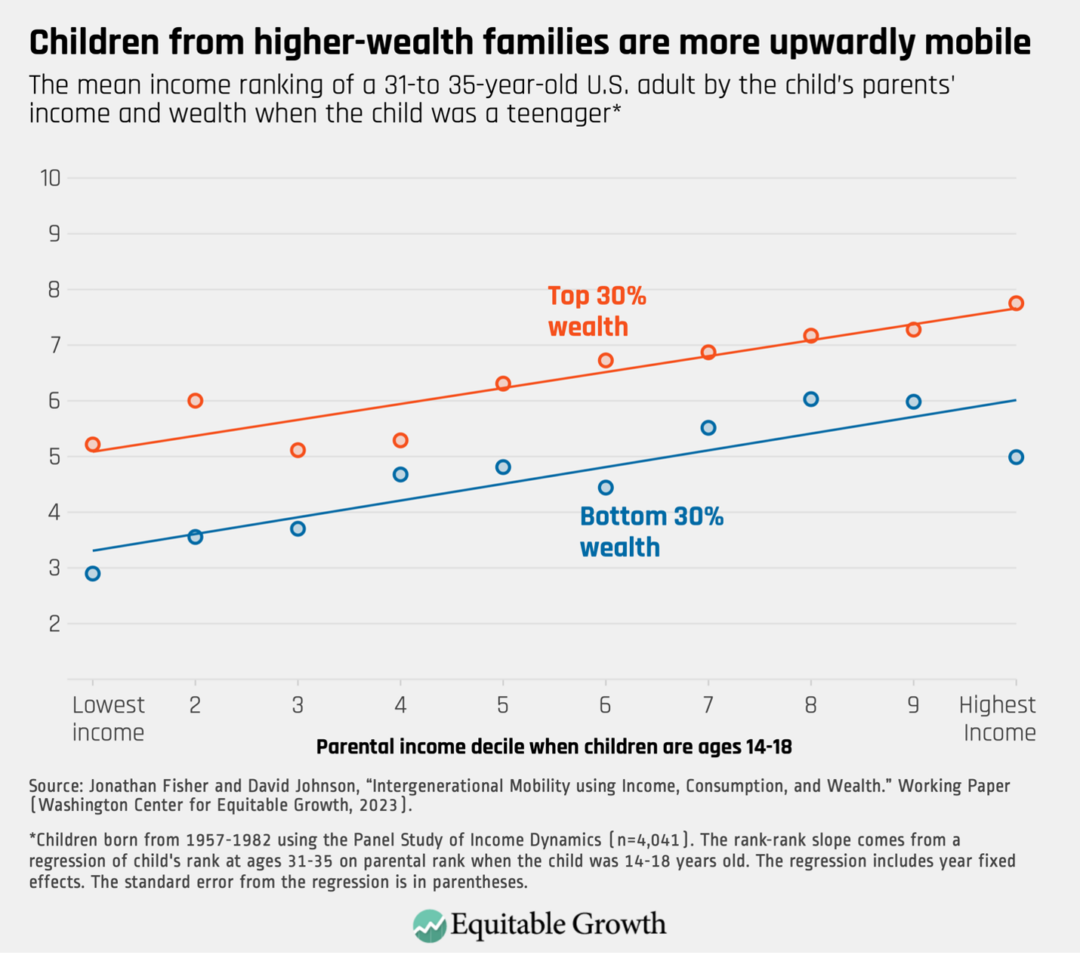
These considerations are what motivated recent Equitable Growth-funded research by Jonathan Fisher (now an economist at the U.S. Census Bureau) and David Johnson (who led the Committee on National Statistics study) into economic mobility across income, wealth, and consumption. That research unearthed important findings that are only apparent when all three metrics can be observed.
Fisher and Johnson find that children of wealthier parents are more upwardly mobile than less wealthy peers in the same income bracket. A child born to parents who are in the bottom 30 percent of wealth and the fifth decile of income, for example, will, on average, reach the 48th percentile of income by the time they are between the ages of 31 and 35 years old. If, however, that same child’s parents are instead in the top 30 percent of the wealth distribution, then the child can expect to reach the 63rd percentile of income—a difference of 15 percentiles. (See Figure 1.)
Figure 1
This finding adds useful context to previous economic mobility research, such as the findings from Harvard University’s Raj Chetty and his co-authors that the proportion of U.S. children who earn more than their parents has fallen from 90 percent for children born in 1940 to 50 percent for children born in 1980. This finding examines only the income of parents and children, while an integrated system of statistics, with distributions of income, wealth, and consumption, would greatly expand our understanding of economic inequality and mobility in the United States by allowing researchers to tap all three areas of financial well-being rather than looking at each separately.
A guide and a research agenda
The new study from the Committee on National Statistics provides a useful guide for federal statistical agencies to modernize and integrate how they measure these three important concepts. To understand the current state of the federal statistical system in relation to these concepts, this might be the best single place to start because the report is replete with tables that provide detailed guides to the types and quality of data available in the federal statistical system.
The report’s recommendations are similarly comprehensive. It urges federal statistical agencies to focus on data features that have been particularly in demand among researchers since the beginning of the COVID-19 pandemic in early 2020, such as estimates for small geographic areas, estimates for various demographic groups, and data that are released on a consistent and timely basis. The recommendations also suggest pathways for improving current distributional products, including the U.S. Bureau of Labor Statistics’ Distribution of Personal Consumption Expenditures, the U.S. Bureau of Economic Analysis’ Distribution of Personal Income, and the Census Bureau’s new National Experimental Wellbeing Statistics.
Chapter 5 of the Committee on National Statistics report will be of particular interest to academic economists. The chapter digs in on the methods and options for creating an integrated system of statistics that conforms to the committee’s recommendations in prior chapters. There are several technical challenges that require more research, including linking methods, imputation, and alignment with national accounts concepts and the budget constraint.
The report calls for pilot studies to investigate some of these challenges. On page 5–26, for instance, the panel suggests various pilot studies, including on: “expanding [the National Experimental Wellbeing Statistics] to include in-kind transfer programs, health benefits, income taxes, and capital gains;” [using] “commercial data to improve consumer expenditure data in the CE survey;” or [comparisons] “of the consumption (or spending) estimates using the budget identity.” Researchers with access to Census Bureau Research Data Centers can contribute to this effort.
The Committee on National Statistics also expresses an interest in an experimental public-domain system of statistics created using publicly available data that could be investigated by researchers. Such a dataset could serve as a bridge to a more comprehensive dataset based on administrative data. It could also be a testing ground for data-linkage techniques that would be useful in the construction of the more comprehensive dataset.
Implementing the report’s recommendations will, of course, require resources. Yet federal statistical agencies are perennially under resourced. And when federal budgeting turns contractionary, as it recently has, statistical agencies are often casualties.
The Committee on National Statistics’ new report is a valuable roadmap to developing statistics that will give us a better understanding the distribution of resources in the United States—if policymakers can muster the will to follow it and fund the agencies that will carry it out. Developing an integrated system of income, consumption, and wealth data will open a wealth of possibilities for researchers seeking to understand policy and household well-being, and will guide policymakers as they work to address the inequalities pervasive throughout the U.S. economy.
Did you find this content informative and engaging? Get updates and stay in tune with U.S. economic inequality and growth!
Editor’s note: This version has been updated from the original publication on April 15, 2024. The update corrects a prior underestimate of the revenue potential from graduated corporate tax rates resulting from the treatment of tax credits.
This issue briefhas been excerpted with minor modifications from a more extensive treatment of these issues in “Capital Taxation and Market Power,” to be published in the forthcoming Spring 2024 issue of Tax Law Review, Issue 77, Number 2.
Overview
Rising market power in the United States and around the world calls for changes to our nation’s international corporate taxation system. The importance of market power today suggests that corporate tax policy should distinguish between normal returns to capital and above-normal returns to capital, the latter of which is a telling indicator of corporations’ market power. This distinction has important consequences for the efficiency and equity of capital taxation.
Market power, alongside long-understood tax administration criteria, strengthens an already-strong case for entity-level taxation. The corporate tax has the potential to distinguish companies based on the magnitude of their reported profits—the larger the company’s taxable income, the more likely that a large share of their corporate tax payments are above-normal returns. The implementation of a graduated corporate tax rate system, presented in this issue brief, has the potential to act as a constant nudge, tilting the playing field in favor of more competitive markets.
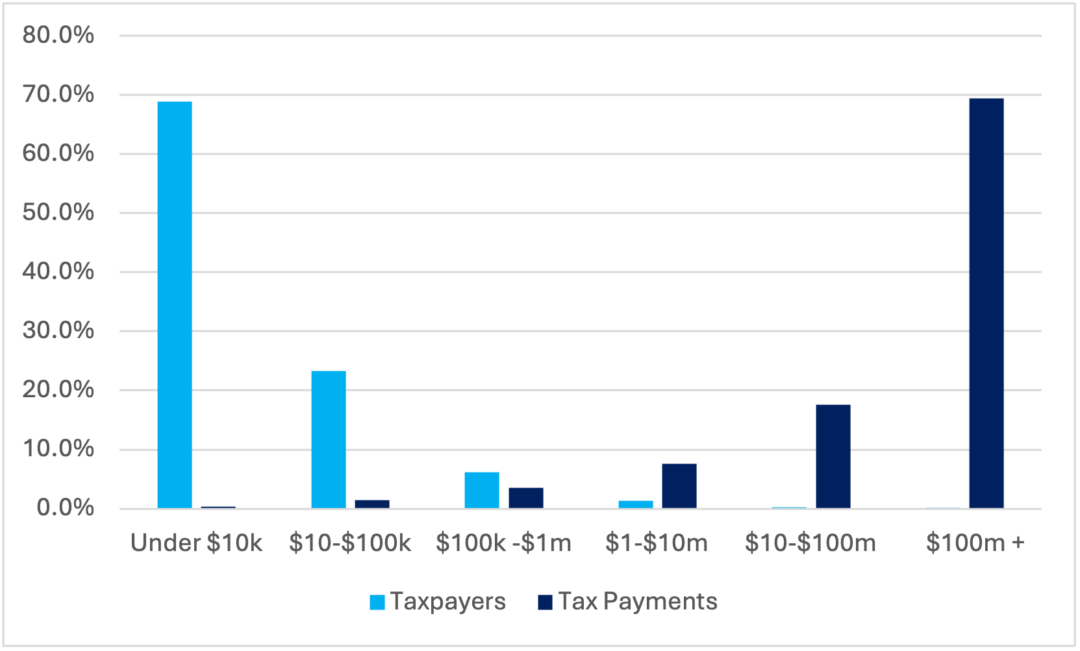
Data indicate that the U.S. corporate tax base is very concentrated. In 2019, about 350 companies (out of about 500,000 filers with positive tax liability) account for nearly 70 percent of the corporate tax base. Even among these top companies, total profits are skewed toward the largest companies. Analysis within my working paper, to be published in the Spring 2024 issues of Tax Law Review, suggests that the revenue gains from a graduated rate structure could be substantial, while affecting less than one-half of 1 percent of corporations.
Any proposal to raise corporate income taxes on the largest, most profitable companies will invariably spark questions about global profit shifting, and, indeed, international tax reform has an important role to play in enabling consideration of a graduated U.S. corporate tax system. The largest multinational companies often pay particularly low effective tax rates, due to features of U.S. international tax law that facilitate and incentivize their ability to shift taxable income toward low-tax jurisdictions. To tax these large companies, international tax reforms are needed to make the corporate tax base less tax-elastic.
In this regard, recent advances in international tax cooperation are an encouraging development. In 2021, more than 135 countries representing about 95 percent of the world economy reached a political agreement to levy minimum taxes on multinational companies, and recently, major countries have moved to implement that agreement. The agreement also includes a feature—the undertaxed profits rule—that will encourage adoption by other jurisdictions in the years ahead.
This type of international tax cooperation is crucial for resolving longstanding global collective action problems that have often resulted in a shift of the tax burden away from capital and toward labor or consumption, and, importantly for the topic of this issue brief, paves the way for an anti-monopoly corporate tax in the United States.
Defining market power
Economists often distinguish between two types of firms when considering how to define market power. “Perfectly” competitive firms earn no “economic profit,” or above-normal (excess) returns, but they do earn enough “accounting profit” to pay the normal returns to capital and labor. The free entry and exit of firms in marketplaces assure that, over time, these perfectly competitive firms earn just the amount required to cover normal returns but no more than that. Perfectly competitive firms do not have any control over the prices they face in the marketplace; they are “price-takers.”
In contrast, “imperfectly” competitive firms face downward-sloping demand curves for their output, meaning they have some control over the prices they charge in the marketplace. Imperfectly competitive firms may, in some cases, earn profits above the amount required to cover normal returns to labor and capital, generating economic profits (or excess returns). Firms may accumulate market power due to high barriers to entry into marketplaces, collusion with would-be competitors, or simply the normal economic actions of dominant firms.
In this issue brief and in my working paper, I use the term “market power” to capture situations where firms operate under conditions of imperfect competition, recognizing that there is a wide spectrum of possible outcomes, and market power becomes more policy-relevant when deviations from the perfectly competitive outcome are larger.
Market power and corporate taxation
In recent decades, and especially since 1990, the U.S. economy has experienced growing market concentration, alongside the increased market power of dominant companies. This trend of increasing market power has been sustained and substantial, and it has occurred across a broad swath of U.S. industries. These trends have important implications for the U.S. economy, affecting the bargaining power of firms relative to workers, inequality, consumer welfare, the efficiency of capital allocation, and the broader functioning of markets.
Increasing market power also has important implications for tax policy. Longstanding tax analyses that treat capital taxes as falling on the “normal” return to capital have efficiency implications that are very different from those that hold if capital taxes instead fall on profits above the normal return to capital. The incidence of capital taxes also depends on whether they fall on normal or excess returns. The optimal rate of capital taxation depends crucially on such efficiency and incidence considerations.
The ideal form of capital taxation also depends on these distinctions. Alongside administrative rationale, market power considerations strengthen the argument for the corporate tax as an important tool for achieving capital taxation goals. Further, market power considerations buttress the case for a graduated system of corporate tax rates.
The large role of market power reinforces the already-powerful case for tackling international tax competition and countering international tax avoidance. While international tax reform entails balancing the competing goals of tax base protection with the competitiveness concerns of domestic multinational companies, recent improvements in international tax cooperation make that trade-off less stark. Further, the policy relevance of such competitiveness concerns is impacted by the presence of market power.
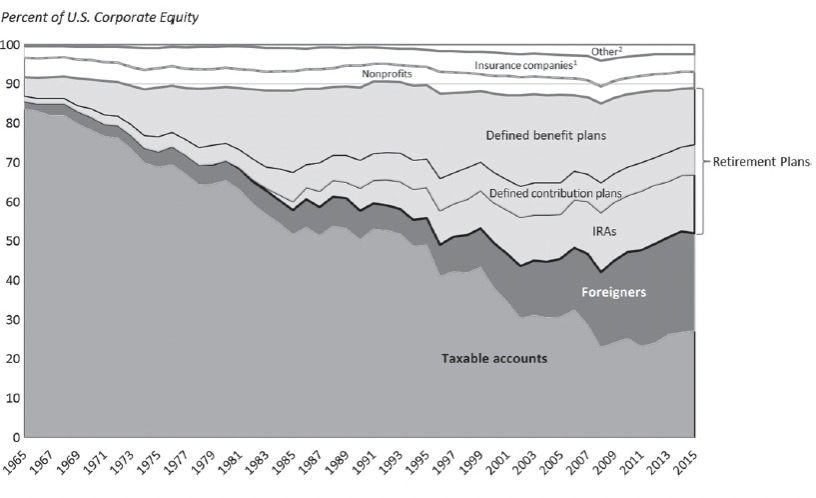
The importance of market power strengthens the argument for taxing capital income at the entity level, rather than the individual level, though there are already important reasons to favor taxation at the entity level. First, entity-level taxation is simply more comprehensive. About 70 percent of all U.S. equity income is completely untaxed by the U.S. government at the individual level. Why? Because this income is either held by untaxable entities, such as nonprofit endowments, or in untaxed accounts, including retirement accounts, pensions, and college savings accounts, or in foreign hands whose governments may or may not tax that income. (See Figure 1.)
Figure 1
Ownership of U.S. corporate stock, including both direct and indirect holdings, 1965 to 2015
Unless many popular tax preferences are reconsidered, much of the capital income tax base is unreachable if one is limited to the individual layer of taxation. Further, the entity level of taxation is the only way to reach most foreign investors in U.S. equity markets. These investors also benefit from the features of the U.S. economy that generate U.S. equity income, so the entity layer of tax is one way to ensure that foreign investors contribute to financing the relevant government services.
Second, even for those accounts that are taxable by the U.S. government, the taxpayer has substantial discretion over when, and indeed if, capital taxation occurs. While corporate dividends may trigger immediate taxation, capital gains are only taxed at realization, so taxpayers can defer taxation (allowing funds to grow free of tax) indefinitely. Further, if assets are held until death, they qualify for a “step-up” in basis, so that capital gains escape taxation entirely. Any shares donated to charity will also escape taxation.
Finally, entity-level taxation can also serve as an important backstop for the individual income tax, preventing those individuals with discretion from channeling funds into corporations, retaining earnings, and obtaining lower tax rates as a consequence. The more the corporate rate falls below the top individual rate (or pass-through rate), the more the corporate form acts as a tax shelter.
Beyond these rationales, the presence of significant and rising market power makes the argument for the corporate tax stronger. The corporate tax has long played an important role as a regulatory device. Governments can use the tax system to influence the behavior of corporate actors. Corporate investment is spurred through rounds of bonus depreciation, research and development is incentivized through the R&D tax credit, and other activities such as clean energy, low-income housing, and the development of orphan drugs (treating rare diseases) are encouraged through general business credits.
In a similar manner, the more that the corporate tax base overlaps with a tax base that is solely excess profits, the greater the efficiency justification for the corporate tax. Taxing excess profits generates government revenue, allowing society as a whole to share in the fruits of the exercise of market power (or the fruits of luck or risk-taking), without deterring investment or economic activity. Indeed, if the corporate tax fell onlyon excess profits, one could justify (on efficiency grounds) much higher tax rates than today’s 21 percent rate, especially if one could address international mobility issues.
Prior to the 2017 Tax Cuts and Jobs Act, there was a modest graduated rate in the corporate tax rate structure, but most of the corporate tax was paid by corporations that were at the top marginal rate of 35 percent, which applied at the $10 million income threshold. A slightly lower 34 percent marginal rate applying for income between $75,000 and $10 million, and lower marginal rates of 25 percent and 15 percent applied for income below $75,000 and $50,000, respectively.
Since 2018, the corporate tax has been levied as a flat 21 percent rate. There is a good argument for a flat rate of tax. Unlike the individual income tax, a graduated rate in the corporate arena need not improve progressivity. For instance, we do not know that wealthier people are more likely to own shares in the most profitable corporations (as opposed to less profitable ones), relative to those lower in the income distribution. Thus, a graduated rate structure is an indirect (and potentially ineffective) way to achieve progressivity goals.
Yet the larger the company’s taxable income, the more likely that a large share of their corporate tax payments are above-normal returns. In my working paper, I detail why the U.S. tax code provides favorable or neutral treatment to many types of investment (subsidizing debt-financed investment and allowing expensing or favorable depreciation regimes in many instances), such that there is a large overlap between the corporate tax base and a tax base on rents. Thus, companies that comprise a large share of the corporate tax base are also likely to be those earning rents. Further, the Fortune or Forbes lists of the most profitable companies show that many of them benefit from large market shares, and many are in fields—such as technology, pharmaceuticals, or finance—where intangible capital (the normal return to which is untaxed) is an important source of value.
Since taxing above-normal returns is both more efficient and particularly likely to burden shareholders, a higher tax rate may be justified. By contrast, for less profitable companies, more of the corporate tax burden may fall on investment or labor.
Beyond these favorable incidence effects, a graduated corporate tax can also discourage size itself, as well as the accumulation of economic power, which has negative consequences for the broader economy. A graduated rate does not distinguish among the causes of size—which could result from economies of scale, luck or first-mover advantages, risk-taking, access to some key resource, or other factors—but it does tilt the tax playing field against large-profit companies relative to small-profit companies, improving the competitive environment in a clear and transparent manner.
While a somewhat-higher tax rate will not prevent companies from becoming large, which may be warranted or even desirable in many instances, it will act as a marginal disincentive for mergers, acquisitions, and agglomeration itself.
European Union antitrust authorities have been active, and U.S. antitrust efforts appear to be on the rise, but it is difficult for antitrust law to address many prevalent instances of market power. Antitrust processes require due deliberation, focus on different criteria for market power, can be slow, and often act as a blunt on/off switch, rather than as a continuous policy lever. While company mergers have been blocked on occasion, and there have been instances of fines or regulation, antitrust remedies are generally infrequent.
Tax policy reform cannot replace antitrust policy (nor should it), but it can be a useful complement that provides a continuous policy signal in favor of a more competitive marketplace. A higher tax on more profitable companies, for example, would provide a direct and transparent tax preference for companies operating in a relatively competitive environment, compared to those that are more insulated from competition. And given the distribution of corporate profits and tax payments in the United States, even a small hike in the rate at the top could have large revenue consequences.
Enacting a graduated global U.S. corporate tax system
One way to enact a graduated global U.S. corporate tax system could keep the corporate rate at its present level of 21 percent for smaller-profit companies, while raising the corporate tax rate for those companies with higher profits. Marginal rates would be calculated as they are presently under the individual income tax system, so that the increased rate would only apply to income above the thresholds in question. Table 1 illustrates one possible graduated corporate tax rate schedule.
Table 1
Example of graduated global U.S. corporate tax rate schedule
In Table 1, corporate taxpayers with $2 billion in income, for example, would pay 21 percent on their first $100 million in income, 25 percent on $900 million of their income, and 30 percent on $1 billion of their income, for a total tax bill of $546 million and an average tax rate of 27.3 percent. Importantly, a graduated rate of corporate taxation was, until recently, a feature of the corporate tax, so this sort of rate structure is not unprecedented. And, under current law, there are many provisions that are more favorable for small companies, as well as some base protection measures that only affect large companies.
Examples of the former include special expensing rules under Section 179, under which approximately $1 million of investment can be deducted, and the favorable treatment is phased out at higher investment levels (above about $2.9 million). Examples of the latter include 163(j) interest limits, which affect only those taxpayers with more than $27 million in receipts in 2022, and the base-erosion anti-abuse tax, or BEAT for short, which affects those with average annual gross receipts of $500 million or more. Indeed, the BEAT exists to counter avoidance opportunities that are far more likely to occur among large companies.
While publicly available IRS data do not allow an investigation of the exact breakdowns of Table 1, one can examine proximate statistics for 2019, the most recent year not affected by the COVID-19 pandemic (though 2020 data lead to similar inferences). (See Figure 2.)
Figure 2
Distribution of corporate taxpayers and corporate tax payments, 2019
It is readily apparent that most corporations would be untouched by the tax-bracket reform that is illustrated in Table 1. Of the approximately 500,000 corporate tax returns filed in 2019 with positive tax liability, fewer than 2,000 of them had tax payments of more than $10 million (and thus taxable income nearing $50 million). Indeed, about 99.7 percent of corporate taxpayers fall below those thresholds, and thus even more would be excluded from the reform suggested above.
But most of the tax base would be affected by this reform, since 87 percent of the tax payments are made by corporations above the $10 million tax payment threshold, and 69 percent of all corporate tax is paid by companies with tax payments of more than $100 million (and thus with taxable income nearing $500 million). The average company with more than $100 million in tax payments has $3.2 billion in taxable income.
Consider the revenue effects of this reform in 2019 under two (restrictive) assumptions: There is no behavioral response, and each corporation has a situation that is the average of those in their IRS segment. In that event, tax burdens would only increase for fewer than 4 out of 1,000 corporations with positive tax liability. For those with tax payments between $10 million and $50 million, about one-third of the average company’s taxable income (which averages $154 million) would be subject to an additional 4 percent tax; this group of taxpayers would pay $2.5 billion in additional tax. There are 272 taxpayers with tax payments between $50 million and $100 million, who have an average taxable income of $593 million, so about 83 percent of their income would have an additional 4 percent tax rate applied, generating about $5 billion in tax revenue.
For the 353 companies with tax payments of more than $100 million at present, who have an average taxable income of $3.2 billion, about 69 percent of their income would be taxed at 30 percent, and another 28 percent of their income would be taxed at 25 percent. This group would generate about $82 billion in additional tax revenue.
Across these three groups, tax revenues would increase by about $90 billion in 2019, an increase of 35 percent relative to the baseline. This revenue increase is an underestimate in one respect, since assuming everyone in the top bracket is an “average” company removes any additional revenue associated with the 35 percent bracket for those companies with more than $10 billion in profits.
Data from the Fortune 500 list covering the year 2019 suggest that there are about 13 U.S. companies with more than $15 billion in worldwide profits, suggesting they might be above the $10 billion threshold in U.S. profits. Together, these companies generate about $273 billion in profit above the $10 billion threshold. An additional 5 percent tax on that base would generate $14 billion in additional revenue. Approximately one-third to one-half of U.S. corporate profits are foreign profits, so this suggests perhaps about $7 billion to $9 billion in additional U.S. tax, bringing the total to about $98 billion.
These calculations do not account for behavioral response, but one would expect behavioral response along at least three margins. First, if companies face higher tax burdens, they may do less real activity. Given the target population of companies, this is not a big concern, since these companies have large excess profits, and the additional tax is unlikely to fall on the normal return to capital, so it would be relatively nondistortionary.
Second, and more significant, large companies have other ways to respond to higher tax burdens. For instance, they may seek to shift profits toward lower-tax destinations. This would be true even if size thresholds were set based on global income, if the tax base were determined by U.S. reported income. This issue is the most important hurdle to adopting this proposal, and it will be addressed in detail below.
Third, larger companies may split into smaller companies (or do fewer mergers and acquisitions) in order to avoid the higher rates of tax felt by larger companies. If a split were a mere formality, such that ownership and control of the company remained as before, that would circumvent the higher tax burdens for large companies. But the law should ensure that companies would be consolidated for tax purposes if they were not truly separate, and prior law (when the corporate rate structure was graduated) had provisions to address this issue.
With a tight definition of commonality, companies would only be able to separate if they were truly willing to give up the benefits of internalization that result from their combination. Such internalization benefits can be significant. For instance, internalization resolves principal-agent problems, helping to align the profit-maximizing incentives within the group. Internalization allows economies of scale (cost reductions due to greater production scale), economies of scope (cost reductions due to producing a larger number of complementary goods), and synergies associated with cooperative product or service development. When companies break up, they lose many of these advantages.
The hypothetical tax schedule in Table 1 above attempts to balance two considerations. First, scale economies may be beneficial, generating cost savings that benefit consumers, resources that fund innovation, and the capacity to absorb risk. One wouldn’t want to eliminate the possibility of large companies and the attendant advantages of scale.
There also are disadvantages associated with market domination. Concentration of economic power may generate serious negative consequences: depressing wages or employment, systematically lowering the labor share of income, impeding healthy market competition, harming consumer welfare, and corrupting public policy processes. Given these factors, it would be useful to have a public policy tool that counters excessive agglomeration of economic power.
While antitrust law also has an important role to play, the objective of antitrust law can be usefully complemented by a tax code that, at minimum, does not incentivize market concentration, and instead works to promote market competition. The tax code can act as an ever-present nudge in this area, as in so many others, by incrementally changing marginal incentives.
Indeed, the tax code is a statement of values. It encourages things such as clean energy and research by offering them low tax burdens. In this case, market power can be discouraged by levying a somewhat higher tax on those firms most likely to exercise it. This has the salutary effect of allowing society to benefit from those activities that generate above-normal profits, providing an efficient source of finance for fiscal priorities.
At present, the tax code often tilts the playing field in the other direction. Large, profitable multinational companies pay lower rates than smaller domestic companies, often by a substantial margin. In part, this is because multinational companies can avail themselves of opportunities to shift profit offshore, toward jurisdictions with rock-bottom tax rates. These low tax rates advantage large multinational companies relative to their smaller, less profitable peers, turbocharging market concentration.
Further, the causality can go the other way too, as market power fuels tax avoidance. Sophisticated multinational tax avoidance techniques often entail sizable fixed costs, and large profits provide the resources to invest in this expertise. Large companies also invest more in political activity, which can bear large fruits in terms of more favorable tax or regulatory environments. In turn, successful political activity provides policy advantages that fuel concentration.
Implications for international tax reform
The most important objection to taxing large, profitable companies at higher rates in a graduated U.S. corporate tax system is that such companies are particularly adept at shifting income offshore. Therefore, any higher tax rates for the most profitable companies should be accompanied by associated measures that combat international profit shifting.
There are different approaches to tackle profit shifting, but a central aim is to reduce the elasticity of the corporate tax base. Some havesuggested full worldwide consolidation, which would require resident firms to pay tax on their global income alongside their domestic income; foreign tax credits would prevent double taxation. This would end the incentive to shift income offshore, although it would put pressure on the definition of residence, so accompanying reforms would need to reduce the elective nature of tax residence by using a management and control criterion and by employing measures to counter corporate inversions. A bill introduced by Sen. Sheldon Whitehouse (D-RI) in the current U.S. Congress takes a similar approach.
One daunting concern with such reforms is that they would hamper the international competitiveness of U.S.-headquartered multinational companies in global markets if foreign income were taxed more heavily than that of their competitors. While this form of competitiveness is a concern, it is less of a concern for those companies that wield substantial market power.
Further, it is also useful to note that the competitiveness of the United States as a place for U.S. multinational companies to undertake economic activity and book profits would be improved. Unlike current law, there would be no tax advantage associated with operating in lower-tax countries, so U.S.-based companies would face no tax distortions in their location decisions regarding where to deploy investments or hire workers.
A more modest reform would simply narrow the existing tax preference favoring foreign income over domestic income. Under current law, the so-called GILTI provision, which stands for “global intangible low tax income,” exempts the first 10 percent return on foreign tangible assets from U.S. tax, and income above that threshold is taxed with a 50 percent deduction relative to domestic income. This provides a large incentive to earn income offshore.
In President Joe Biden’s budgets for fiscal years 2022, 2024, and 2025, the administration proposed eliminating the tax-free return on foreign tangible assets, reducing the deduction for foreign income to 25 percent, and calculating the tax burden on foreign income on a country-by-country basis. Together, these changes would have substantially reduced the incentive to shift profit offshore, lowering the elasticity of the tax base.
In November 2021, the U.S. House of Representatives passed a reform that would move in this direction, applying the GILTI tax on foreign income on a country-by-country basis, lowering the deduction for low-taxed foreign income, and reducing the tax-free return on foreign tangible assets to 5 percent. The U.S. Senate did not pass a similar reform, but instead legislated a corporate alternative minimum tax; this reform will slightly raise the tax burden on foreign income for some multinational companies.
The country-by-country feature of GILTI reforms is important. It further reduces the incentive to earn income in low-tax jurisdictions offshore, since the resulting U.S. tax cannot be offset with tax credits from higher-tax locations.
The GILTI provision operates as a deduction from the normal corporate rate; thus, whatever GILTI design is adopted, it can accommodate higher corporate tax rates (such as those envisioned in the prior section) with proportionate changes in the tax rate that would apply to low-taxed income abroad. Yet the higher the U.S. rate on foreign income relative to the lightest possible treatment of foreign competitors, the more corporations will fear negative competitiveness impacts. Still, it is important to bear in mind that the higher corporate tax rates envisioned in the prior section are triggered by the exceptionally high corporate profits earned by dominant corporations; this should alleviate competitiveness concerns.
Since competitiveness concerns also hold in many countries abroad, this provides a strong argument for international tax cooperation. Left to their own devices, governments often behave as players in a noncooperative game, lowering their tax rate to attract tax base and activity from other countries. Since all countries face similar incentives, tax rates are too low relative to what would be chosen if countries could coordinate.
Luckily, countries cancoordinate, although such coordination is never easy. Still, in 2021, more than 135 jurisdictions accounting for about 95 percent of the world economy agreed to transformative reforms in international tax rules, including a global country-by-county minimum tax of 15 percent. This OECD/G20/Inclusive Framework agreement responds to the “race to the bottom” dynamic in international taxation by raising the bottom, from 0 percent (the approximate tax rate currently levied by some important low-tax jurisdictions) to 15 percent.
Further, the agreement is strengthened by an undertaxed profits rule, or UTPR, which allows adopting countries to top-up tax burdens for companies operating in their markets that are headquartered in nonadopting countries. Such an enforcement mechanism should encourage widespread adoption once a few major economies adopt. Otherwise, companies based in nonadopting countries will still face top-up taxes when they operate in adopting countries—the resulting revenue will just accrue to adopting country governments instead of their home governments.
In December 2022, the European Union unanimously moved forward to implement this country-by-country minimum tax by issuing a Council Directive. In addition, manyothercountries, including South Korea, Japan, Australia, Canada, and the United Kingdom, are also implementing this minimum tax. Hopefully, the United States will soon follow suit.
Based on current implementation plans, OECD researchers have concluded that 90 percent of the multinational companies that are in the scope of the agreement will be covered by its provisions. Of course, this agreement is not perfect. Some forms of tax competition will persist, as countries may offer subsidies or refundable tax credits in place of low tax rates. That said, such measures are more difficult for countries to adopt, as they entail direct budgetary costs, not just foregone revenue. Thus, the constraint on tax competition provided by this agreement is a real one, and it is an important step forward.
In the end, the elasticity of the corporate tax base is a choice. And there are multiple options for reducing the elasticity of the corporate tax base. In the near term, the most practical way forward is to build on the momentum created by the international agreement. International adoption of the OECD/G20/Inclusive Framework agreement will help limit tax competition pressures and reduce profit-shifting incentives.
Foreign adoption of these reforms also supports U.S. international tax reforms that strengthen the GILTI provision, reducing the current tax preference that favors foreign income relative to U.S. income. First, foreign adoption of minimum taxes reduces any competitiveness concerns associated with a stronger GILTI provision, which could otherwise create sizable gaps between U.S. treatment of foreign income and rules abroad.
Second, foreign adoption of the undertaxed profits rule causes U.S. multinational companies to face top-up taxes abroad in adopting countries. Thus, these companies would still face 15 percent tax burdens on their foreign income, but the revenue would go to foreign governments instead of the U.S. government, giving the U.S. government a strong incentive to adopt conforming GILTI reforms.
Further, without adoption of aligned reforms, U.S. multinational companies would risk facing several overlapping minimum tax regimes. Current U.S. law includes the GILTI provision and a Base Erosion and Anti-abuse Tax, or BEAT. Foreign governments will also levy UTPR taxes. In addition, there is the new corporate alternate minimum tax, or CAMT. (The CAMT was part of the Inflation Reduction Act of 2022. It taxes companies with more than $1 billion in book income at a rate of 15 percent, but it contains special features to avoid clawing back existing investment incentives, R&D incentives, or general business credits. It does not include a country-by-country minimum tax on foreign income.)
With reform of the U.S. international tax rules, as suggested by recent Biden administration proposals, these taxes could conceivably be consolidated, as U.S. companies would no longer pay UTPR taxes abroad, and there would be far less need for the CAMT (especially for multinational companies) or the BEAT.
Other ways to combat market power through the tax code
There are additional ways to improve existing U.S. tax laws to better address market power concerns. For instance, the design of the foreign-derived intangible income, or FDII, deduction is perverse, since it provides a tax break for above-normal returns to some income, relative to normal returns. Under the FDII, companies receive a deduction of 37.5 percent (scheduled to fall to 21.9 percent in 2026) on their income above a 10 percent return on qualified business asset investment if that income is derived from exports. This provision should be repealed. It serves no economic purpose to favor excess profits, and it is an indirect (at best) way to incentivize the development of intangible property in the United States, which would be better targeted by measures that focus more narrowly on research and development.
Another area where tax policy might be reconsidered is that of tax-free reorganizations. Global mergers have surged in recent years, reaching $5 trillion in value in 2021. Mergers can spur market concentration, and while they may generate efficiencies, many mergers fail to do so. Under U.S. tax law, some mergers can be structured to be tax free, when the acquiring firm exchanges some of its stock for target-firm stock; tax is then deferred until the underlying asset is later sold. While there are justifications for such favorable tax treatment, there are also counterarguments, and rising market power provides a strong rationale for reconsidering this tax preference.
Ideally, tax provisions would instead provide lessfavorable treatment to very-high-profit large companies. Under the proposed international reforms and the new CAMT, minimum tax regimes would only apply to large companies, although the thresholds vary. As this issue brief and my more comprehensive working paper argue, that focus on large companies makes good economic sense, as the corporate tax is more likely to serve both efficiency and fairness goals when levied on above-normal returns to capital, and above-normal returns are more likely for companies with high profits.
Compliance costs and tax administration concerns
Administrative complexity provides another reason to focus such provisions on large companies. Large companies have more tax-avoidance opportunities, both due to their international reach, which allows them to exploit variations in tax treatment across jurisdictions, and due to their scale, which helps them afford the fixed costs associated with setting up tax-avoidance structures. The large scale of these companies also helps them comply with complicated new tax provisions, including the minimum taxes described here. While such provisions can be dauntingly complex, the largest companies have the resources required to handle complexity.
Administering graduated corporate tax brackets, as envisioned above, would be straightforward, as applying tax brackets is a simple part of compliance and enforcement. Yet because higher rates would put additional pressure on international profit-shifting incentives, improving international tax rules—and providing the IRS with sufficient resources to administer such rules—are especially important.
Conclusion
Market power is an important force in both the U.S. economy and the world, and a wealth of evidence indicates that market power has become increasingly important in the past few decades. While the scale economies and network effects that are associated with market power generate efficiencies, they also generate policy concerns, through possible detrimental effects on income inequality, labor bargaining power, consumer welfare, and market dynamism.
The importance of market power suggests rethinking common corporate tax policy design concepts. Most important, tax policy should distinguish the normal return to capital from the above-normal return to capital. This distinction has important consequences for the efficiency and equity of capital taxation.
Market power, alongside long-understood tax administration criteria, strengthens an already-strong case for entity-level taxation. The corporate tax has the potential to distinguish companies based on the magnitude of their reported profits: The larger the company’s taxable income, the more likely that a large share of their corporate tax payments are above-normal returns. A graduated corporate tax rate system has the potential to act as a constant nudge, tilting the playing field in favor of more competitive markets.
International tax reform has an important role to play in enabling consideration of such reforms by strengthening governments’ ability to tax the largest multinational companies and making the corporate tax base less tax elastic. Recent advances in international tax cooperation are encouraging, due to the coordinated implementation of minimum taxes on multinational company income. In the years ahead, this agreement can be further improved to allow jurisdictions more tax policy autonomy in addressing both market power and fiscal needs.
—Kimberly Clausing is the Eric M. Zolt Professor of tax law and policy at the University of California, Los Angeles School of Law. She also is a nonresident senior fellow at the Peterson Institute for International Economics and an NBER research associate.
The nearly 90-year-old federal-state Unemployment Insurance program provides much-needed relief to unemployed workers who lose their jobs through no fault of their own and helps to stabilize the U.S. economy during downturns. Through 14 recessions since its enactment as part of the New Deal, most recently the Great Recession of 2007–2009 and the short but sharp COVID-19 recession in 2020, this pivotal income support program remains a cornerstone of our nation’s social infrastructure.
Yet despite its strengths, the UI system falls short in serious ways. New U.S. Senate legislation—the Unemployment Insurance Modernization and Recession Readiness Act of 2023—would take important steps toward bolstering the system and ensuring that it can adequately support workers and the economy as a whole amid future recessions. In particular, the bill works toward addressing states’ race-to-the-bottom in terms of the amount of income support provided and the number of workers reached, while also advancing racial equity, bolstering the system’s responsiveness to recessions, and more effectively supporting vulnerable workers looking for jobs.
The new legislation builds in part upon lessons learned during the COVID-19 pandemic. The U.S. Census Bureau estimates that UI benefits kept nearly 5 million people, including more than 1 million children, out of poverty. In addition, those workers who received these benefits helped lower their material insecurity and hardship, and they reported fewer difficulties meeting household expenses, fewer times experiencing food insecurity, and lower anxiety and depression, compared to families that applied for Unemployment Insurance but did not receive these benefits.
As a result, macroeconomic analysts agree that economic output was higher and unemployment was lower as a result of the greater consumption that UI benefits supported during the COVID-19 pandemic. Still, the Unemployment Insurance program needs to be updated to meet the needs of workers and their families and the broader U.S. economy in the 21st century.
This column considers three of the most important changes the new Senate bill proposes to make to the UI system, detailing the extensive impact each would have for workers and to bolster the U.S. economy during downturns. These include:
Creating new minimum standards for UI benefits
Repairing the automatic system of extended benefits during recessions
Launching a new jobseekers allowance for workers who do not qualify for traditional UI benefits but who need support while looking for work
Together, these reforms would make the Unemployment Insurance system more effective at meeting the needs of workers and the economy because they are based on the latest evidence-driven data and analysis. So, let’s turn first to the need for national standards for UI benefits.
Creating national standards for UI benefits
The Unemployment Insurance system is run as a partnership between the federal government and states, the District of Columbia, and territories, with state and territorial partners largely left on their own to set rules about which workers qualify, the level of income support provided, and how long workers can claim UI benefits. While there have always been important differences across states in the amount of UI income support and eligibility, since the Great Recession, a number of states have introduced dramatic cuts to their benefits.
Ten states halved the maximum number of weeks a worker could claim benefits. This has made it substantially harder for workers to gain access to benefits. And, because these cuts have happened in states with large workforces of color, Black, Hispanic, and other non-White workers have tended to bear the brunt of these cuts.
Indeed, pre-pandemic data from 2019 show that there is dramatic variation across states in both the average level of income support that workers can expect to receive, as well as the percentage of unemployed workers who claim benefits. In some states, such as North Carolina, Florida, Tennessee, Arizona, and Louisiana, UI benefits replace less than 15 percent of average weekly wages and less than 30 percent of unemployed workers actually receive benefits. These stingy systems create more economic hardship for workers their families and make it harder for the UI system to boost the economy during recessions. (See Figure 1.)
Figure 1
The stingiest states also tend to be the states with the largest workforces of color, exacerbating racial inequalities in the level of UI benefits. (See Figure 2.)
Figure 2
The new Senate legislation would address this race-to-the-bottom dynamic head-on, requiring for the first time that states offer at least 26 weeks of UI benefits, that those benefits replace at least 75 percent of workers’ wages, and that the maximum amount of income support must equal at least two-thirds of each state’s average weekly wage.
Together, these changes would mean that every state would offer at least a minimum baseline of Unemployment Insurance support to all eligible workers. This would ensure that the UI system provides more relief to unemployed workers, helping them and their families meet their basic needs. In so doing, it would also improve the ability of the UI system to inject more stimulus into the economy during recessions, by helping support consumption among unemployed workers and their families. And, by preventing some states, especially Southern and Southwestern states, from drastically curbing their income support levels, it would help address racial disparities between workers in access to UI benefits across states.
Fixing the Automatic Extended Benefits System
During a recession, economists agree that Unemployment Insurance support should be increased because more people are unemployed for longer periods of time. In 1970, Congress created a permanent system of Extended Benefits to offer between 13 and 20 additional weeks of benefits to workers in states with high unemployment rates who had exhausted their regular state benefits. These extended weeks of UI benefits “trigger on” when states hit certain thresholds, providing more weeks for workers in states with higher levels of unemployment.
Despite these aims, the Extended Benefit system has played a remarkably small role in responding to recessions in recent decades. Just 2 percent of those who received Unemployment Insurance did so through the Extended Benefits program from 1986 through 2023. In fact, higher UI benefits during recessions have come from emergency, ad-hoc benefits passed by Congress, not through the automatic Extended Benefits system. (See Figure 3.)
Figure 3
The reason is that states use “triggers” that are flawed to turn on Extended Benefits, which means they are unresponsive to changes in state economies and national economic conditions. There are three especially significant flaws in the triggers states use.
First, many states use a trigger based not on their state’s unemployment rate but rather on the proportion of workers receiving UI benefits. That means these states’ triggers are affected not just by labor market conditions but also by the stinginess of the state’s UI benefits. Stingier states where fewer workers qualify for benefits in the first place are less likely to trigger on during a downturn—and as more states cut UI benefits, especially in terms of the weeks of benefits, fewer states are likely to trigger on, even during a recession.
Second, the triggers are state-specific and are thus not responsive to a national downturn or a downturn in a high unemployment region. This flaw weakens the macroeconomic stabilization that Extended Benefits can bring when there is a recession spreading across multiple states.
Third, the triggers can frequently turn off if there has been no significant increase in unemployment over the prior 2 years. As a result, if unemployment remains high, then Extended Benefits may turn off even though the need has not diminished.
The proposed Senate legislation makes a number of important fixes to Extended Benefits to address these three issues. These include moving states away from relying only on measures of UI recipiency to measures based on each state’s unemployment rate. This means the stinginess of individual state UI eligibility requirements would not necessarily affect the availability of Extended Benefits.
The proposed legislation also builds in triggers for both state and national unemployment rates so that the system can be responsive to national or regional downturns—not just a state’s own unemployment rate. This provision captures the interconnected nature of the U.S. economy across states. And there also are new provisions to keep Extended Benefits triggered on when unemployment is high but not increasing, so that benefits keep flowing during sustained recessions.
Creating a new jobseekers allowance
The proposed legislation also takes a very important step forward in expanding financial support for workers who would not otherwise qualify for regular UI benefits by creating a “jobseekers allowance.” This new provision would create a federal weekly benefit for workers who are actively seeking work but are not covered by Unemployment Insurance or only qualify for very limited income support.
To receive this new jobseekers allowance, workers would need to be able to work, available to work, and actively seeking work, be at least 19 years old or have earned a high school diploma or equivalent, and earn income below a certain threshold.
The proposed jobseekers allowance would provide up to $250 per week and cover workers who experience bouts of unemployment, such as:
Recent high school or college graduates who are looking for a job but do not have paid work experience
Family members who left the paid labor force to take care of children or elderly family members and who want to return to work but do not have recent paid work experience
Individuals who are returning to paid work after time in the criminal justice system and who are looking for a job but do not have recent paid work experience
Low-paid workers who would not earn enough in UI benefits to support their job searches
A jobseekers allowance would provide vital support to these workers, helping them with weekly income support until they find jobs that are well-matched to their skills, education, and experience. This support could be especially important for otherwise-vulnerable workers, such as individuals who are trying to reenter the labor market after returning from incarceration and who face a number of obstacles in their job searches, as well as young workers entering the labor market for the first time, whose early jobs often set their earnings and employment trajectory for years to come.
Conclusion
Together, these changes to the Unemployment Insurance system in the proposed Senate legislation would help the system better support U.S. workers and respond to economic downturns. Importantly, the changes would help address the striking racial disparities in access to UI benefits across states.
To be sure, there are many other important changes needed in the UI system—for instance, to improve the financing of benefits by ensuring that taxes adequately fund the system. But the proposed Senate legislation offers vital steps forward.
Did you find this content informative and engaging? Get updates and stay in tune with U.S. economic inequality and growth!
Amid ongoing congressional debate over expanding the Child Tax Credit for U.S. families, it’s important to understand why the fears about the expansion of that tax credit in 2021 were wrong. One of the more prominent concerns voiced at the time was that families who qualified for the expanded tax credit would spend the additional money unwisely, even perhaps using it to buy illicit drugs.
These concerns were offensive on many levels. One never hears those same legislators worrying about the spending habits of the families or individuals enrolled in other government programs, such as the mortgage interest deduction, the estate tax exemption, or corporate fossil fuel energy subsidies. But the concerns also are empirically wrong.
A new working paper published today—and set to be included in a special issue of the Annals of the American Academy of Social and Political Sciences this summer—synthesizes the large body of evidence on how parents and guardians spent the enhanced Child Tax Credit in 2021. The researchers review both transactional and survey data, including the Census Household Pulse Survey, the Consumer Expenditure Interview Survey, and the Survey of Household Economics and Decisionmaking. They find that most families spent the bulk of the additional money—which came in the form of monthly advance payments from the federal government—on necessities such as child care, food, and school supplies.
The working paper’s authors—Jonathan Fisher, previously with the Washington Center for Equitable Growth and now at the U.S. Census Bureau; Jake Schild from the U.S. Bureau of Labor Statistics; and David S. Johnson from the National Academies of Sciences, Engineering, and Medicine and a Research Advisory Board member at Equitable Growth—make four primary observations.
First, the bulk of the evidence suggests that around half of the households that received the expanded Child Tax Credit between July 2021 and December 2021 mostly spent it all, and that about half of these payments were spent within 3 months. The authors also note that during the early months of distribution, a higher proportion of respondents reported saving their payments. During the last few months of distribution, the percentage of savers declined, and the percentage of respondents using their payment for spending increased.
Second, a significant portion of households used the expanded CTC payments to meet basic needs, especially child-related spending. This spending was directed toward child care expenses, children’s activities, school supplies, and children’s clothing.
Third, these families spent the newly allocated CTC money differently depending on their incomes. A higher percentage of low-income households reported spending these funds to pay down debt, while high-income households were more inclined to save the money. In terms of general spending categories, low-income households tended to allocate a higher percentage of their payment toward household necessities, such as food, clothing, and utilities, relative to high-income households.
When it came to spending related to children, low- and high-income households both spent the money on children, but on different categories of goods and services. Low-income households tended to prioritize spending on books and supplies or spending time with their children. High-income households allocated a larger proportion of their payment to child care expenses. Because income and race are highly correlated in the United States, the pattern of use by race mostly followed the income results. When researchers controlled for income, the difference in spending response by race diminished.
Fourth, the expanded CTC payments helped families mitigate the negative impacts of rising prices. These payments were distributed during a time of high inflation amid the serious supply chain problems that were afflicting the U.S. economy amid the COVID-19 pandemic. The 2021 CTC payments prompted households to increase their overall spending, but the presence of inflation dampened the purchasing power of those payments. And approximately 70 percent of those households that experienced negative consequences due to inflation reported that the CTC payments aided them in managing the impact of rising prices.
Unlike today’s ongoing congressional debate about expanding the Child Tax Credit anew, which is about increasing the amount of the annual credit for some low- and middle-income households, the 2021 CTC payments were paid monthly. This was unique and could make the findings above less easily extrapolatable to an expansion of the CTC this year.
But past research on the Earned Income Tax Credit, which is paid as an annual lump sum during tax season, might provide policymakers with some evidence of families’ responses to larger, lump sum CTC payments, were they to come to pass this year. Researchdemonstrates that the annually distributed Earned Income Tax Credit, which acts as a form of forced savings, is primarily spent on durable goods, such as automobiles, apparel, and housing. Some EITC payments are spent on food, especially for households receiving smaller payments, but families have a greater propensity to spend their EITC payments on durable goods because of that credit’s larger size and annual lump-sum characteristics.
In contrast, the 2021 expanded CTC payments enabled families to deal with immediate monthly financial needs, be they debt repayments, food, child care expenses, and other things to support their children. In neither case did the researchers find any evidence of these payments being spent on illicit drugs or nonessential purchases.
The wealth of evidence presented in this new working paper about the efficacy of the 2021 expanded Child Tax Credit going toward immediate family necessities indicates that Congress would be wise to bring the monthly credit back. In addition to reducing the childhood poverty rate in the United States to a historic low, the enhanced 2021 CTC payments also helped families get by throughout the year. Almost two-thirds of the families who received the expanded Child Tax Credit said the monthly payments made it easier for them to budget, and more than 75 percent reported the payments eased their monthly financial burdens.
This increased sense of financial security may be why 95 percent of these families prefer monthly benefits or biweekly CTC payments, while only 5 percent prefer an annual payment. The co-authors of the working paper say that one reason families prefer monthly payments may be the higher consumption variability low-income households otherwise tend to experience, economic parlance for swings in well-being. In other words, the switch to a recurring monthly payment may have allowed households to plan their spending in order to ensure their standard of living stays consistent throughout the year.
Whatever Congress decides to do with the Child Tax Credit this year, hopefully future debates on the subject focus on the evidence—specifically, how the enhanced CTC payments reduced child poverty, did not lead the breadwinners of families to exit the U.S. labor market, helped families afford daily economic necessities, and allowed their children to thrive.
Did you find this content informative and engaging? Get updates and stay in tune with U.S. economic inequality and growth!