This article, “Women’s Work-Life Economics,” originally appeared in the 2019, Volume 23 of “LERA Perspectives on Work,” a magazine published by the Labor and Employment Relations Association, or LERA.
More than 50 years ago, President Johnson signed into law the Equal Pay Act. It bans employers from discriminating against employees by paying employees of one sex less than those of the opposite sex for equal work. Yet large gaps remain in the pay of men and women—and pay gaps are even larger for women of color relative to white men. While discrimination and differences in where women work can explain some of the gap, scholars have documented that women’s continued greater responsibility for care—both inside the home and in caregiving jobs—is also an important factor.
There are signs that the care gap is likely to increase—or least not diminish. Changing population structure has led to an increasing demand in care for both the elderly and children, as well as everyone in between. This has posed a particular challenge for women and their families, as women’s earnings are increasingly crucial to family economic well-being, and women primarily also shoulder the caregiving responsibilities in their families. To understand causes as well as solutions, the role of care in the labor market is key in reversing troubling trends and historical gender disparities we see in the economy.
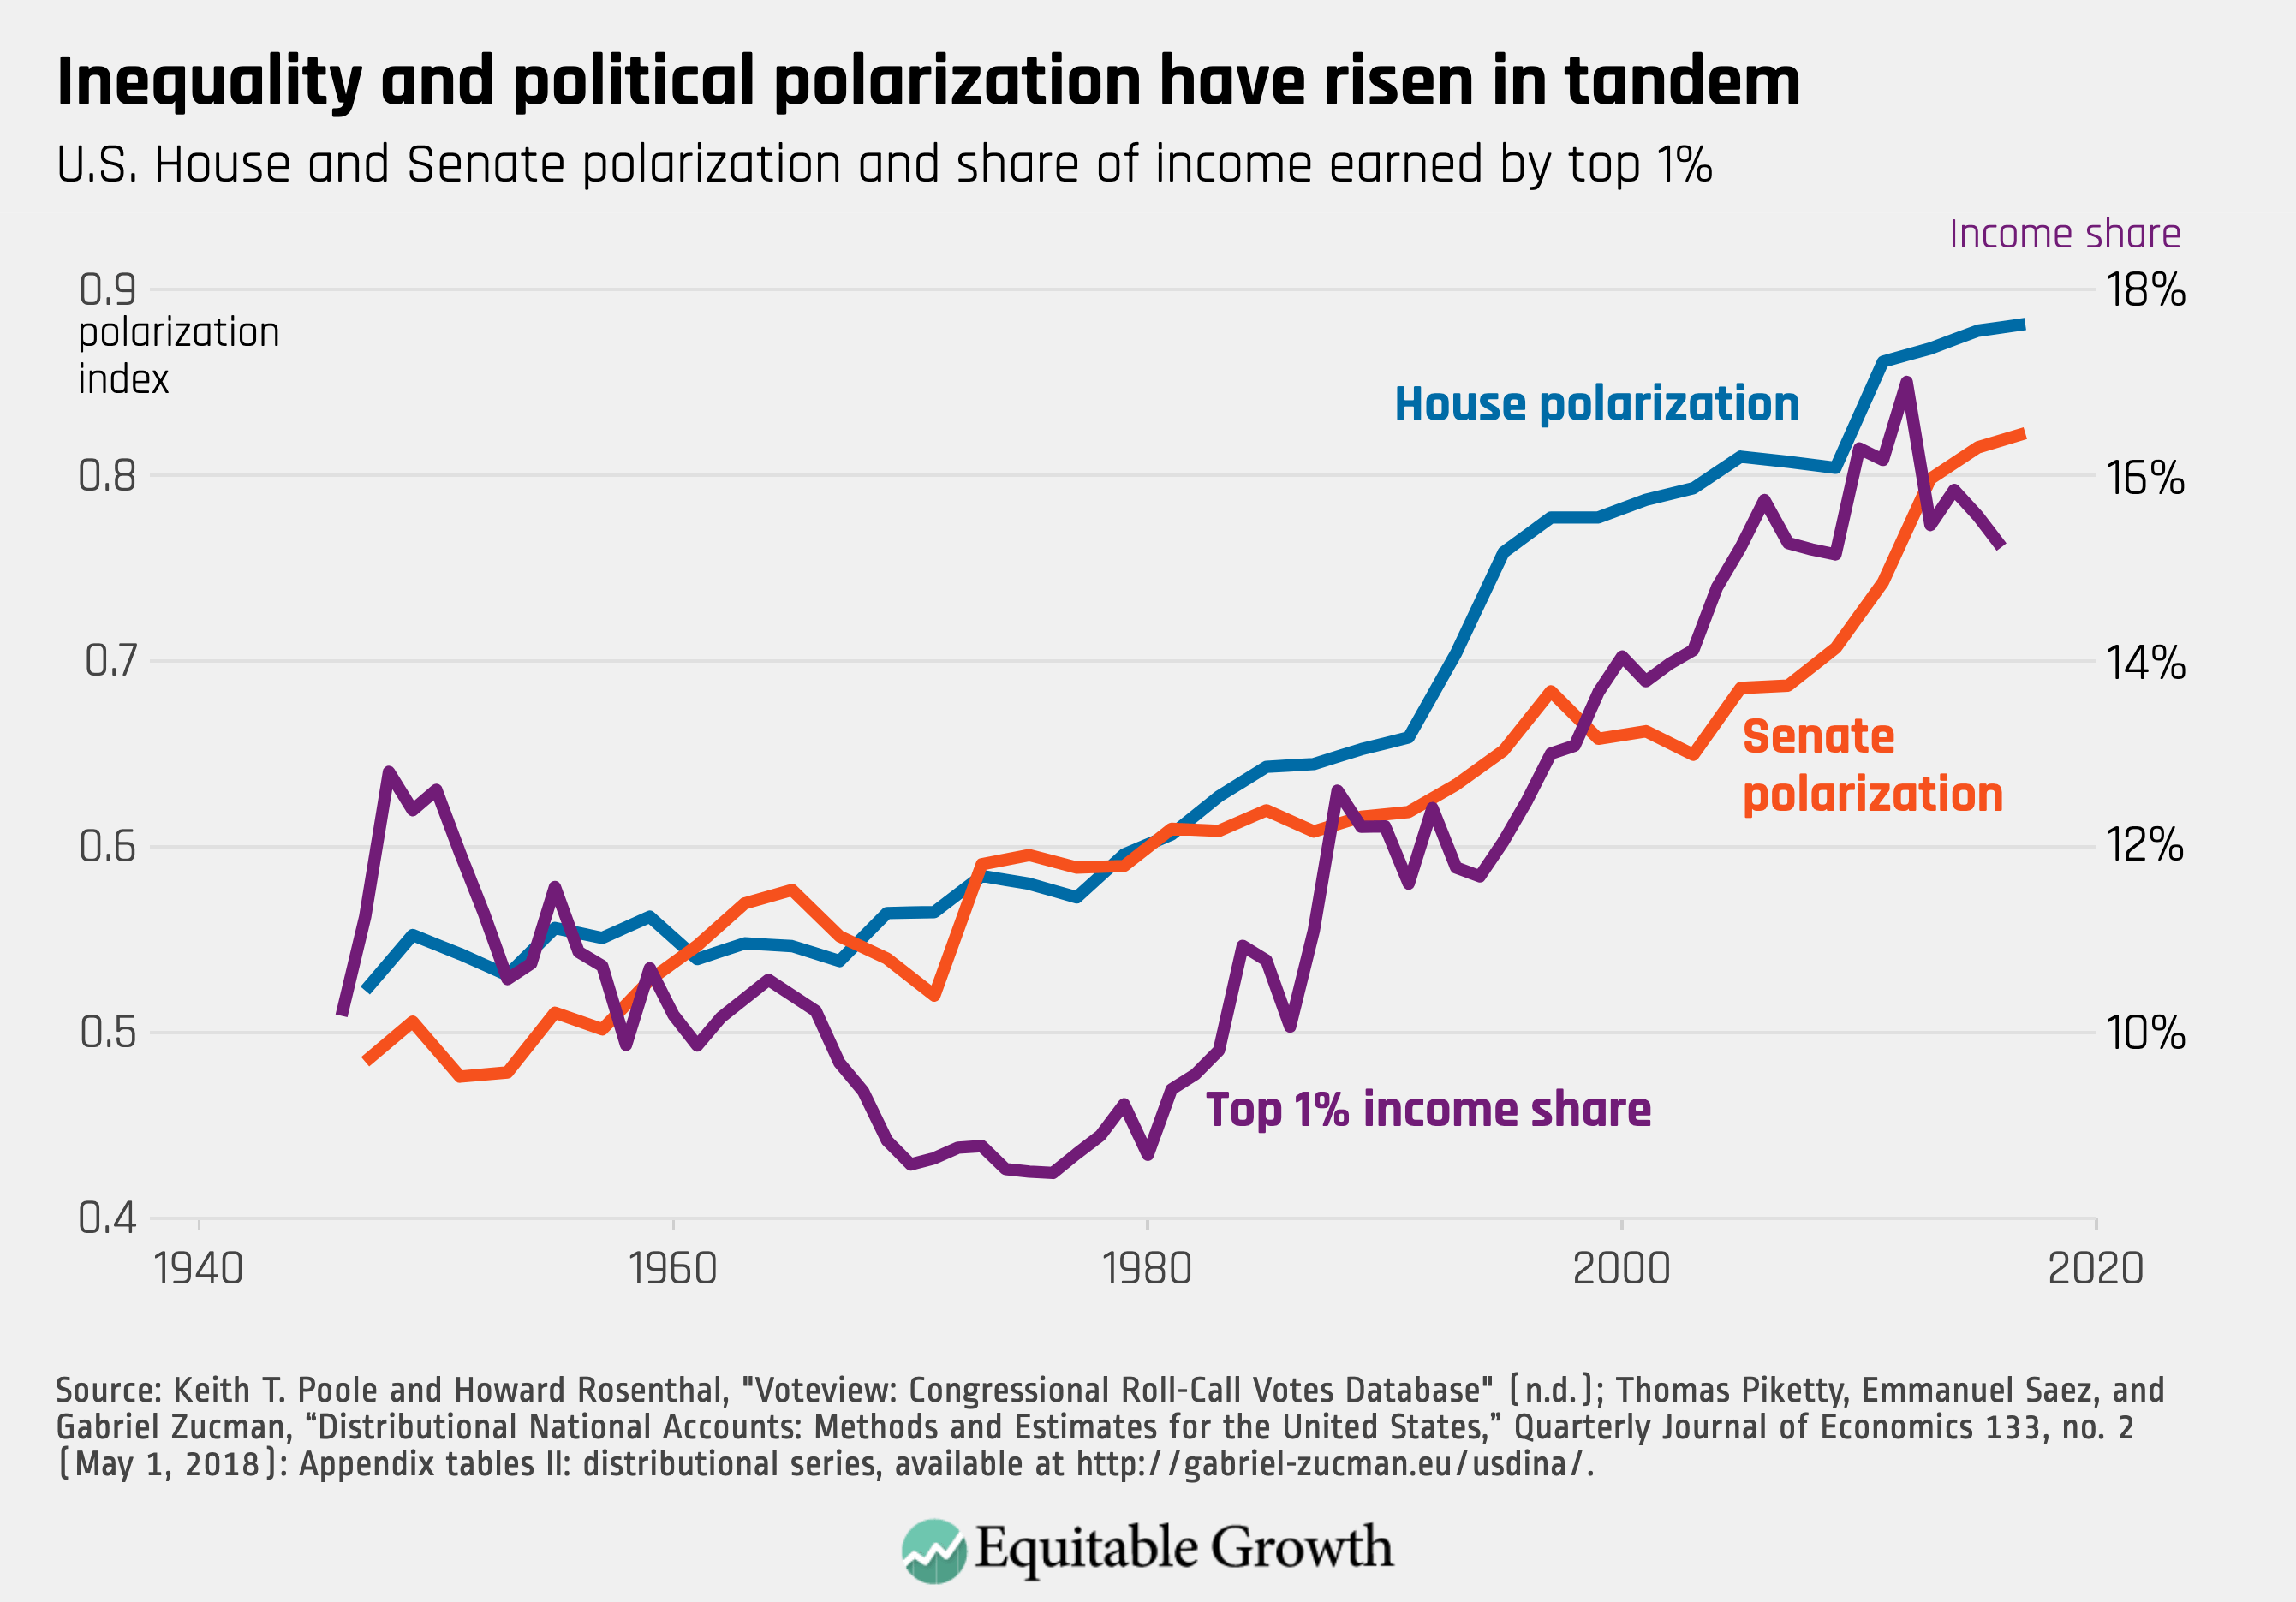
Who provides care and who has access to the supports to provide care are also important factors in a larger economic trend—growing economic inequality. There has been a long-term rise in inequality for families and workers. While total income growth was 2.1 percent in 2014, it was only 0.4 percent for the bottom half of the income distribution and 5.3 percent or the richest 1 percent (Piketty, Saez, and Zucman 2017). Inequality exacerbates the aforementioned trends: women at the top of the income distribution are more likely to have access to benefits such as paid leave that help them balance good jobs in the labor market with family caregiving responsibilities. This means that workers earning hourly wages, those who work in the service industry, and Latinos in particular are less likely to have access to paid time off (Glynn, Boushey, Berg, and Corley 2016).
Evidence demonstrates that increasing market concentration (Rinz 2018) and job-search frictions (Webber 2015) are important causes of rising inequality in pay. Thus, in order to understand trends in women’s pay, we need to explore far more than “women’s choices;” the combination of care work—both inside the home and in caregiving jobs—and rising inequality together create the need for a broader framework. Looking at the labor market through the lens of monopsony can provide such a framework, allowing us to see the intersection of job search, wage offers, and employers who hire women workers.
Monopsony describes any labor market where individual employers have the ability to set wages, rather than wages being determined by competitive forces as predicted by the canonical example of a free market. The classic example is a company town, where the dominant employer does not have to compete with other businesses for hiring workers, and workers are captive to accept pay lower than the value they contribute to the production process. But monopsony occurs any time employers can set wages low and they do not lose all of their workers as a result. This happens when workers face search frictions, due to asymmetrical information, mobility costs, or heterogeneous preferences for work (Manning 2003).
Monopsony is common in some of the largest female-dominated industries. Researchers Elena Prager and Matt Schmitt find that hospital mergers slowed wage growth for affected hospital staff, such as nurses and pharmacists (Prager and Schmitt 2019). There is also evidence that monopsony influences pay for teachers in Missouri (Ransom and Lambson 2011; Ransom and Sims 2010). Nursing and teaching, of course, are among the most common occupations for women.
But there are other factors at play. Another way to think about monopsony is whether workers have options when it comes to job searches and choices. Since women are more likely to have caregiving responsibilities and be secondary income earners in their families, the scope of their job search and mobility may be more limited to a greater degree than for men or for women without caregiving responsibilities and may also make them appear less sensitive to pay when making employment decisions. When women face constraints—such as needing shorter commutes to accommodate family needs (Kimbrough 2016)—this imposes limits on how they make choices.
Using the Longitudinal Household-Employer Dynamics survey from the U.S. Census, Douglas Webber found that, across the economy, women have a lower labor supply elasticity com-pared to men, leading to wages being 3.3 percent lower for women due to monopsony (Webber 2016). He attributes this disparity to the marriage-and-children penalties women face that most men do not. Such dynamics often result in de facto monopsony, where individual employers can subsequently keep women’s wages suppressed because women are limited in their ability to find a job elsewhere.
There are indications from the evidence we have now, however, that looking at care work through the lens of monopsony can help explain trends in women’s pay. Not only are health care and education concentrated labor markets, but also caregiving jobs more broadly may be likely to face monopsony because of the nature of the work itself, where caring for others is a central feature, and social expectations of care workers limit bargaining power.
We can see this in various trends. Caring labor is defined as interactive service work to improve the capabilities of the recipient. It is a sector of the economy that spans both formal paid labor as well as household production within families (Folbre 2012). Additionally, the word “care” is used to describe this work because feelings of concern for the well-being of the care recipient are likely to affect the quality of the services provided (Folbre 2012; Folbre and Weisskopf 1998; Nelson 2011). This type of work, as Kate Bahn notes, offers “intrinsic rewards but also imposes constraints” (Bahn 2015). When there is the expectation that one must care to do work well and that continued interaction and interpersonal connection will lead to better care, workers may also appear to be less pay sensitive, as it is exceedingly difficult to make wage demands in the face of a gendered devaluation of the skill required for this work. Given that (in general) caring labor pays less than occupations with similar required skills without a caring aspect, this may be a key factor in the gender pay gap (England, Budig, and Folbre 2002).
There is also an external downward pressure on wages in caring-labor markets because those who need attentive, quality care the most are those who are least able to pay for it: children and the elderly. But the improved capabilities of these populations have both inherent and economic value, such as educating the future workforce and delaying the need for more intensive care as one ages with dignity. There is a role for policy in improving both the pay and provision of caring labor to the benefit of the workers and the recipients. This will subsequently improve economic outcomes of families who have care needs, such as parents who are able to engage in paid market work when they know they can count on access to affordable and high-quality care for their children.
Policies that support this sector of the economy may also improve opportunities for all workers’ labor-market outcomes since providing affordable and high-quality care helps people balance family-care responsibilities with labor-market participation. Framing this as monopsony helps us account for the causes behind lower earnings and estimate the degree to which earnings could be increased without threatening competition in the economy.
Understanding the specific causes of monopsony helps guide effective policy solutions. If women are likely to face monopsony, the policies that limit the effects of monopsony will have a particular benefit to women, like unions and a higher minimum wage, as well as stronger antitrust enforcement in concentrated industries where women are disproportionately represented. David Card, Thomas Lemieux, and W. Craig Riddell (2004) have found that unions mitigate the gender wage gap due to women’s increasing representation among unionized workers (albeit alongside the overall decline in union representation in the United States). Likewise, the theory of monopsony predicts that unions may provide a countervailing market power to employers’ monopsony power (Paul and Stelzner 2018). The same is true of minimum wages: because of women’s overrepresentation among low-wage workers, increases to the minimum wage will disproportionately benefit women and people of color (Huizar and Gebreselassie 2016) and statutory minimum wages will offset wage-setting on the part of the employer (Robinson 1969).
In addition to addressing monopsony explicitly through unions and with minimum wages and better-enforced antitrust laws, policies that increase job mobility and alleviate the dual pressures to care for one’s family and engage in market work will help workforce outcomes for women workers. The economy would benefit from universal family-friendly policies, like the universal family care credit proposed by the advocacy organization Caring Across Generations. If these policies are not universal, like the optional employer-provided policies that workers currently rely on, we will continue to have segmented labor markets with a gulf between those who have access and those who not, limiting the job search of those without access and leading to an increased likelihood of monopsony wages.
The framework of monopsony provides a tool to understand the constraints that workers face in the economy when employers have the power to set wages. This demonstrates how women are particularly limited in their job search, reducing their own economic well-being when they face monopsonistic exploitation and serving as a drag on the economy. But this tool also provides an opportunity to understand what factors have given employers wage-setting power and how we can balance these forces with unions, increased minimum wages, and policies that provide for care needs and balance care responsibilities.
References
Bahn, Kate. 2015. “The ABCs of Labor Market Frictions: New Estimates of Monopsony for Early Career Teachers and Implications for Caring Labor.” Ph.D. Dissertation, New School University.
Card, David, Thomas Lemieux, and W. Craig Riddell. 2004. “Unions and Wage Inequality.” Journal of Labor Research 25, no. 4: 519–559.
England, Paula, Michelle Budig, and Nancy Folbre. 2002. “Wages of Virtue: The Relative Pay of Care Work.” Social Problems 49, no. 4: 455–473.
Folbre, Nancy. 2012. For Love and Money: Care Provision in the United States. New York, NY: Russell Sage Foundation.
Folbre, Nancy, and Thomas Weisskopf. 1998. “Did Father Know Best? Families, Markets, and the Supply of Caring Labor.” In Economics, Values and Organization, edited by Avner BenNer and Louis G. Putterman, pp. 171–205. Cambridge, UK: Cambridge University Press.
Glynn, Sarah Jane, Heather Boushey, Peter Berg, and Danielle Corley. 2016 (Apr.). “Fast Facts on Who Has Access to Paid Time Off and Flexibility.” Report, Center for American Progress.
Huizar, Laura, and Tsedeye Gebreselassie. 2016 (Dec.). “What a $15 Minimum Wage Means for Women and Workers of Color.” Policy Brief, NEL Project.
Kimbrough, Gray. 2016. “What Drives Gender Differences in Commuting Behavior: Evidence from the American Time Use Survey.” Working Paper No. 16-4, University of North Carolina, Greensboro, Department of Economics.
Manning, Alan. 2003. Monopsony in Motion: Imperfect Competition in Labor Markets. Princeton, NJ: Princeton University Press.
Nelson, Julie A. 2011. “For Love or Money: Current Issues in the Economics of Care.” Journal of Gender Studies 14: 1-19.
Paul, Mark, and Mark Stelzner. 2018.“How Does Market Power Affect Wages? Monopsony and Collective Action in an Institutional Context.” Working Paper, Washington Center for Equitable Growth.
Piketty, Thomas, Emmanuel Saez, and Gabriel Zucman. 2017. “Distributional National Accounts: Methods and Estimates for the United States.” Quarterly Journal of Economics 133, no. 2: 553–609.
Prager, Elena, and Matt Schmitt. 2019. “Employer Consolidation and Wages: Evidence from Hospitals.” Working Paper, Washington Center for Equitable Growth.
Ransom, Michael R., and Val E. Lambson. 2011. “Monopsony, Mobility, and Sex Differences in Pay: Missouri School Teachers,” American Economic Review 101, no. 3: 454–459.
Ransom, Michael R., and David P. Sims. 2010. “Estimating the Firm’s Labor Supply Curve in a ‘New Monopsony’ Framework: Schoolteachers in Missouri.” Journal of Labor Economics 28, no. 2: 331–355.
Rinz, Kevin. 2018. “Labor Market Concentration, Earnings Inequality, and Earnings Mobility.” Working Paper No. 10, Center for Administrative Records Research and Applications.
Robinson, Joan. 1969. The Economics of Imperfect Competition. London, UK: Springer.
Webber, Douglas A. 2015. “Firm Market Power and the Earnings Distribution.” Labour Economics 35: 123–134.
Webber, Douglas A. 2016. “Firm‐Level Monopsony and the Gender Pay Gap.” Industrial Relations: A Journal of Economy and Society 55, no. 2: 323–345.