New measure of county-level GDP gives insight into local-level U.S. economic growth

Since the 1930s and ‘40s, the United States has primarily relied on Gross Domestic Product, or GDP, as the main measure of economic growth and activity. For decades, analysts viewed the upturns and downturns of the GDP growth rate as a reflection of our overall economic well-being. But recent trends in income inequality have enabled the fruits of economic activity to accrue at the top of the income ladder, causing GDP as a measure of the economy to become less and less a reflection of the economy for everyday people. In short, people in the bottom 90 percent of the income distribution are no longer experiencing the same growth as those in the top 10 percent.
Making GDP a more useful metric may require peeling it apart and looking at the data more closely. On December 12, the U.S. Department of Commerce’s Bureau of Economic Analysis released a new measure of economic growth that does just this—Local Area Gross Domestic Product. LAGDP is an estimate of GDP at the county level between the years of 2001—2018. This measure allows policymakers and economists alike to examine local-level economic conditions and responses to economic shocks and recovery.
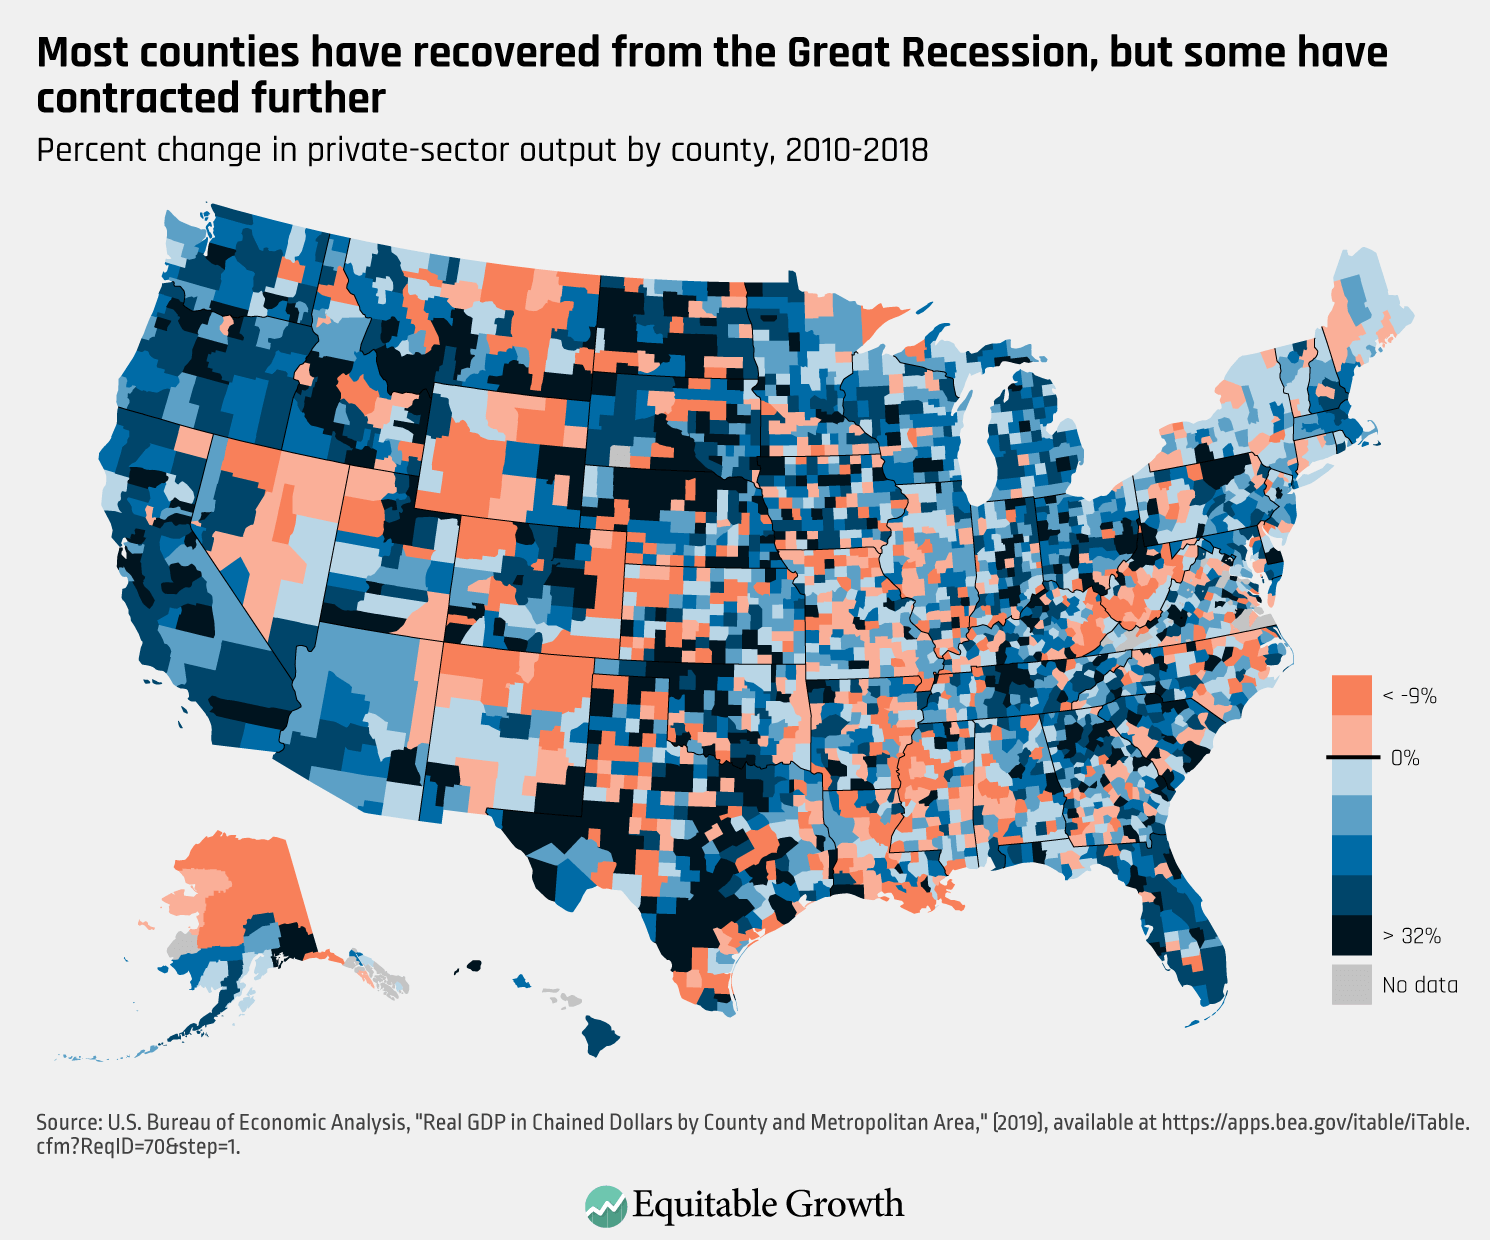
The new data measurement shows that private-sector industries across the nation have experienced growth since the end of the Great Recession in mid-2009, yet most of this growth is concentrated in the West Coast states and parts of the Midwest. States such as Nevada, West Virginia, New Mexico, and Wyoming have seen a significant number of counties contract in economic output since the recession. (See Figure 1.)
Figure 1
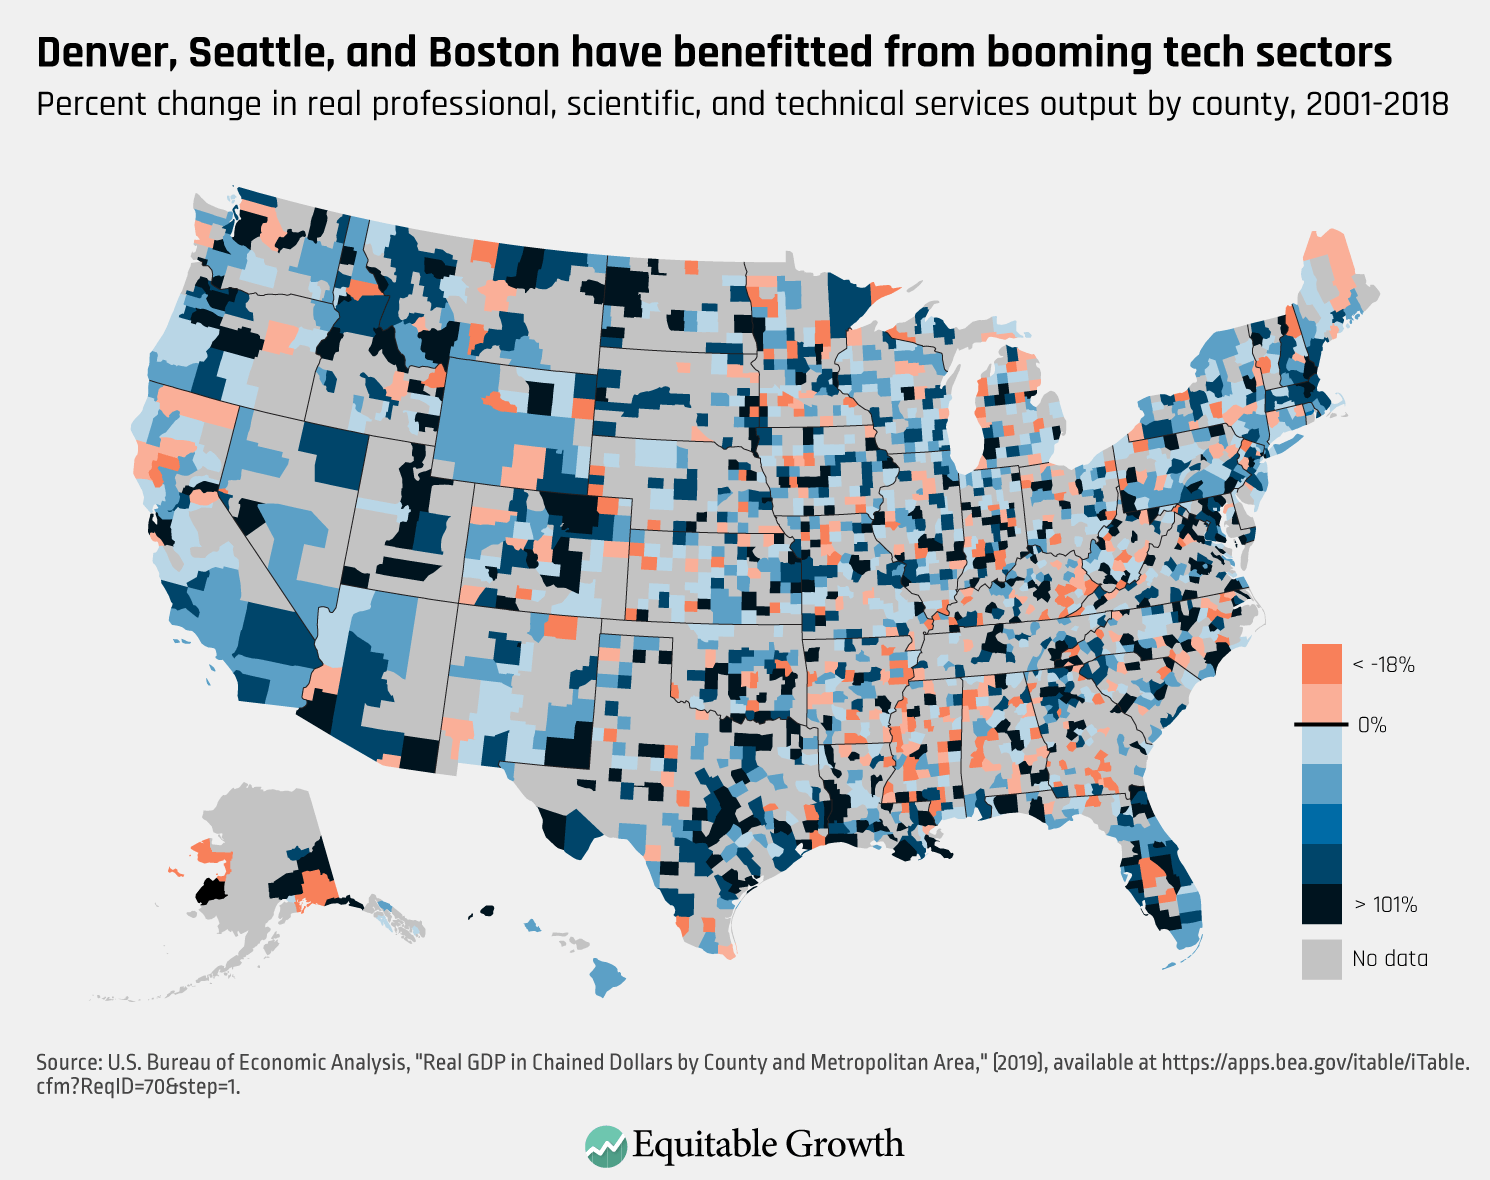
One of the benefits of this new LAGDP measure is that it provides an industry-specific breakdown that shows us how 34 different industries contribute to local economies. The tech industry, for example, contributed a substantial amount to local economies in the major cities of states such as California, Colorado, New York, and Massachusetts since 2001. (See Figure 2.)
Figure 2
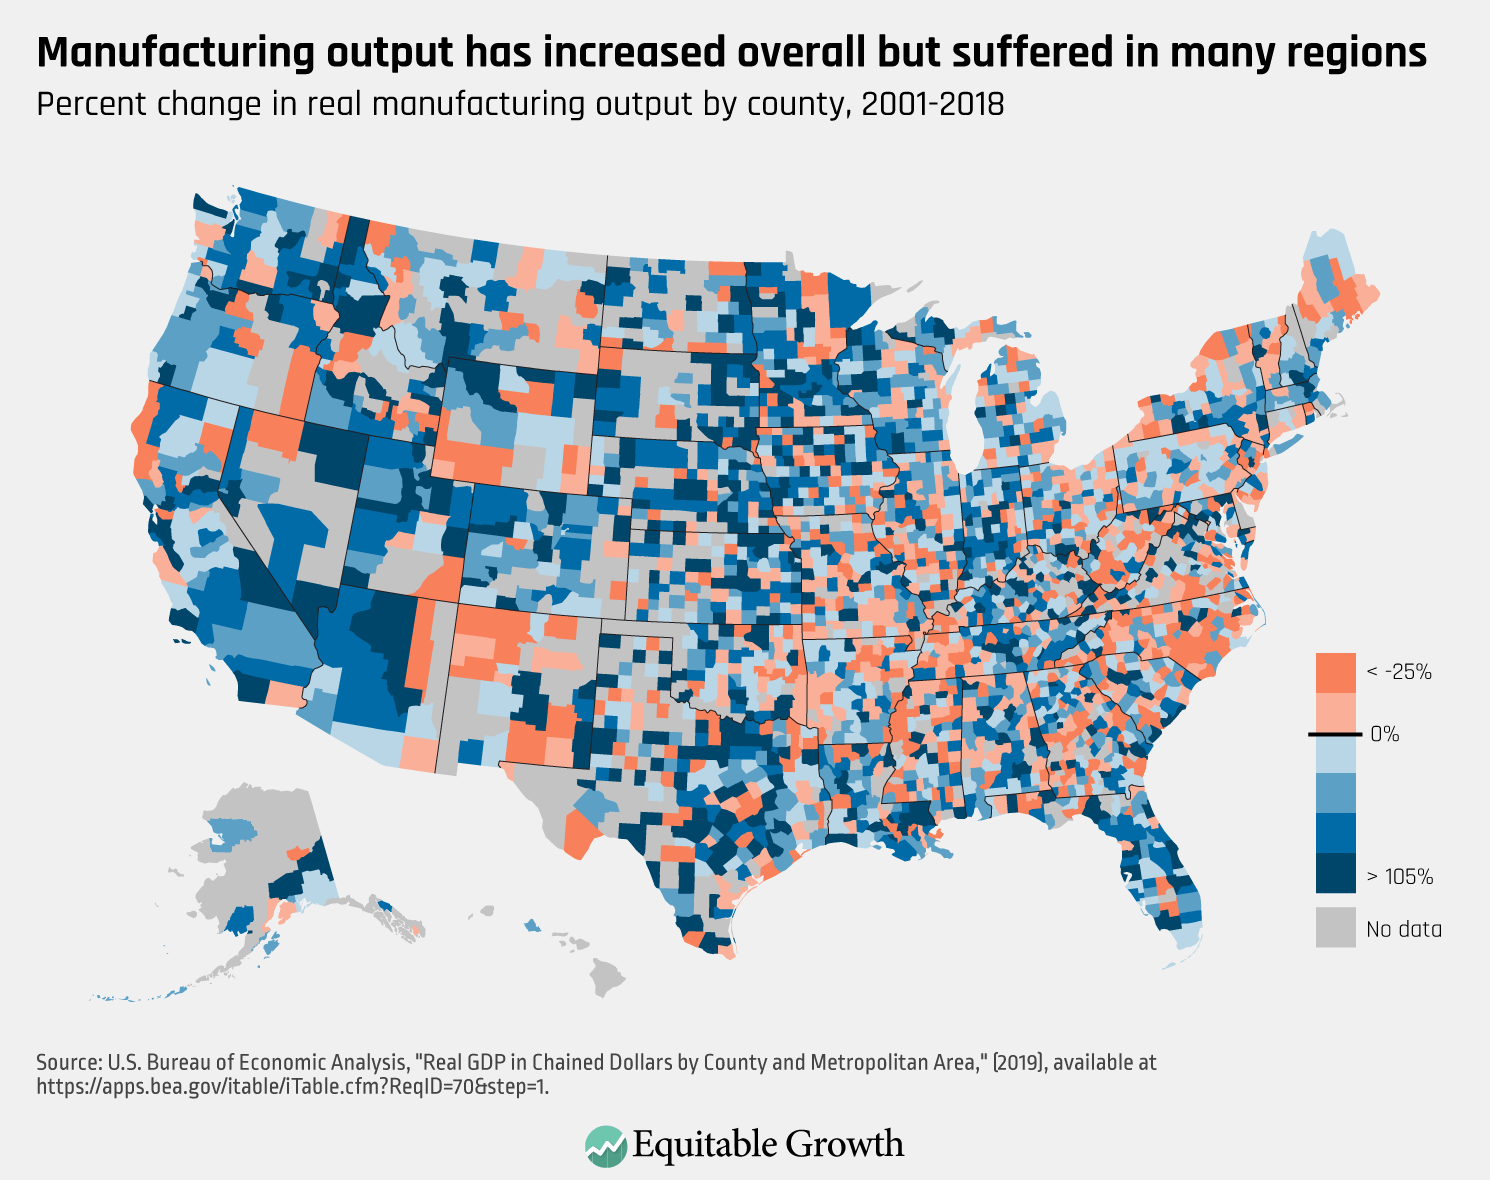
Using the data, trends in the manufacturing industry and how manufacturing has contributed to GDP pre- and post-Great Recession are also now more trackable. Looking at the data since 2001, manufacturing output increased overall, but clusters of counties on the East Coast and the Midwest suffered contractions. Although overall manufacturing output in North Carolina increased, many counties experienced heavy declines over the past 17 years. (See Figure 3.)
Figure 3
The new measure gives an insight into the geographic distribution of our nation’s economic activity, but it also highlights just how unequally distributed GDP is. When looking at real GDP (after accounting for inflation) at the county level, LAGDP shows that 20 percent of the nation’s economic growth is concentrated in 11 counties, including the cities of Los Angeles, New York, and Harris, Texas. At the other end of the spectrum, the new data show that 20 percent of GDP is contributed by approximately 2,700 counties with the lowest economic activity. Aggregated GDP measures are not able to paint the picture that 2,700 counties contribute as much to the nation’s economy as 11 of the largest counties in America. (See Figure 4.)
Figure 4
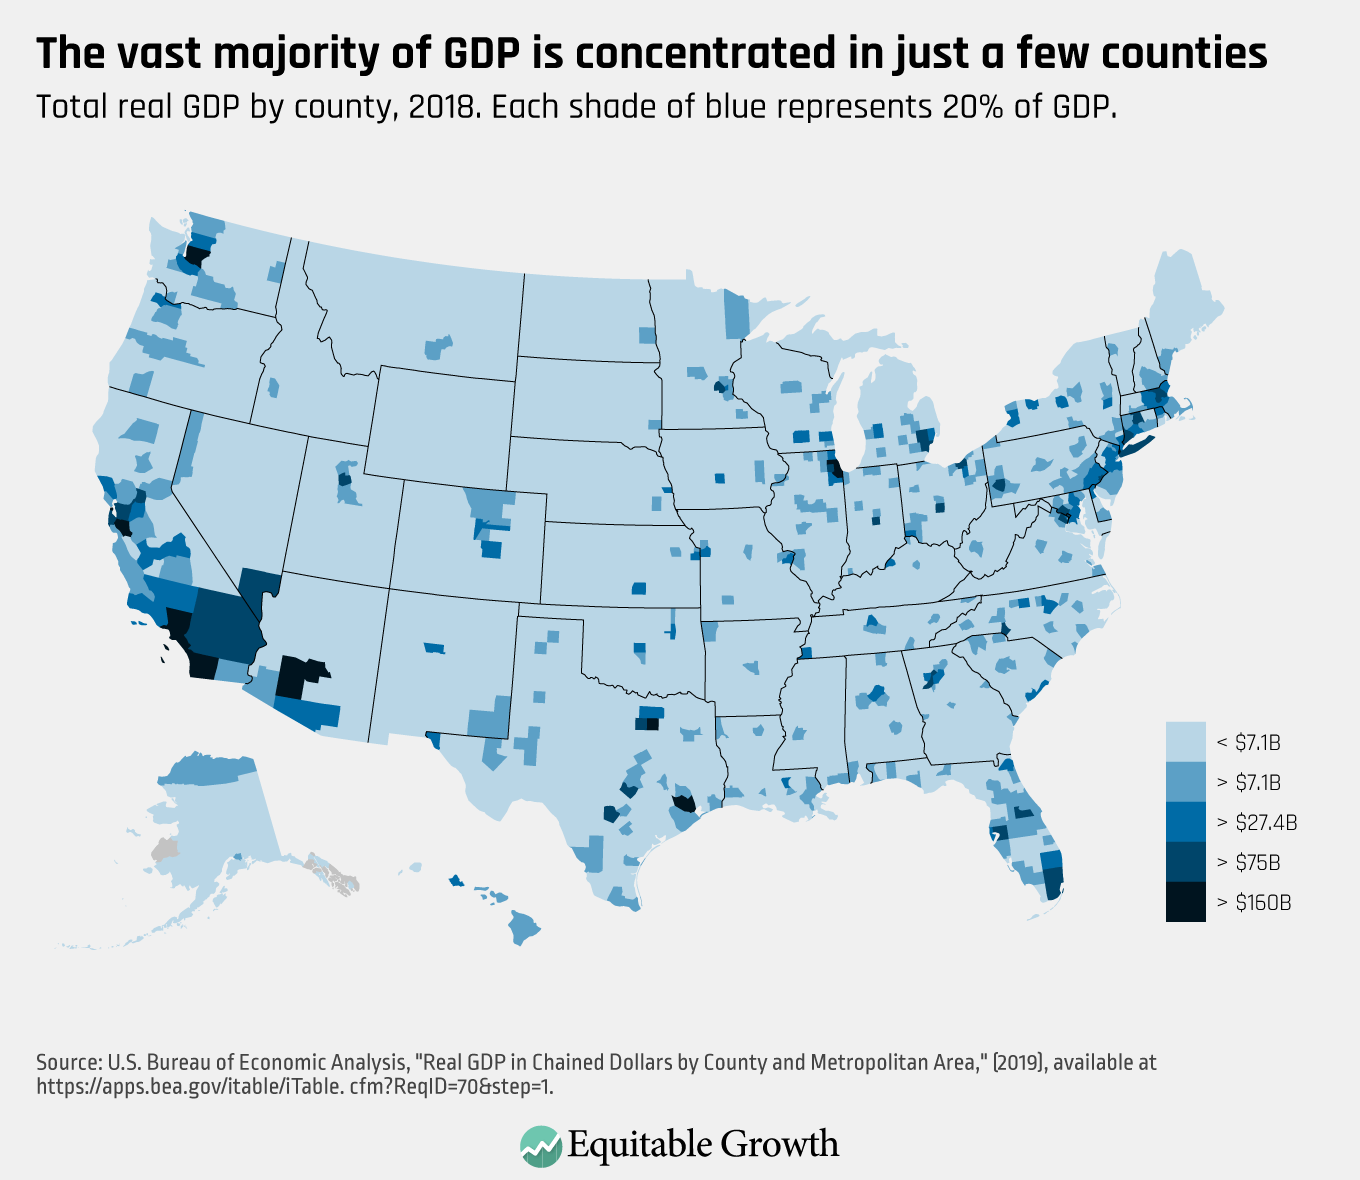
These comparisons don’t mean that workers are more productive in Los Angeles than elsewhere, since the new measurement doesn’t account for population size, which means LAGDP doesn’t capture the overall well-being of families in each county. For instance, Los Angeles contributed 3.8 percent of the national GDP, but LAGDP doesn’t show that approximately 15 percent of its residents are living in poverty. But the data highlights just how vast the urban-rural divide is and how concentrated our economic activity is.
In order to provide a clear picture to policymakers about how the economy works for households at all levels of the income spectrum, we need more disaggregated growth and income data. On its own, the new LAGDP measure has the potential to widen our understanding of the impact industries have on regional economies. Combining this data with disaggregated national income data would facilitate the study of the effects of and relationships between industry growth and income inequality at such levels.
Equitable Growth’s GDP 2.0 project, which proposes that the Bureau of Economic Analysis extend the National Income and Product Accounts to assess national income distribution, is a further step toward better understanding who prospers when the economy grows. In the hands of local policymakers, these tools can guide efficient resource allocation, economic development and investment strategies, and opportunities for growth.