This is a post we publish each Friday with links to articles that touch on economic inequality and growth. The first section is a round-up of what Equitable Growth published this week and the second is relevant and interesting articles we’re highlighting from elsewhere. We won’t be the first to share these articles, but we hope by taking a look back at the whole week, we can put them in context.
Equitable Growth round-up
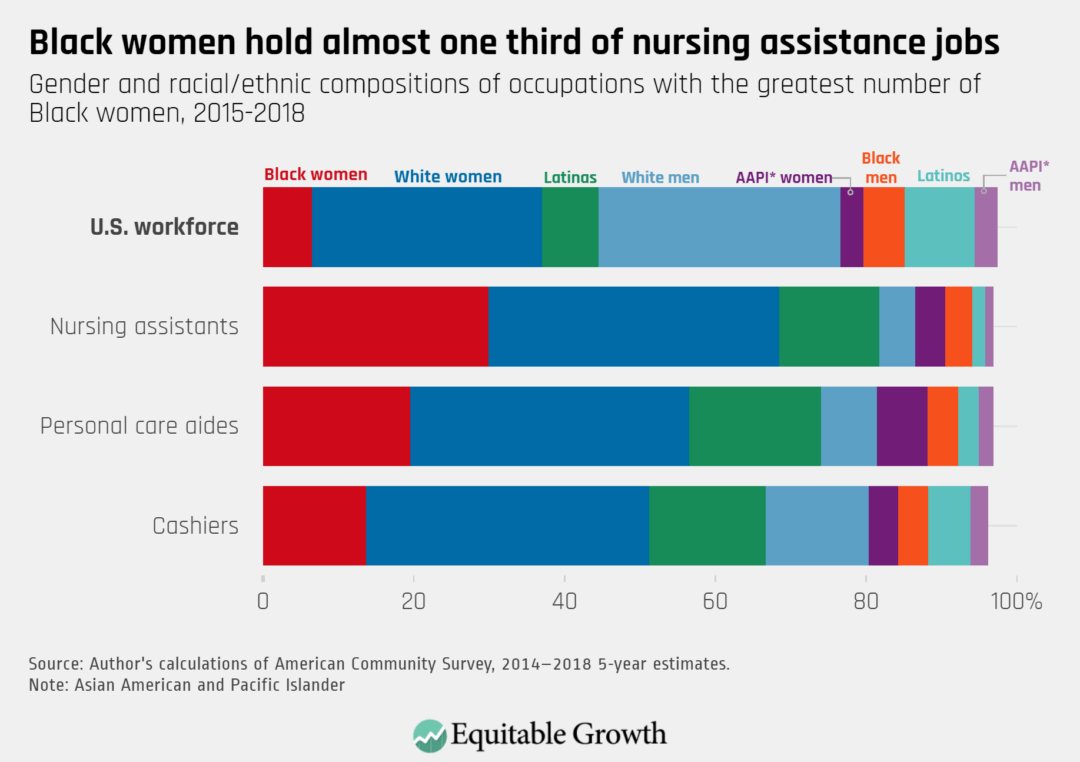
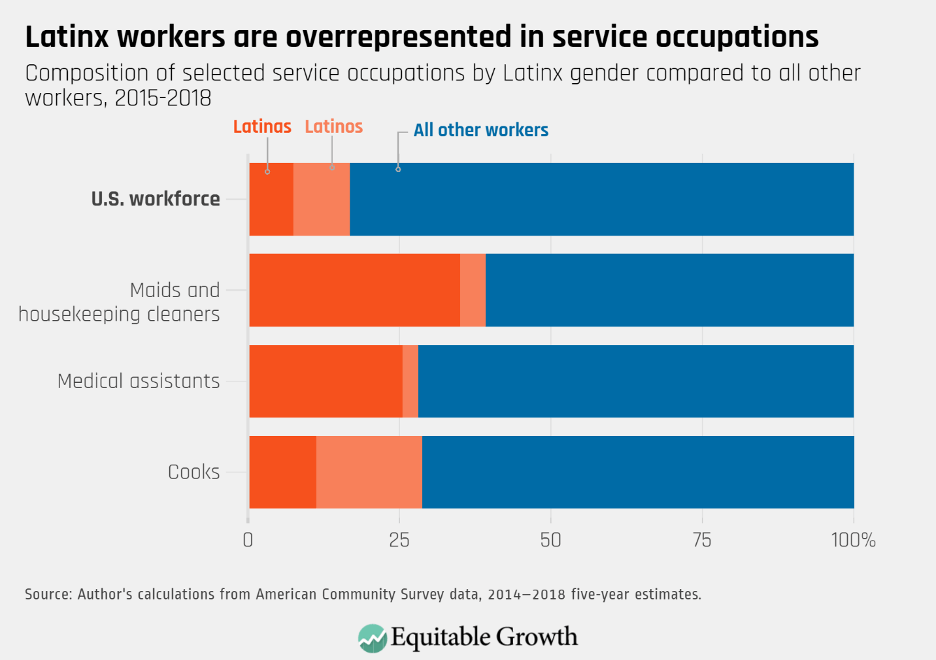
August 13 was this year’s Black Women’s Equal Pay Day, or the date until which Black women have to work, from the start of 2019 through to August 13, 2020, to earn as much as White men earned in 2019 alone. Women workers of color face unique barriers in the labor market at the intersection of race and gender. On average, Black women who are employed full time, year round earn 62 cents for every one dollar that their White men peers earn—a gap that most research shows can’t be fully explained by human capital variables. Kate Bahn and Carmen Sanchez Cumming answer five key questions about this day and why it falls more than 7 months into 2020—including factors such as decreased anti-discrimination enforcement, occupational segregation, and the role of labor market monopsony in exploiting Black women workers. Bahn and Sanchez Cumming also explain how enhancing worker power and increasing the minimum wage would help close the income and wealth divides for Black women workers.
The end of July saw important congressional testimony from the CEOs of Apple Inc., Amazon.com Inc., Facebook Inc., and Alphabet Inc.’s Google unit on competition in the tech industry. The hearing was focused on exclusionary conduct, or practices that allow dominant companies to prevent or stifle competition. While all four CEOs denied that their practices fall under the exclusionary conduct umbrella and instead are beneficial for consumers, Michael Kades shows how courts’ interpretations of the antitrust laws result in lenient enforcement and harmful anticompetitive behavior. Kades runs through the various current problems with U.S. antitrust enforcement and then explains how the Anticompetitive Exclusionary Conduct Prevention Act, a recent bill introduced by Sens. Amy Klobuchar (D-MN), Richard Blumenthal (D-CT), and Cory Booker (D-NJ), would better protect competition and reduce abusive market practices by dominant firms.
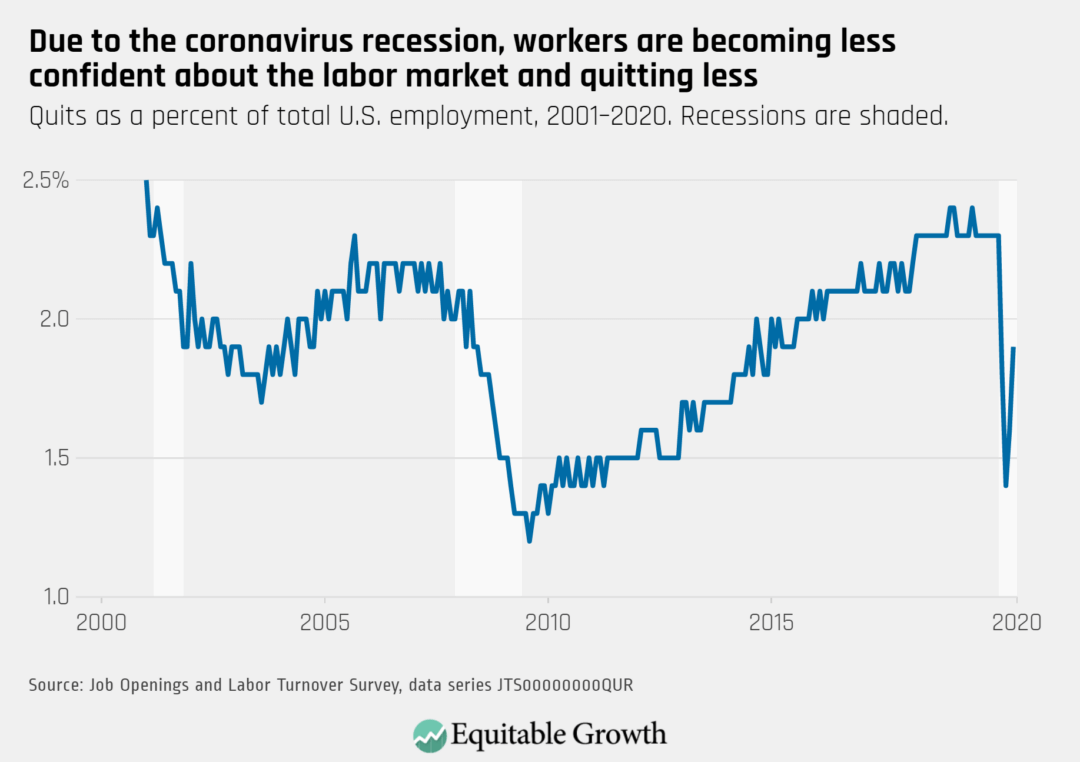
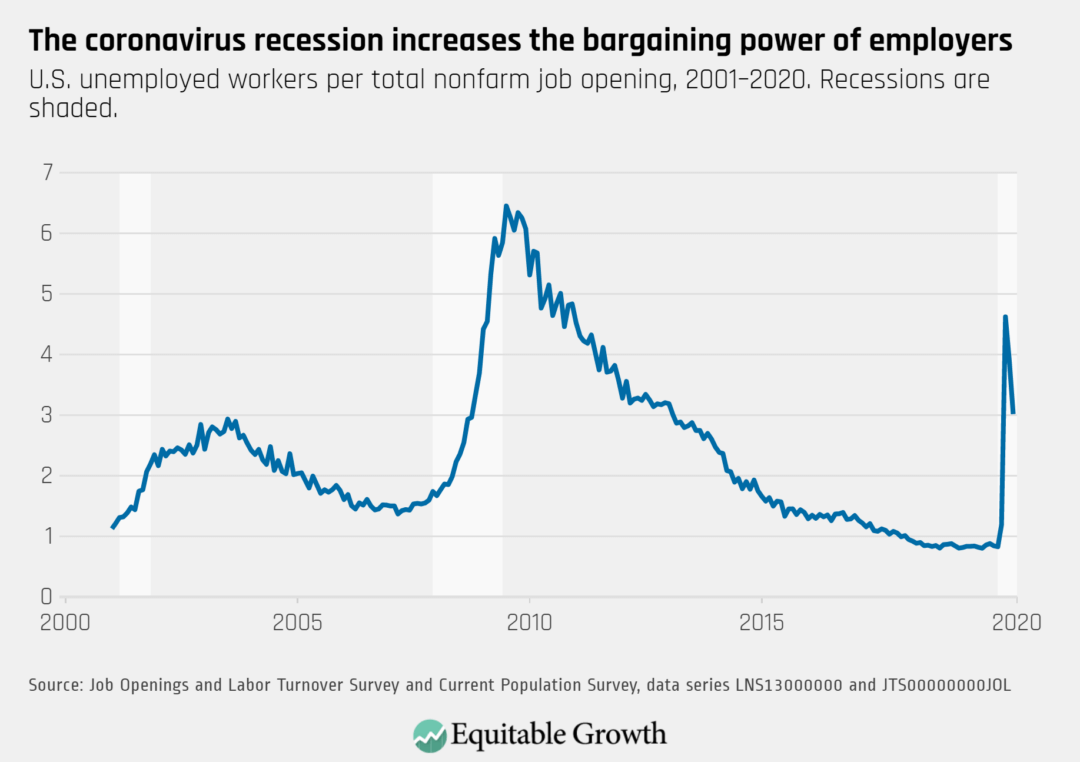
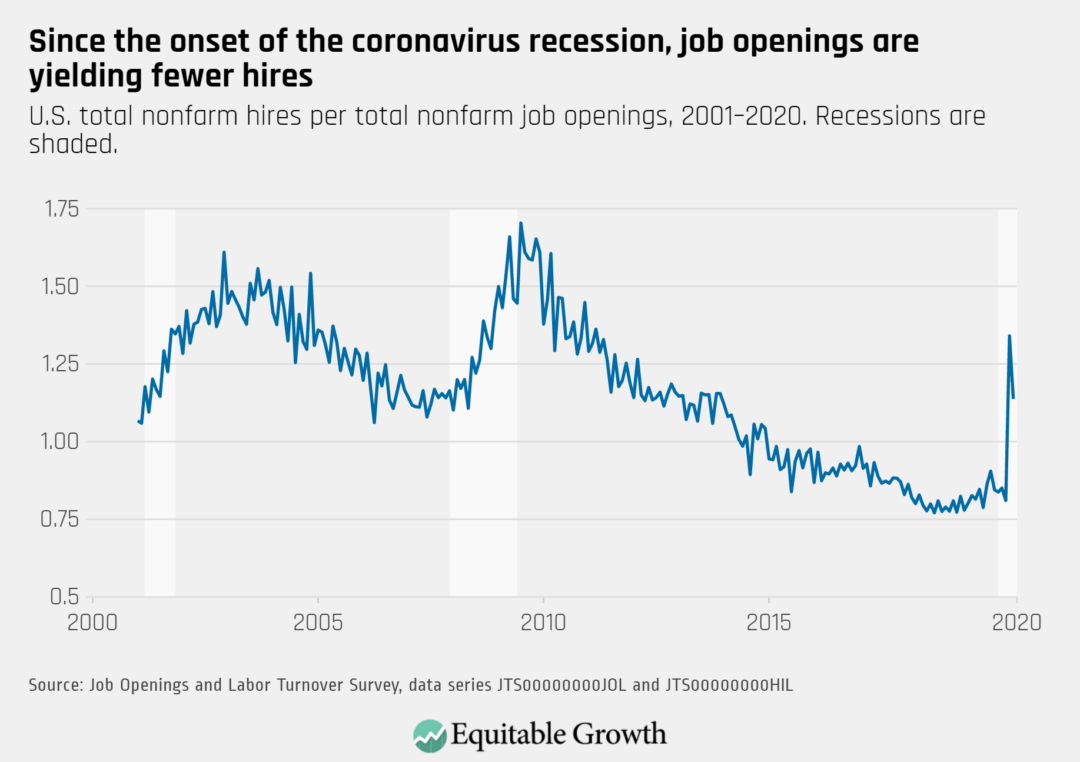
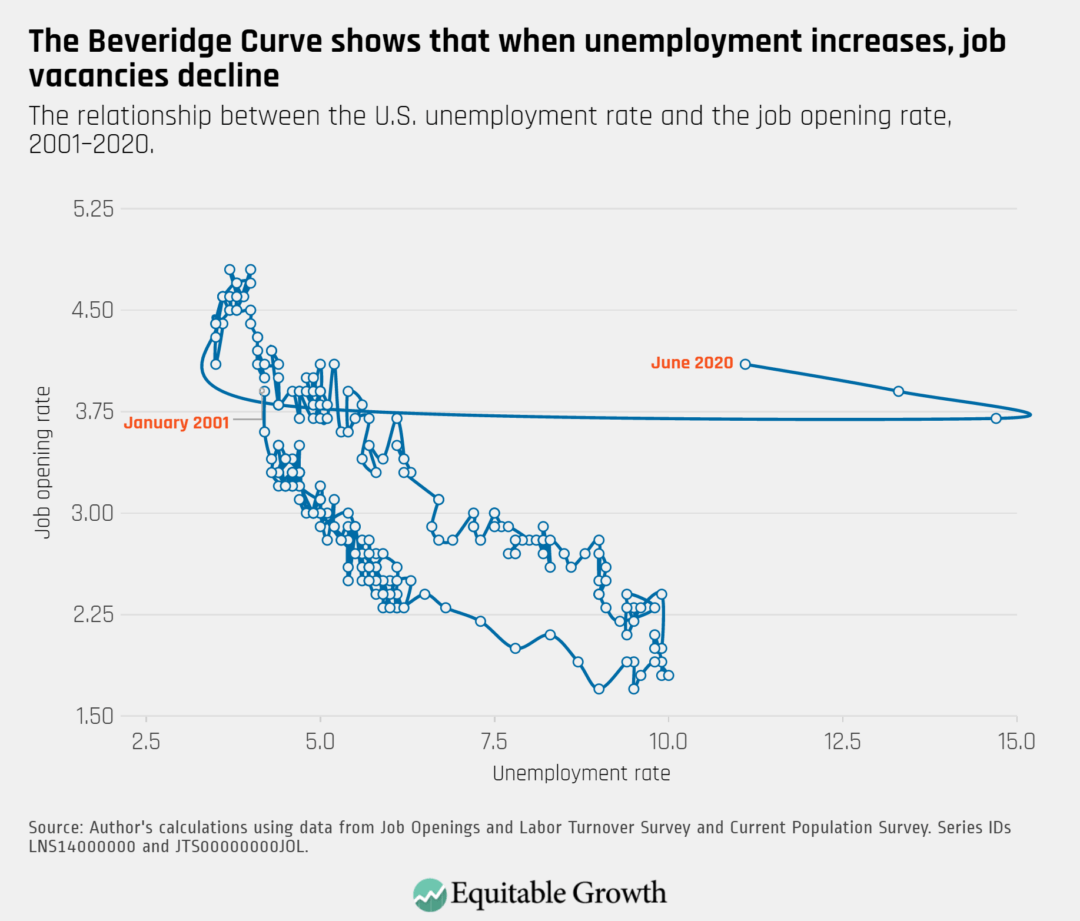
Every month, the U.S. Bureau of Labor Statistics releases the Job Openings and Labor Turnover Survey, which collects data on job openings, hires, layoffs, quits, and other U.S. labor market dynamics. Often, this release gets less attention than the monthly jobs report from the same agency, but JOLTS data can provide a different view of the labor market that is especially helpful during the coronavirus recession. Kate Bahn and Carmen Sanchez Cumming provide an overview of the four main labor market indicators to watch in JOLTS releases—the quits rate, the ratio of unemployed workers to job openings, the vacancy yield, and the Beveridge Curve—and explain how each one provides additional insight into why this downturn is different from previous ones.
This month’s Expert Focus from Christian Edlagan and Maria Monroe looks at scholars in the Equitable Growth network and beyond who have been pioneers in their approaches to understanding the role of race, ethnicity, and gender in the U.S. economy. These researchers have looked at how community and inequality intersect, centering racial equity more consciously in their analysis to foster interdisciplinary dialogue about the role of structural racism in driving wealth and income inequality in the United States.
Brad DeLong’s latest Worthy Reads highlights the most important content from Equitable Growth and around the web, and provides his insights and analysis on key take-aways.
Links from around the web
A recent New York Times interactive from Gus Wezerek looks at the effect that race has on mortality rates in the United States, and adjusts the numbers based on the coronavirus, highlighting that Black Americans have long had shorter lifespans than their White counterparts and that COVID-19, the disease caused by the virus, has exacerbated this trend. This is largely thanks to centuries-long, systematic neglect of Black people’s health in this country. In fact, between 1900 and 2015, if Black people had the same death rates as White people, 8.8 million fewer Black Americans would have died. These excess deaths cannot be attributed to genetics, explains Wezerek. And this fatal health disparity can’t be fully explained by income levels, educational achievement, or lifestyles between Black and White Americans. Rather, Wezerek writes, it has to do with structural racism and can be traced back to slavery and segregation. And though the disparities have narrowed in recent years as a result of legislation such as the Civil Rights Act and the Affordable Care Act, residential segregation and wealth and income disparities are still causing racial health inequities today, as evidenced by the disproportionate effect of the coronavirus on communities of color.
The economic repercussions of the coronavirus pandemic and resulting recession are hitting workers of color the hardest. Darrick Hamilton explains in Politico why enacting a paycheck guarantee would not only reduce the overall harm to the U.S. economy but also naturally direct assistance to Black workers who need it the most. A paycheck guarantee ensures workers receive their salary and benefits and remain connected to their employers regardless of the economic situation because the federal government steps in to pay them directly while requiring employers to keep workers on payroll for the duration of the crisis. A paycheck guarantee, Hamilton continues, also would ensure that even those workers who don’t currently have the option to work from home—disproportionately workers of color in the United States—would still receive their salaries, addressing the racialized impact of the coronavirus pandemic. Hamilton also shows that a paycheck guarantee is widely popular among the U.S. public, even across political party and racial lines. Many countries, from France to Australia, have put such programs in place during the coronavirus pandemic, preventing layoffs and business closures while keeping the unemployment rate relatively steady.
At the start of the coronavirus outbreak, grocery store workers were treated like heroes, showing up to work, despite the severe risks, so that the rest of us would remain well-fed and safe. Many received a temporary boost in pay as a gesture of appreciation from their employers for continuing to come in. But lately, writes Abha Bhattarai for The Washington Post, morale among supermarket staff is plummeting as many report feeling overworked, overwhelmed, and unappreciated—and sometimes even physically in harm’s way, when left to deal with hostile customers. For the workers who our society has deemed “essential,” many have been left feeling anything but. An increasing number of grocery store workers are quitting, sometimes even in the middle of their shifts, leaving the remaining staff to work harder, for more hours, and for less pay, as their hazard bonuses have long been eliminated. Bhattarai tells the story of several grocery employees across the country, who feel increasingly expendable amid the continuing health and economic crises, in an eye-opening account of what it’s like to work on the front lines of the coronavirus pandemic.
Friday figure
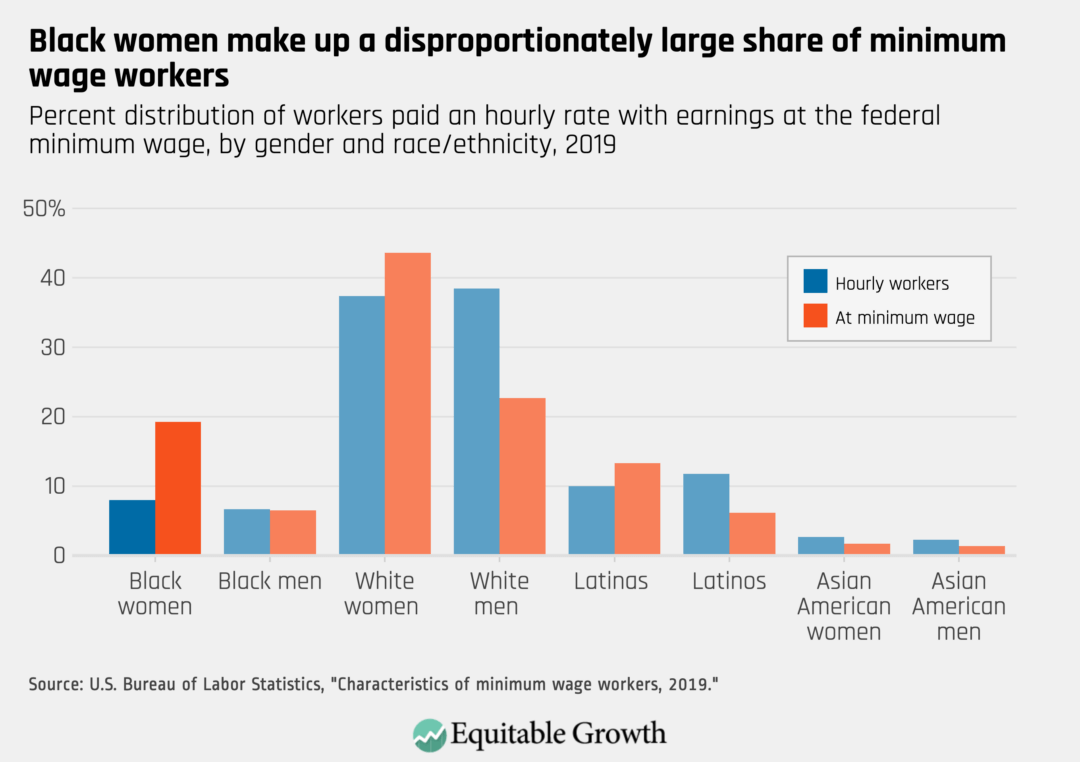
Figure is from Equitable Growth’s “Five ways to understand Black Women’s Equal Pay Day,” by Kate Bahn and Carmen Sanchez Cumming.