The distribution of wealth in the United States and implications for a net worth tax

Wealth inequality in the United States is high and has increased sharply in recent decades. This increase—alongside a parallel increase in income inequality—has spurred increased attention to the implications of inequality for living standards and increased interest in policy instruments that can combat inequality. Taxes on wealth are a natural policy instrument to address wealth inequality and could raise substantial revenue while shoring up structural weaknesses in the current income tax system.
This issue brief provides an overview of the distribution of wealth in the United States to inform discussion of a potential net worth tax—or other reforms to the taxation of wealth—in the United States. This brief draws from “Net worth taxes: What they are and how they work,” by Greg Leiserson, Will McGrew, and Raksha Kopparam.1
Download FileThe distribution of wealth in the United States and implications for a net worth tax
A net worth tax is an annual tax imposed on an individual or family’s wealth, or net worth. Wealth is the difference between the value of a family’s assets and liabilities. Assets are things a family owns, including both financial assets such as bank accounts, stocks, bonds, and ownership stakes in closely held businesses, and nonfinancial assets such as a car, house, or real estate. Liabilities are a family’s debts such as mortgages, credit card balances, and car loans.
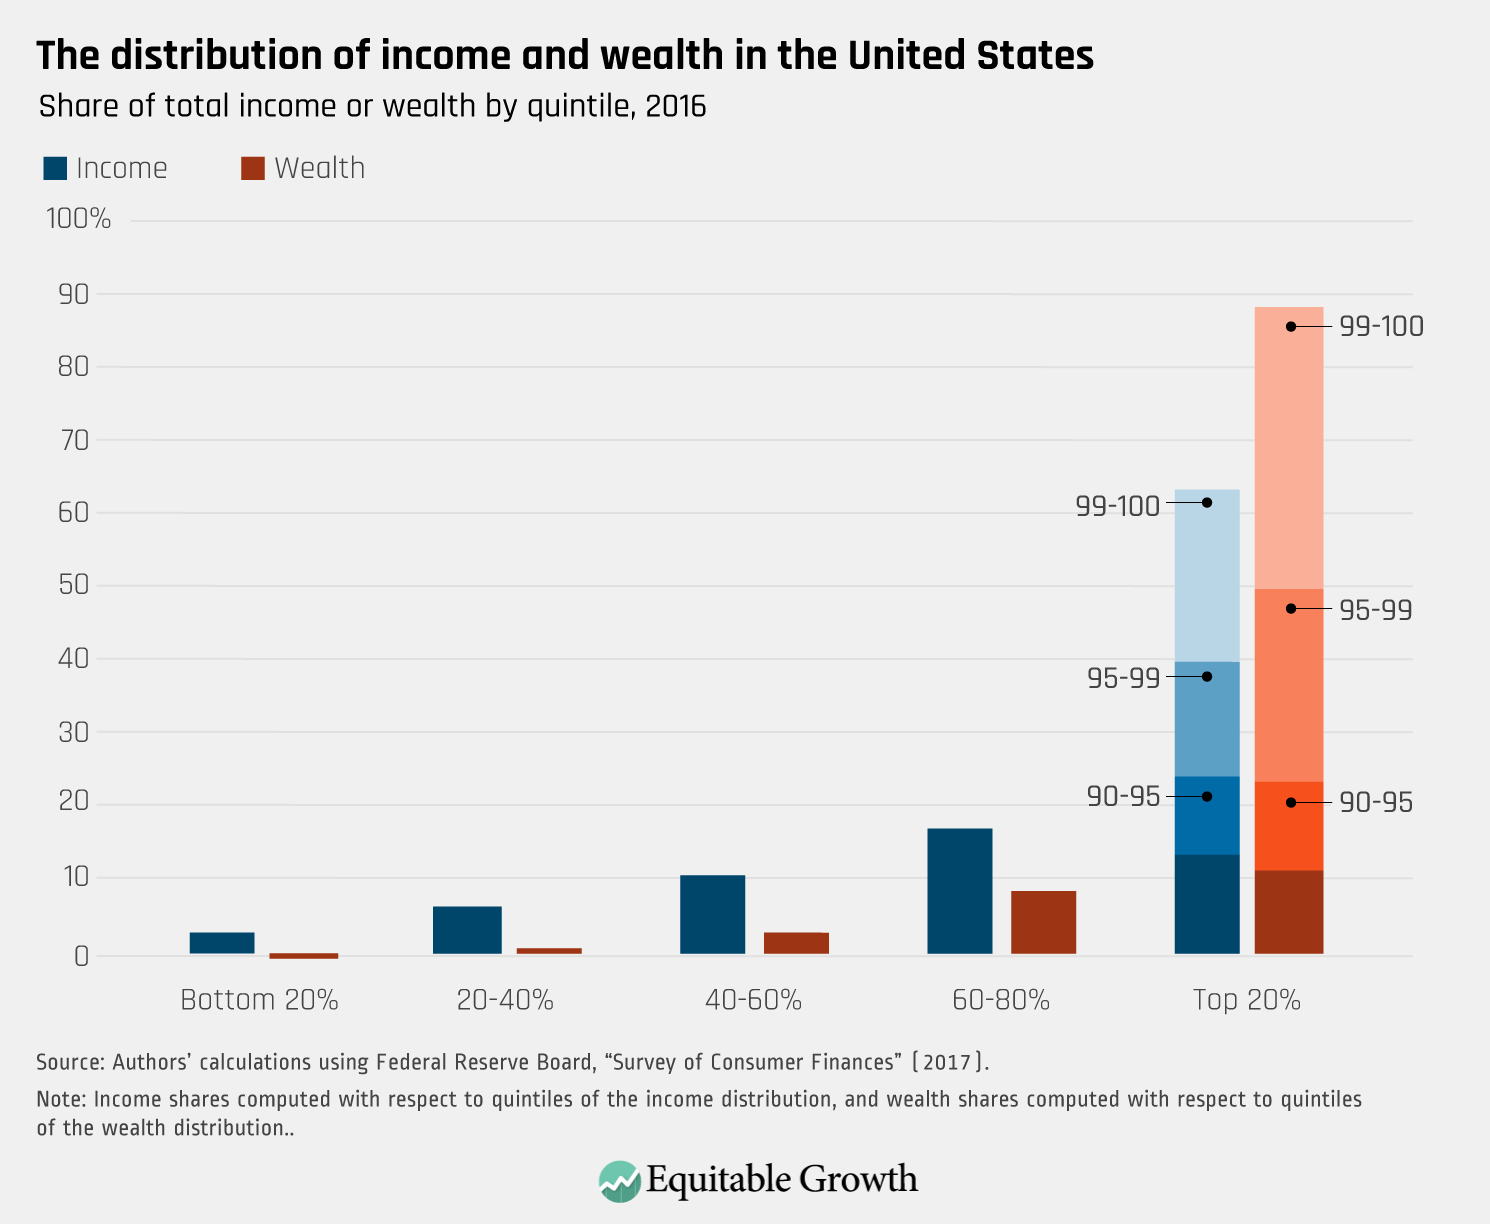
Wealth is distributed in a highly unequal fashion, with the wealthiest 1 percent of families in the United States holding about 40 percent of all wealth and the bottom 90 percent of families holding less than one-quarter of all wealth.2 (See Figure 1.) Notably, 25 percent of families have less than $10,000 in wealth. The share of wealth held by the wealthiest families substantially exceeds the share of income received by the highest-income families.
Figure 1
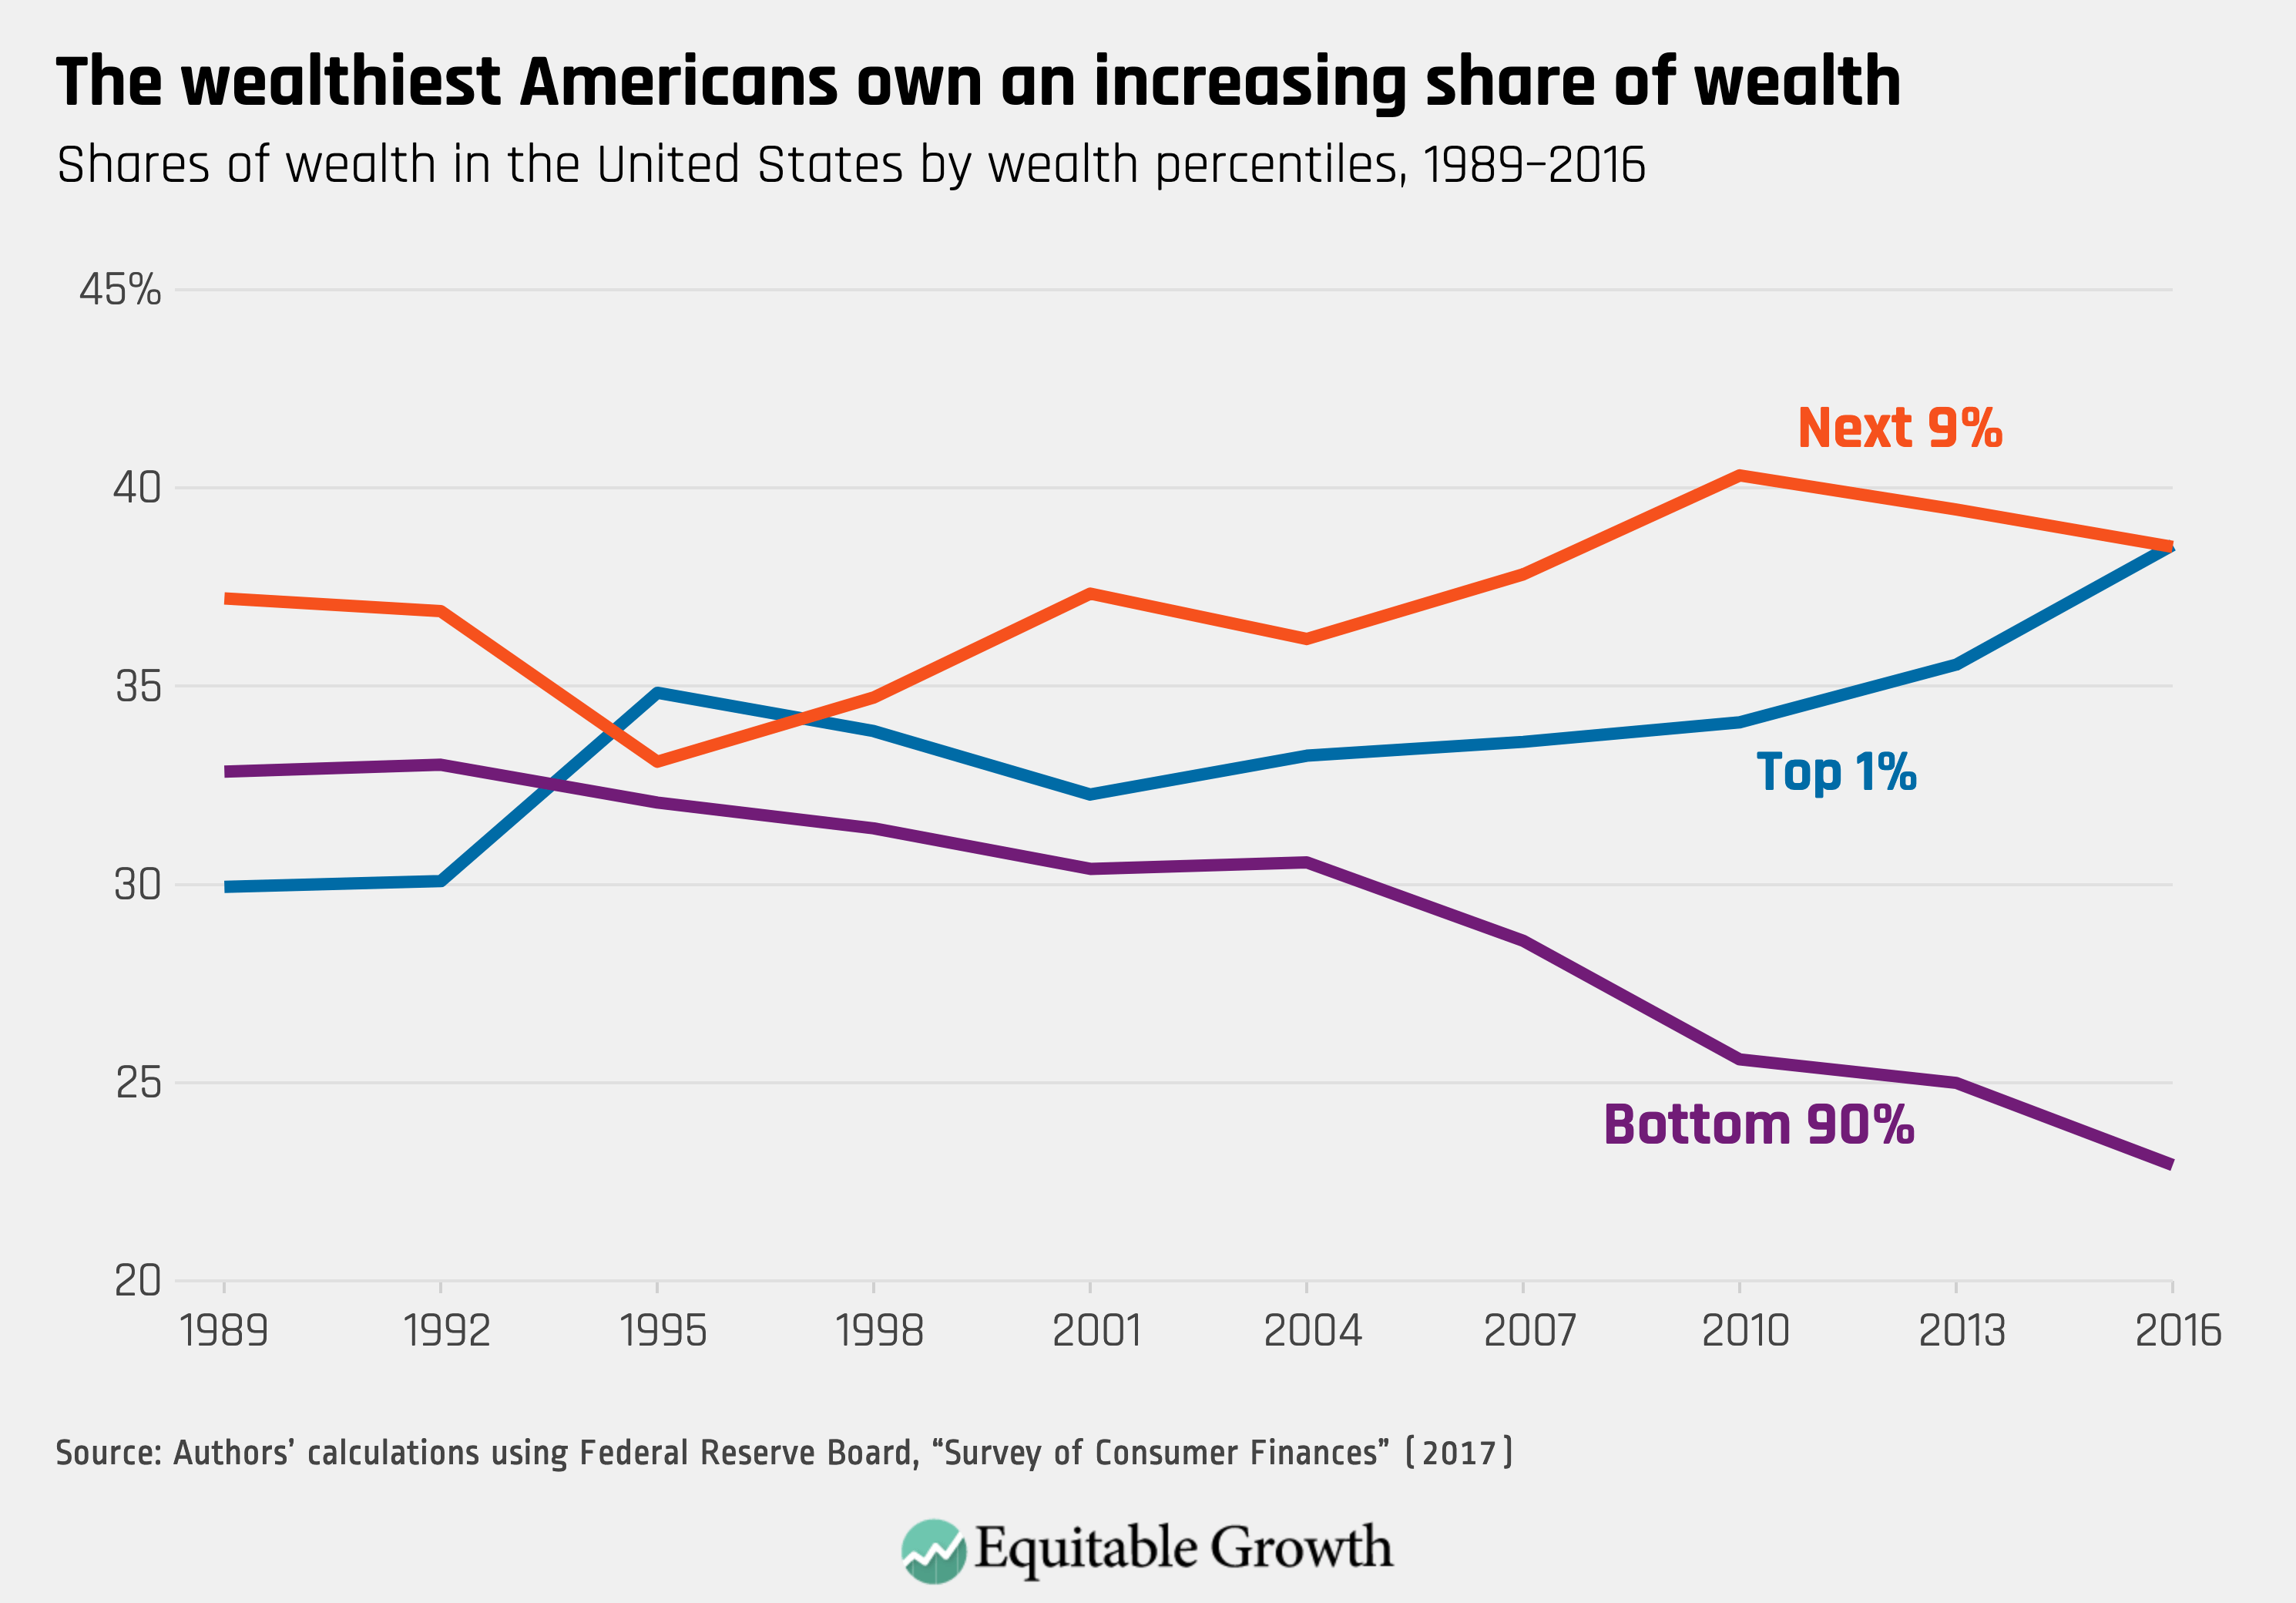
Wealth disparities have widened over time. In 1989, the bottom 90 percent of the U.S. population held 33 percent of all wealth. By 2016, the bottom 90 percent of the population held only 23 percent of wealth. The wealth share of the top 1 percent increased from about 30 percent to about 40 percent over the same period. (See Figure 2.)
Figure 2
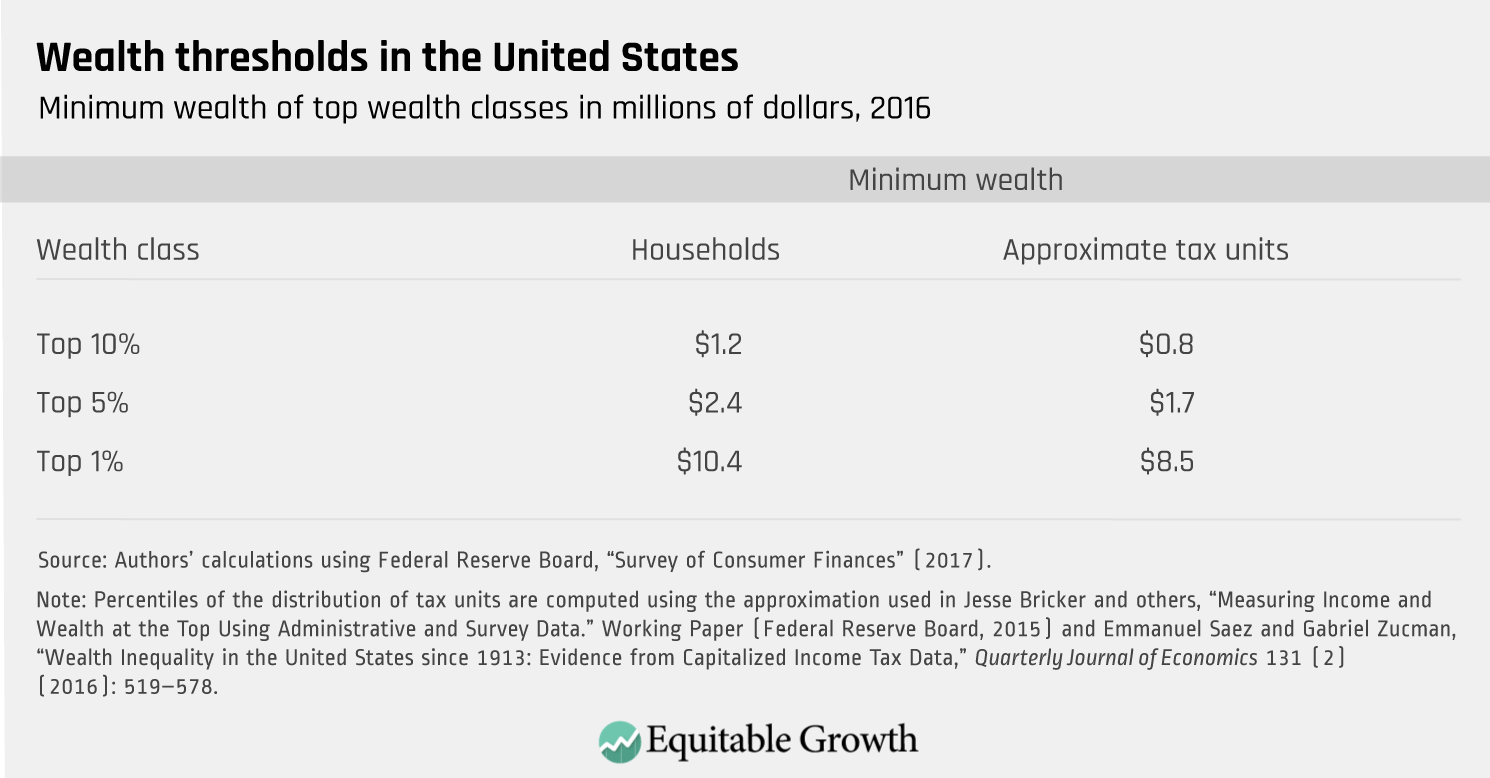
The high level of wealth inequality in the United States also is reflected in the substantial difference between median wealth ($97,000) and mean wealth ($690,000). As a result, 84 percent of families have wealth below the mean. The 90th percentile of the wealth distribution is $1.2 million. The 99th percentile of the wealth distribution is $10 million.
The percentiles of the wealth distribution near the top are smaller when people are grouped into tax units (the people appearing on the same tax return) rather than households, as there are low- or moderate-wealth tax units that are part of higher-wealth households. The 95th percentile of wealth among tax units is $1.7 million, and the 99th percentile of wealth among tax units is $8.5 million. (See Table 1.)
Table 1
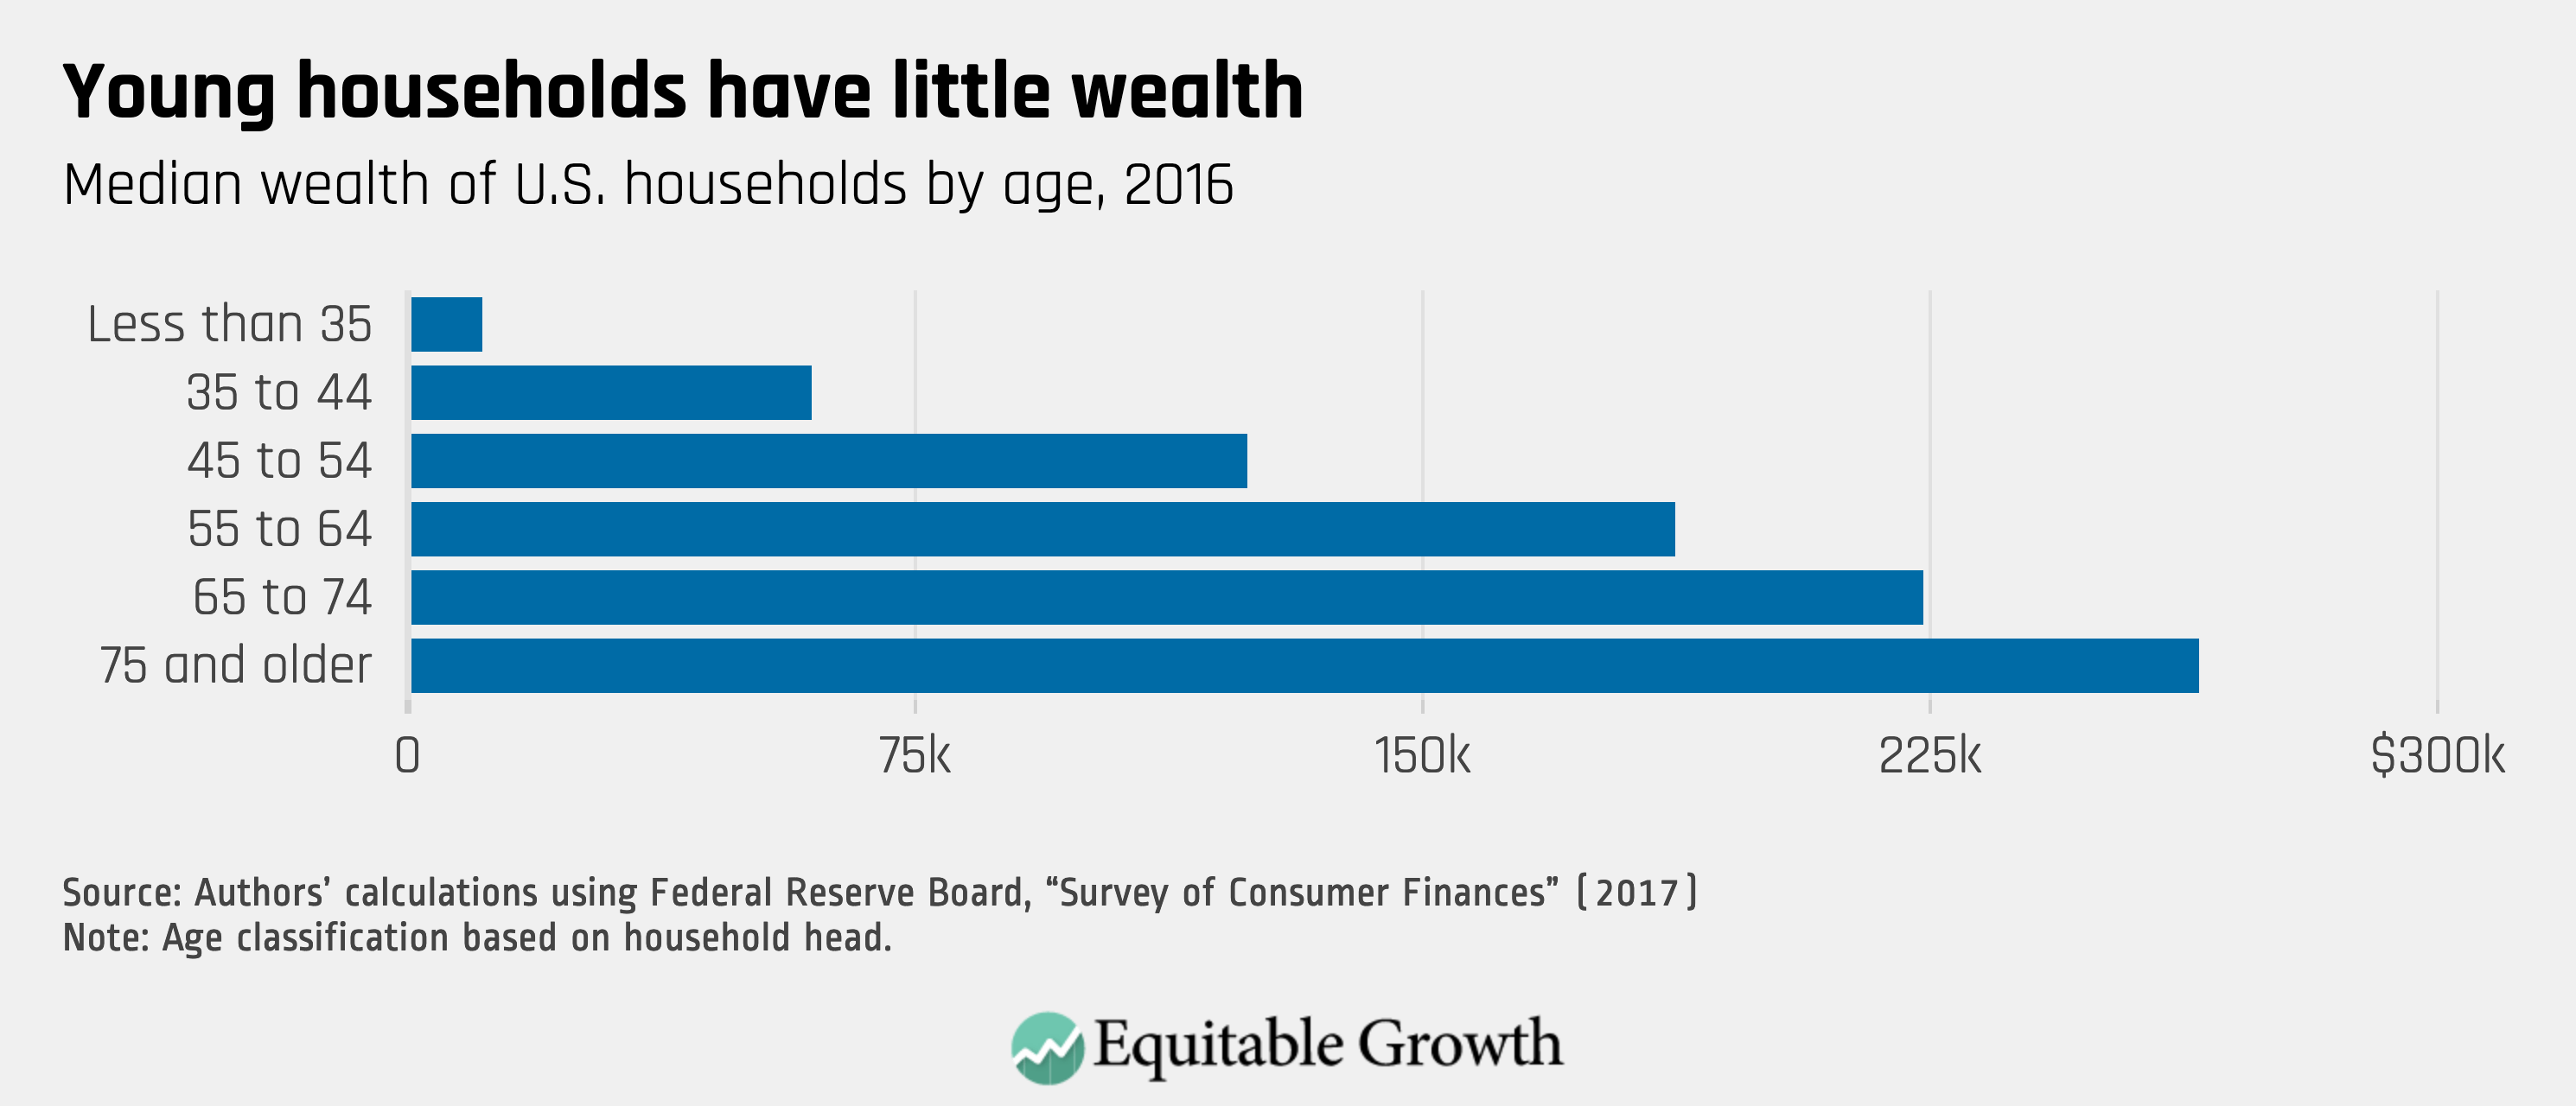
The highly skewed distribution of wealth is one of the primary reasons the burden of a net worth tax would be highly progressive.3 Moreover, systematic differences in wealth across age, race and ethnicity, and educational attainment mean that a net worth tax would shift the burden of the tax system not only from poor to rich, but also from younger families to older families and from families of color to white families. Median wealth for a family with a head of household younger than 35 years old in 2016 was $11,000, while median wealth for a family with head of household age 65 to 74 was $224,000. (See Figure 3.)
Figure 3
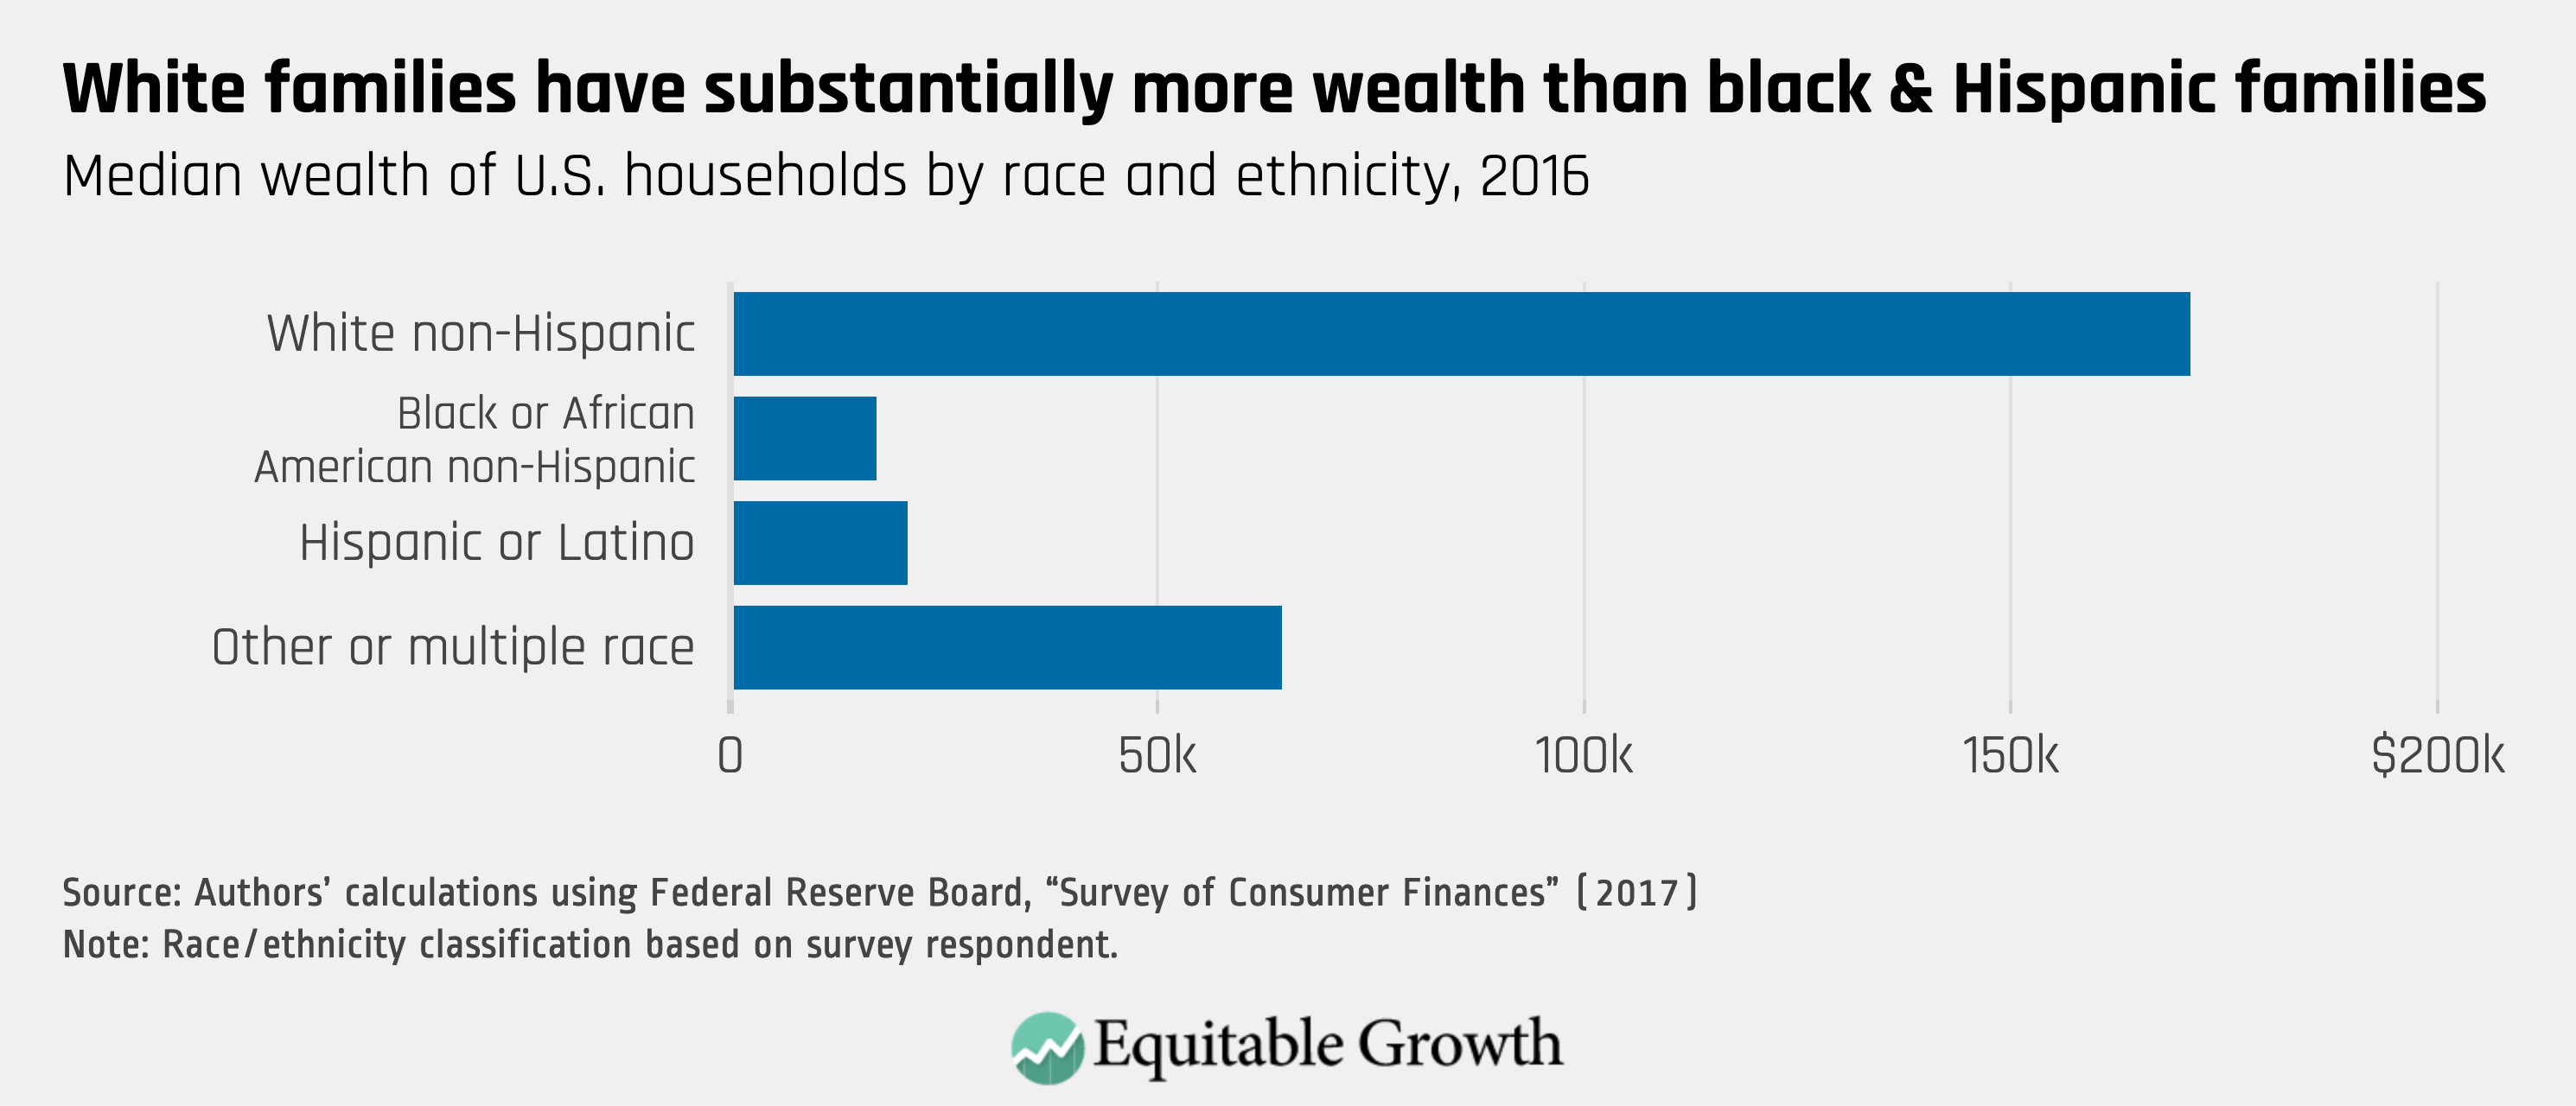
Median wealth for families in which the survey respondent was white and not Hispanic or Latino in 2016 was $171,000. Median wealth for families in which the survey respondent was black or African American and not Hispanic or Latino was $17,000, and median wealth for families in which the survey respondent was Hispanic or Latino was $21,000. Median wealth for all other families was $65,000. (The sample for the Survey of Consumer Finances is too small to disaggregate wealth among the diverse groups that make up this population.) (See Figure 4.)
Figure 4
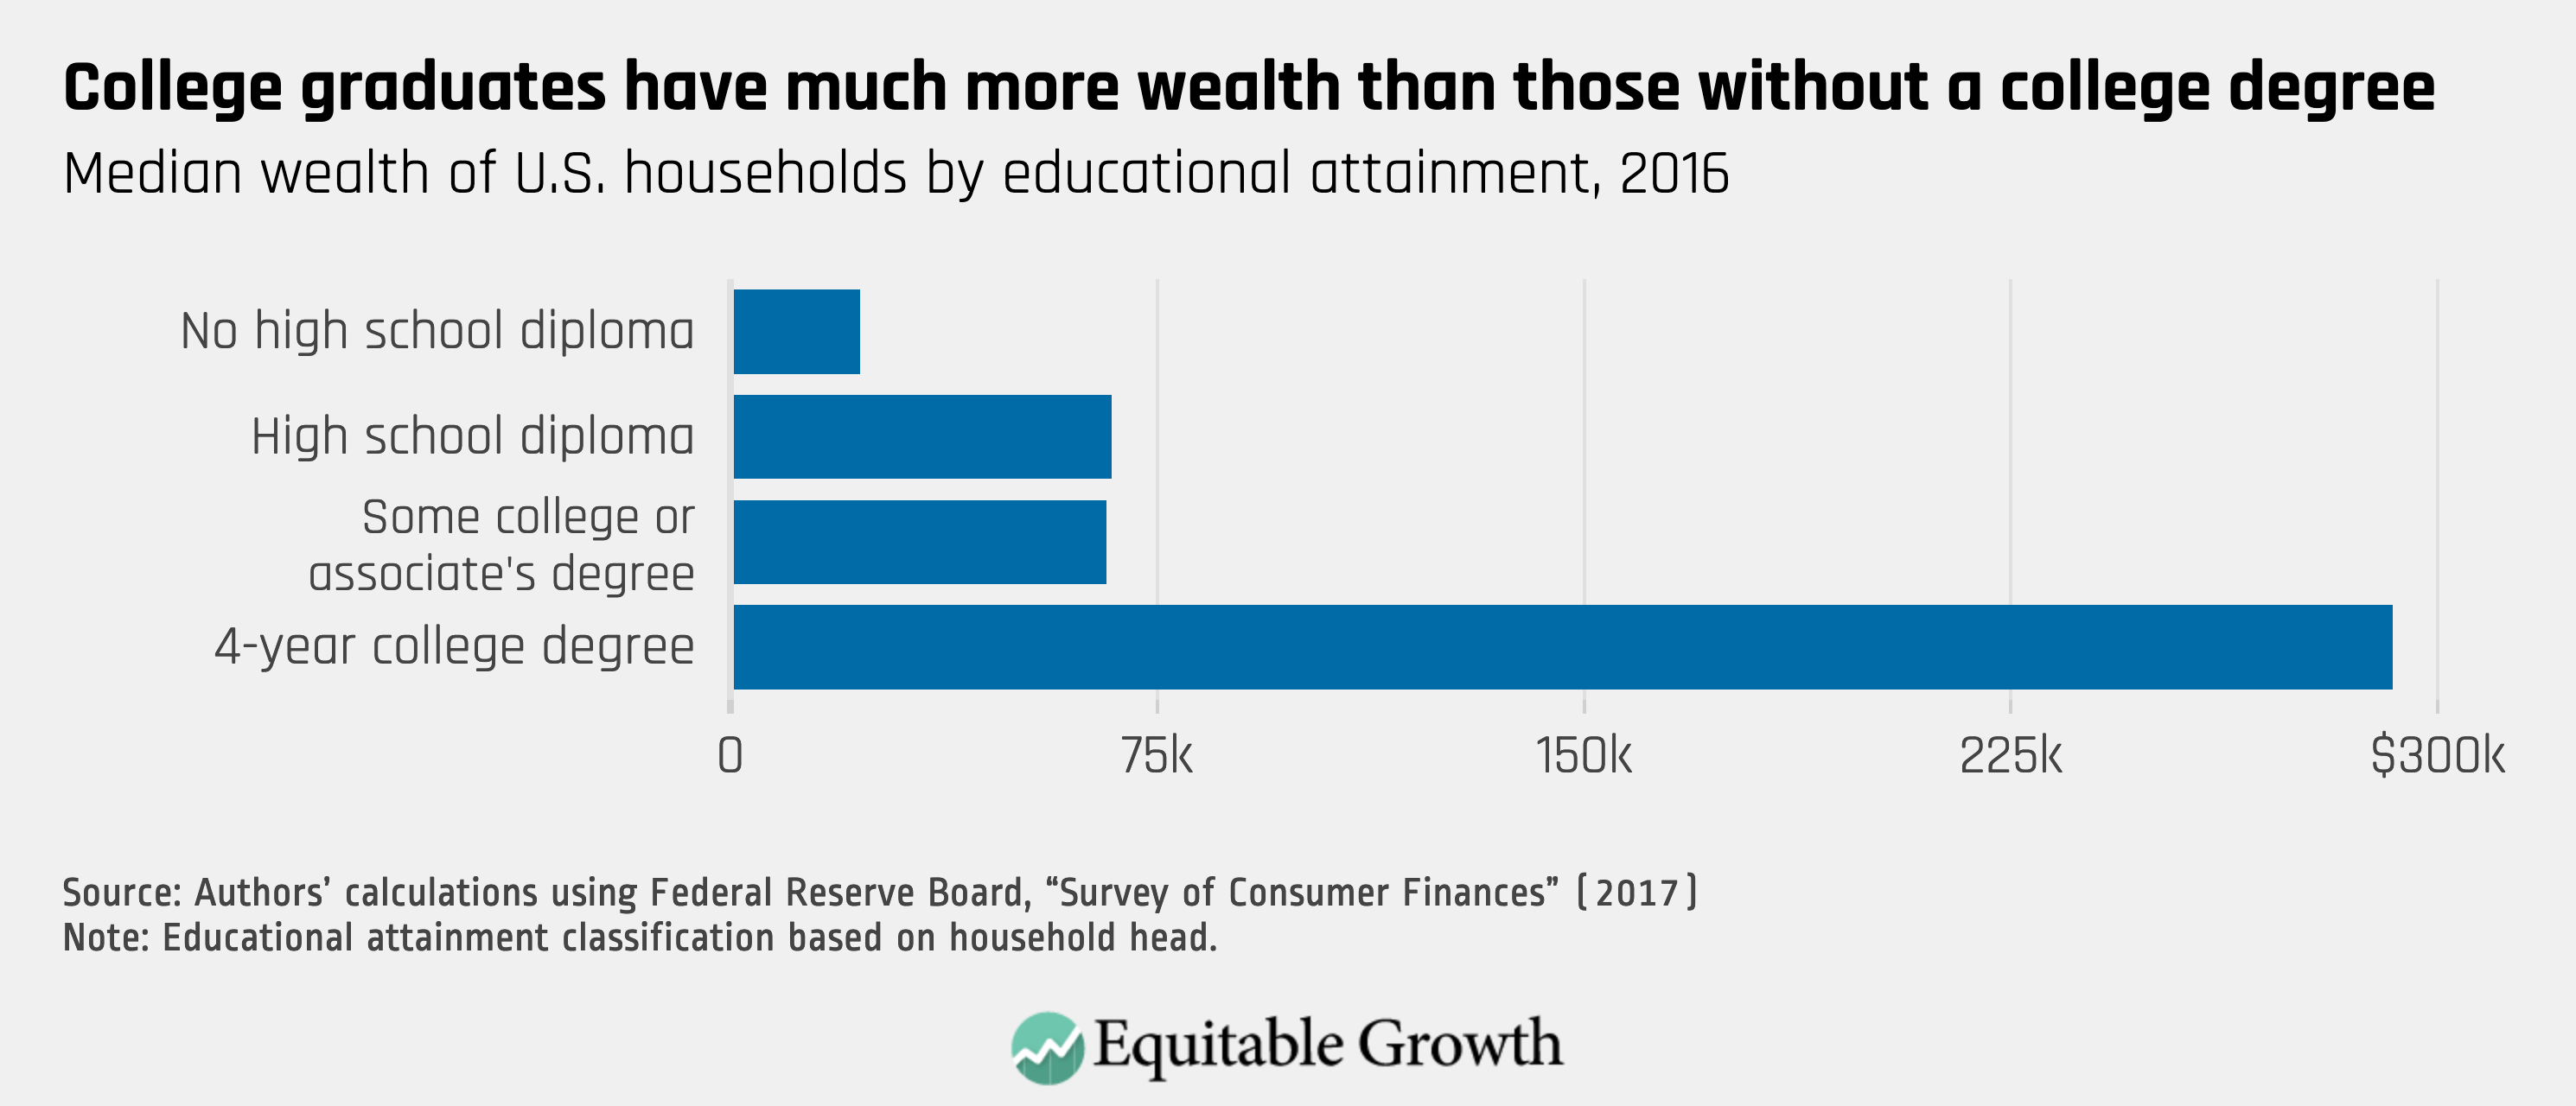
Families in which the household head has a 4-year college degree had median wealth of $292,000 in 2016. In contrast, families in which the household head had attended some college or has an associate degree had median wealth of $66,000, and families in which the household head has a high school diploma had median wealth of $67,000. Families in which the head did not have a high school diploma had median wealth of only $23,000. (See Figure 5.)
Figure 5
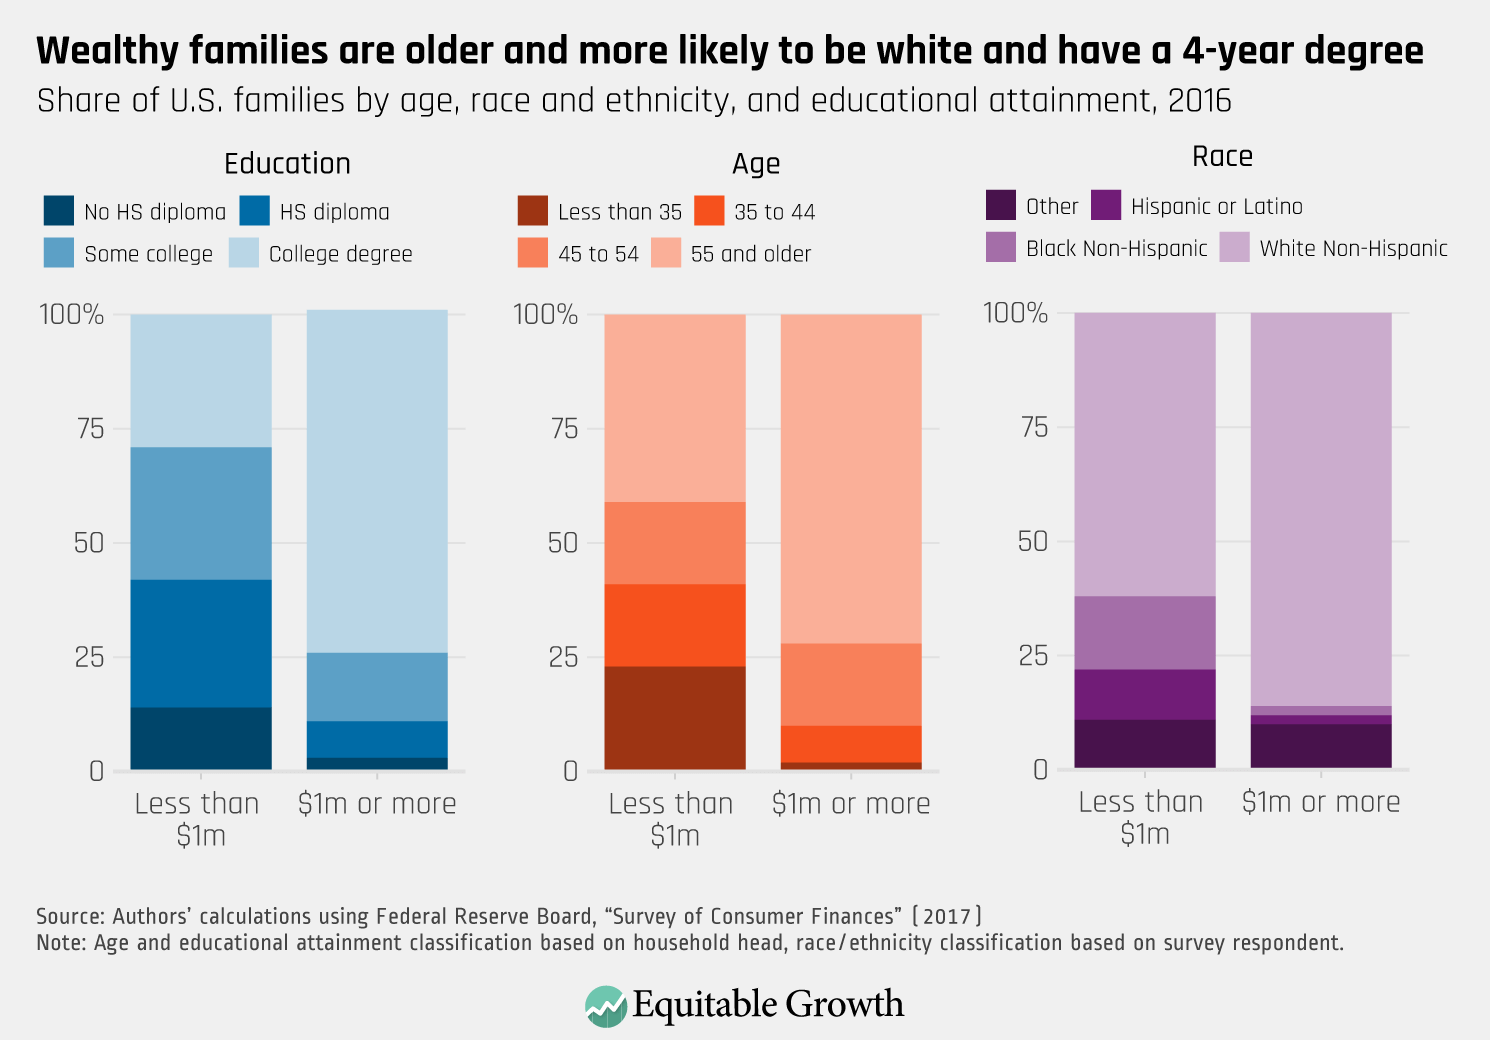
Net worth taxes typically apply only to the relatively wealthy or extremely wealthy and exempt the rest of the population. The patterns of wealth inequality among the entire population shown above are mirrored among the wealthy. Families with $1 million of wealth or more are older, more likely to be white, and more likely to have a 4-year college degree than the population as a whole. (See Figure 6.)
Figure 6
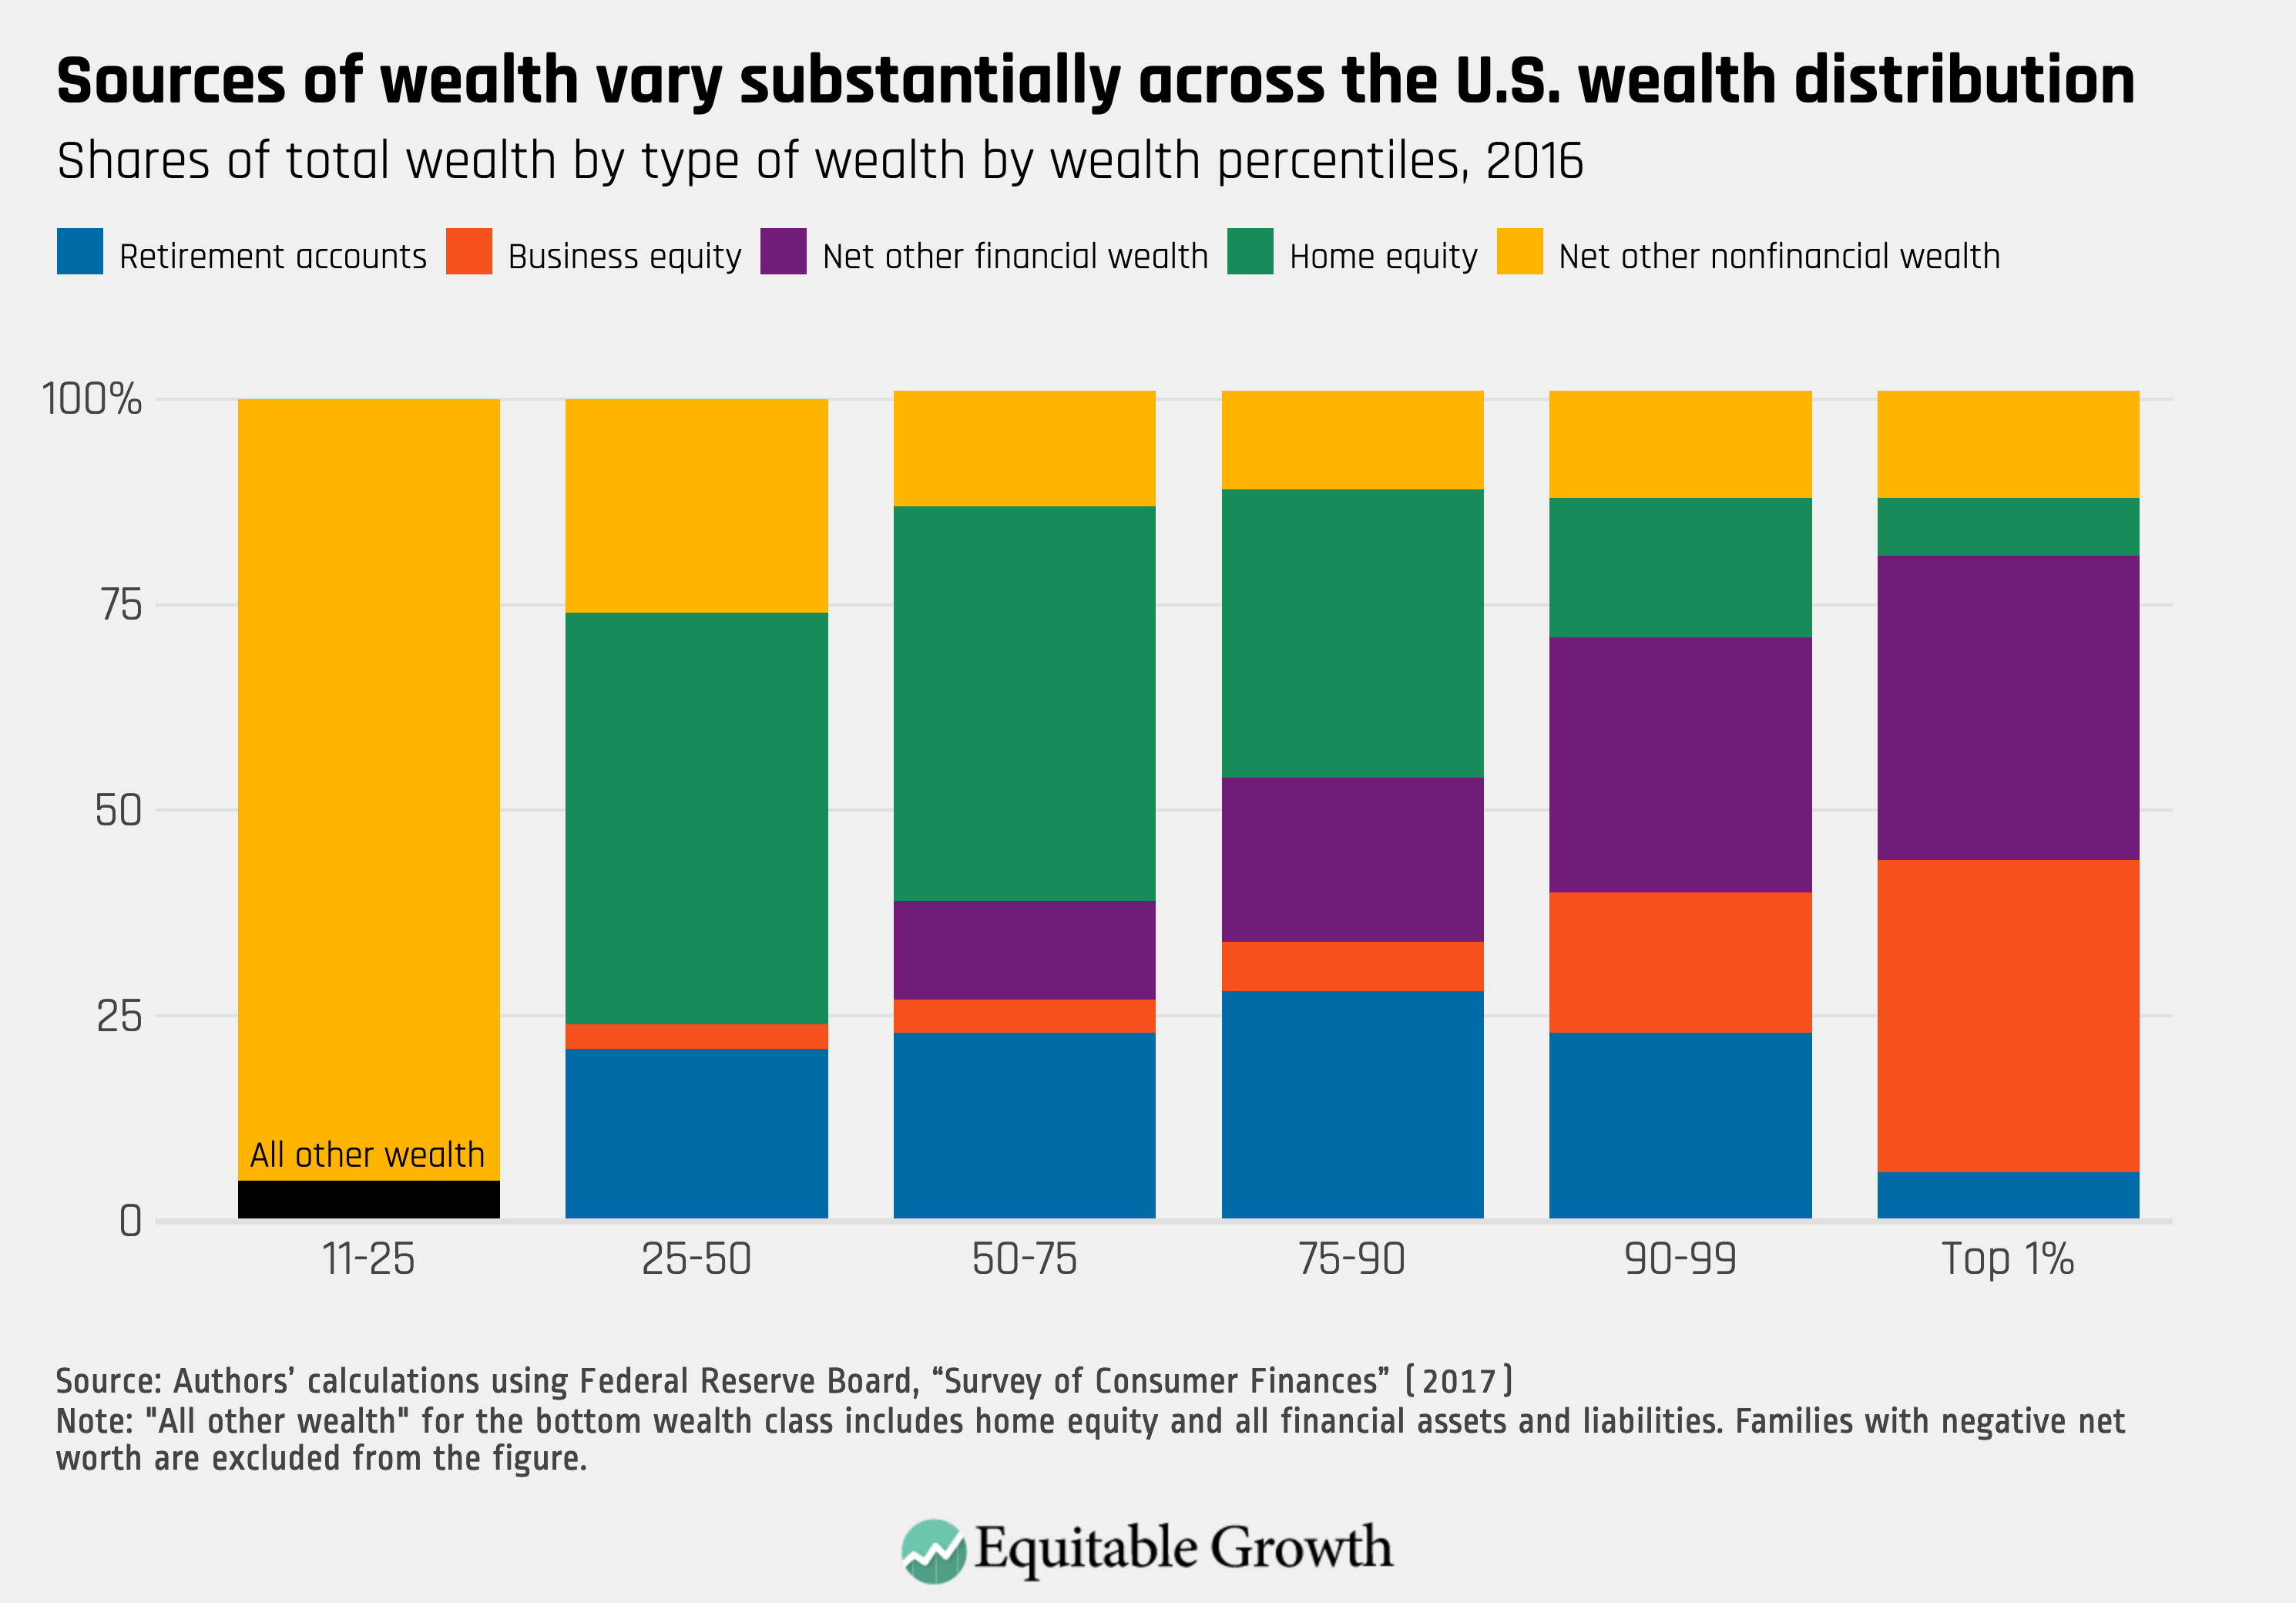
Low-wealth and high-wealth families differ in terms of the assets and liabilities they hold. Cars and other vehicles account for the overwhelming majority of wealth for low-wealth families. Middle-wealth families hold much more of their wealth in home equity, with more modest contributions from retirement accounts, bank accounts, and cars. Very high-wealth families hold much more of their wealth in business equity and financial assets outside retirement accounts. (See Figure 7.)
Figure 7
End Notes
1. Greg Leiserson, Will McGrew, and Raksha Kopparam, “Net worth taxes: What they are and how they work” (Washington: Washington Center for Equitable Growth, 2019).
2. All tabulations in this brief rely on the public-use version of the 2016 Survey of Consumer Finances. No adjustment is made for the exclusion of the Forbes 400 from the survey. Including such an adjustment would modestly increase the top wealth share.
3. In the case of a targeted net worth tax, shifting of the burden from those legally obligated to pay the tax to other groups is likely modest. Thus, the statutory incidence of the tax is a reasonable guide to the economic incidence of the tax.