JOLTS Day Graphs: April 2020 Report Edition
Every month the U.S. Bureau of Labor Statistics releases data on hiring, firing, and other labor market flows from the Job Openings and Labor Turnover Survey, better known as JOLTS. Today, the BLS released the latest data for April 2020. This report doesn’t get as much attention as the monthly Employment Situation Report, but it contains useful information about the state of the U.S. labor market. Below are a few key graphs using data from the report.
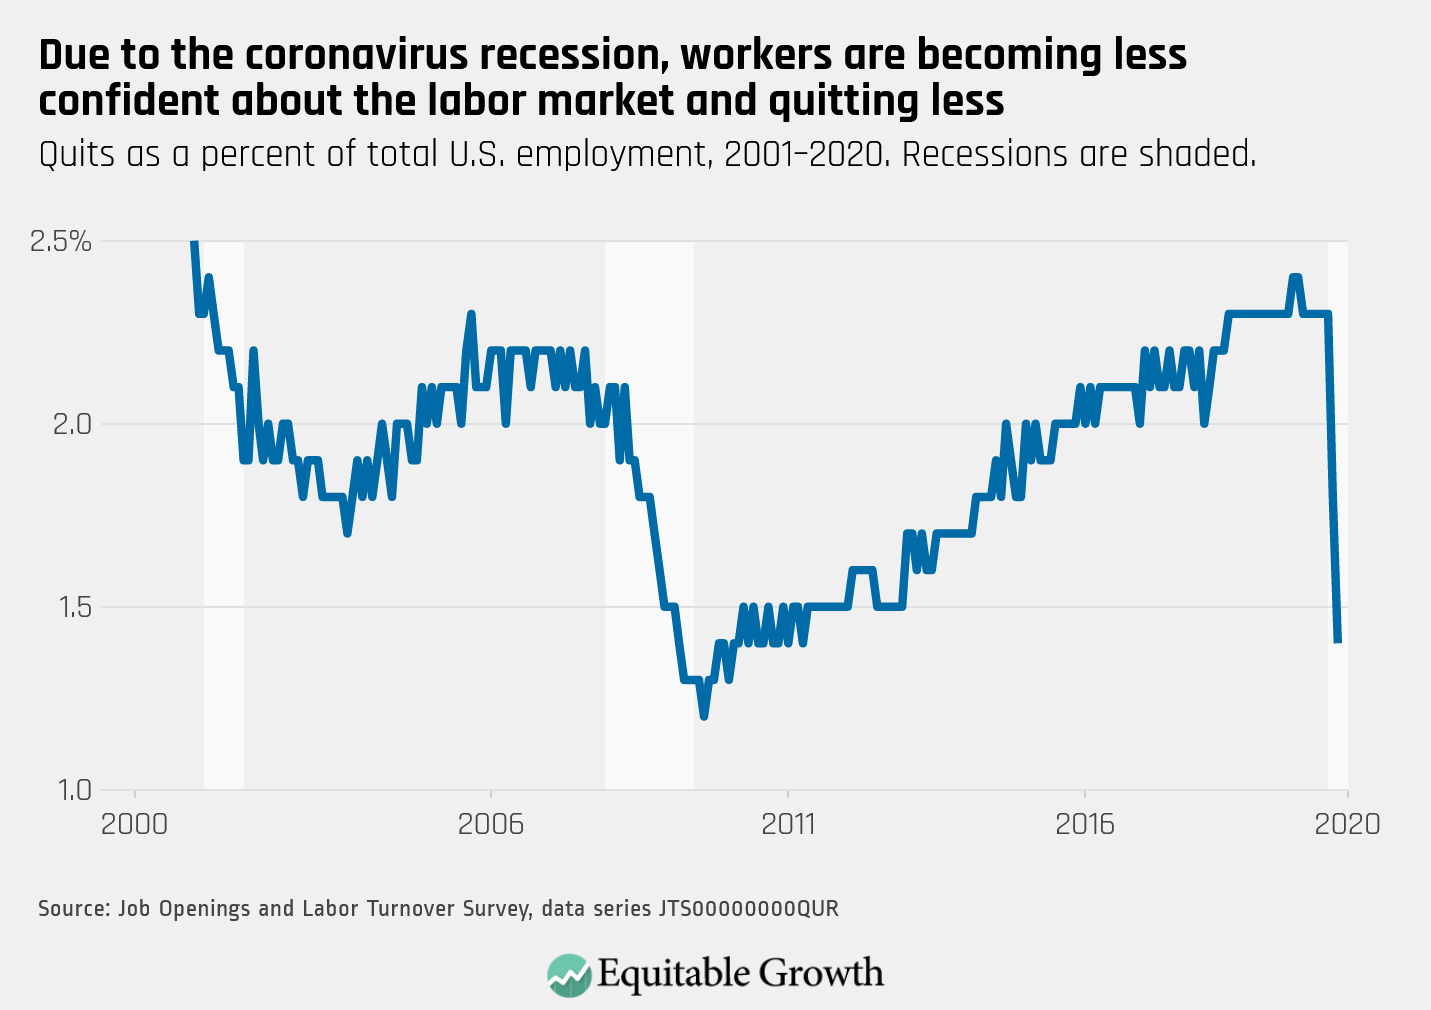
1.
The quit rate continued to fall in April, declining to 1.4% from 1.8% in March, down from a steady 2.3% in the months prior to the recession.
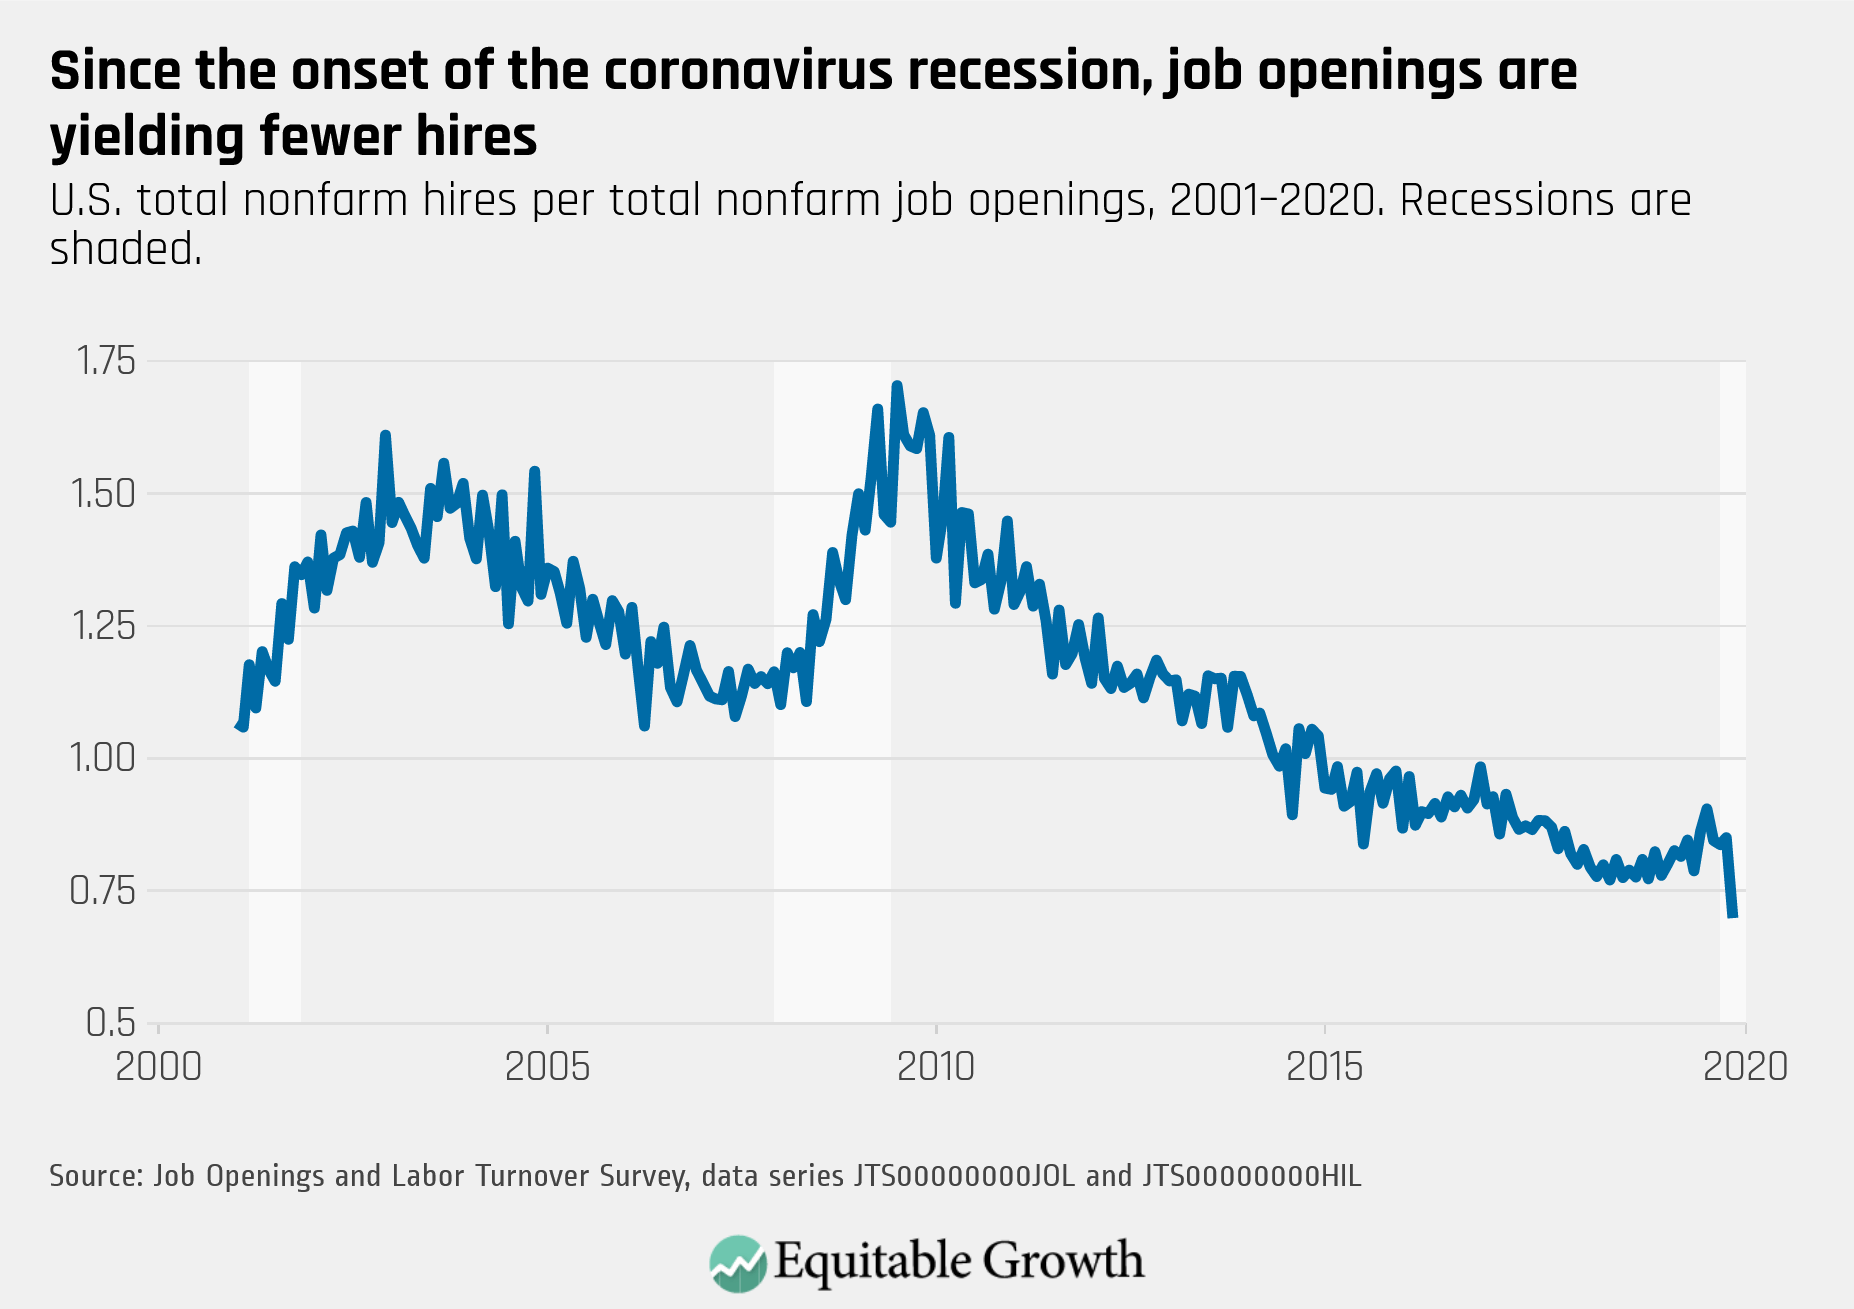
2.
As hires reached a low of 3.5 million (since the data began collection in 2000) and openings declined to 5.0 million, the vacancy yield continued to trend downward in April.
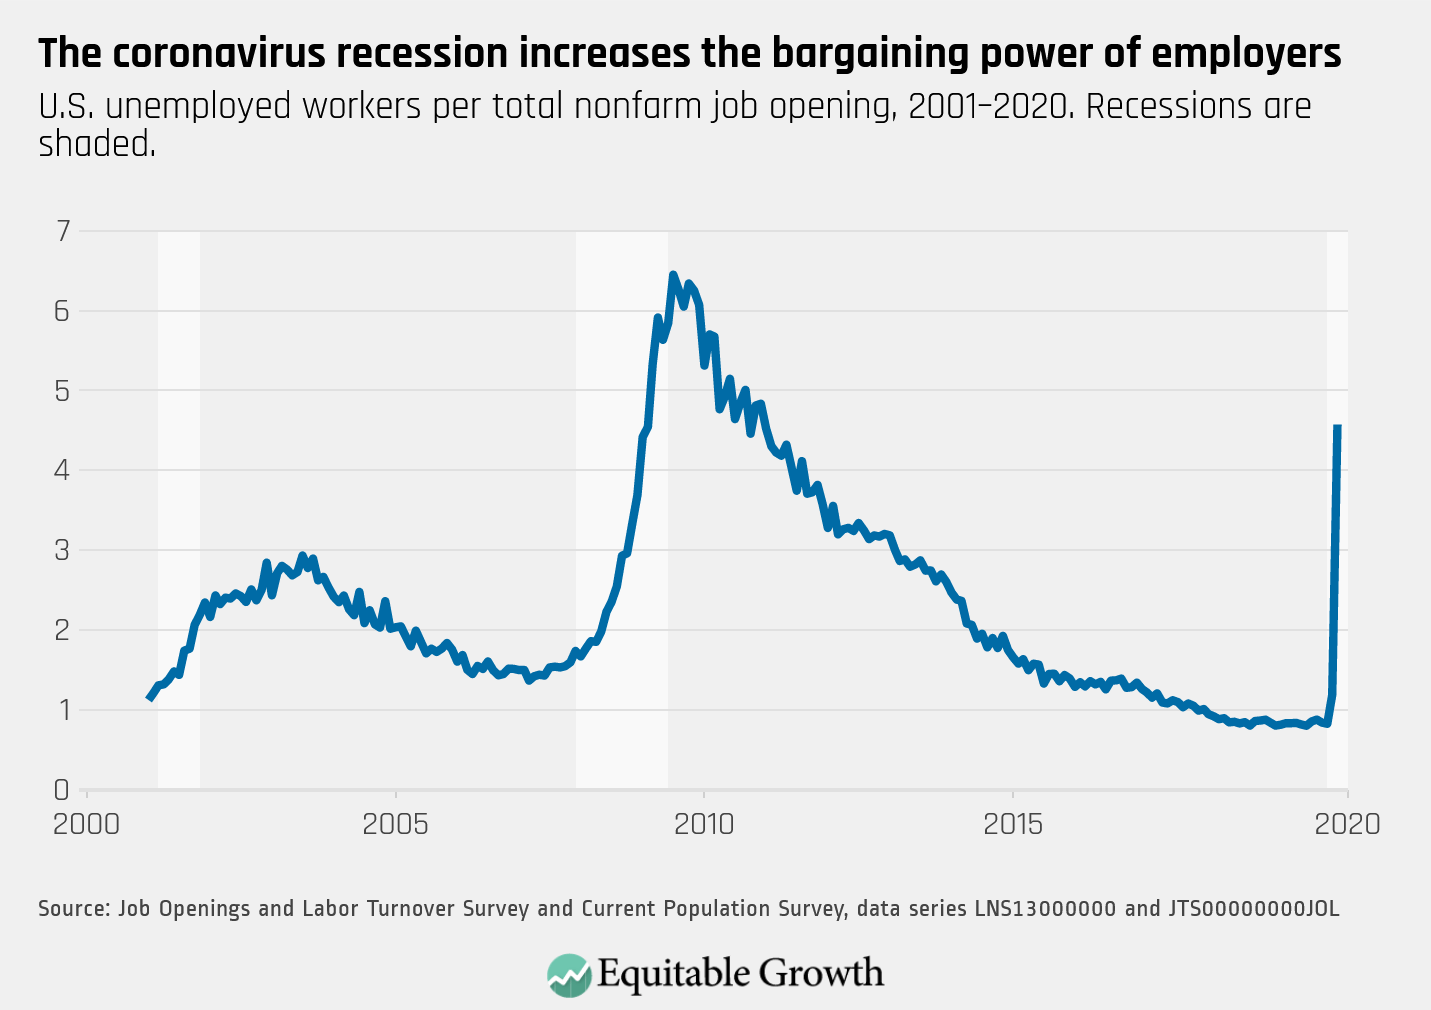
3.
There are more than four unemployed workers for every job opening, as unemployment skyrocketed in April and openings decreased.
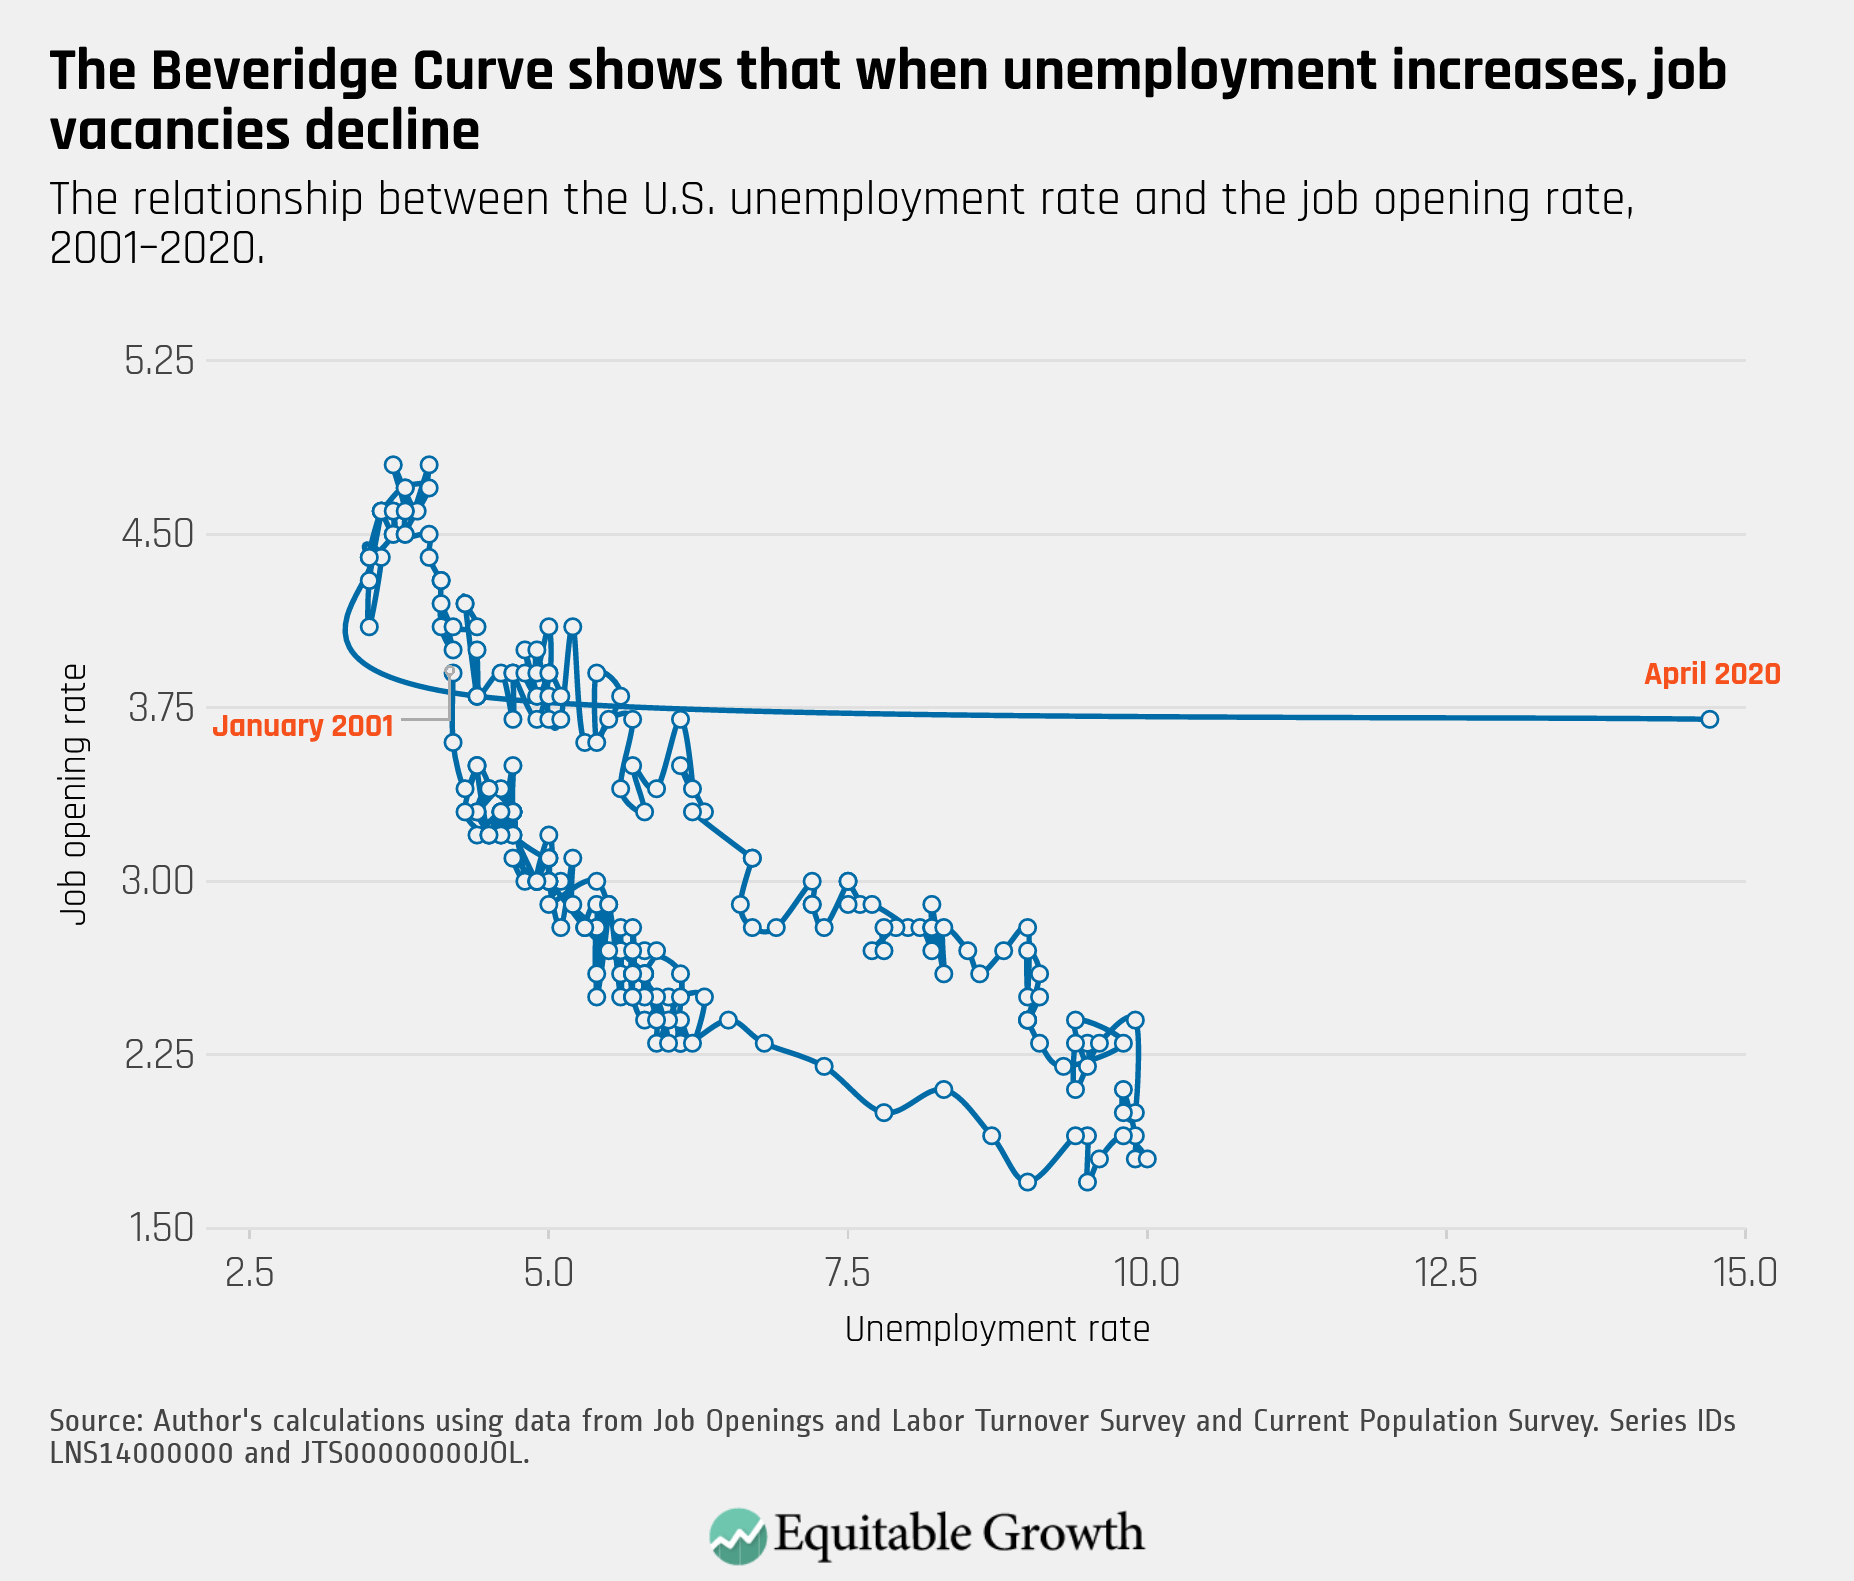
4.
The Beveridge Curve made an unprecedented rightward shift–and at a rapid pace of increase–as unemployment reached its highest level since the Great Depression.