This is a post we publish each Friday with links to articles that touch on economic inequality and growth. The first section is a round-up of what Equitable Growth published this week and the second is relevant and interesting articles we’re highlighting from elsewhere. We won’t be the first to share these articles, but we hope by taking a look back at the whole week, we can put them in context.
Equitable Growth round-up
The Voting Rights Act of 1965 is probably best known for its role in eliminating barriers to political representation and voting for Americans of color at the height of the civil rights era. But a new working paper by Abhay P. Aneja and Carlos F. Avenancio-León shows that this signature legislation also worked to improve economic circumstances of Black Americans and other Americans of color. The co-authors’ research quantifies the connection between increasing political representation and reducing poverty, finding that between 1950 and 1980, the gap in median wages between Black and White workers in the South narrowed by around 30 percentage points, and that the Voting Rights Act was responsible for approximately one-fifth of that change. Aneja and Avenancio-León explain their study and its results in an issue brief, drawing a clear connection between Black voters’ greater political power and higher wages for Black workers in subsequent years, reducing poverty in the United States. They look at the various mechanisms that could have enabled the legislation to have this effect, and discuss the 2013 Supreme Court decision to weaken the law’s enforcement, which may be reversing the wage gains seen after the law was enacted.
Homeownership in the United States for a long time helped White middle-class families build up their wealth, providing many of these families with opportunities to accumulate, over their working years, the financial cushion they need to support themselves upon retirement. Yet the Federal Reserve’s 2019 Survey of Consumer Finances suggests that this wealth-building opportunity is under threat for all U.S. households today. Austin Clemens and John Sabelhaus review the data, which show that the Great Recession of 2007–2009 and the sluggish recovery that followed it have pushed homeownership rates lower than they were for older generations at similar ages and phases in the lifecycle. Clemens and Sabelhaus look specifically at data for families with middle-aged heads of households because this group of people will be urgently in need of the financial security homeownership can provide in short order. They also examine the inequities in housing among this group along race and income lines, showing that White and wealthy families have higher rates of homeownership than their Black, Latinx, and less well-off peers. Clemens and Sabelhaus then propose several actions policymakers can take to protect these vulnerable families on the brink of retirement to ensure they are able to begin building wealth before exiting the labor force.
Equitable Growth is committed to building a network of scholars studying how inequality affects economic growth and stability. As such, every month, we highlight a group of scholars in various fields doing cutting-edge work in the social sciences. This month, Christian Edlagan, Aixa Alemán-Díaz, and Maria Monroe write about five scholars whose research looks at the diverse lived experiences of Latinx populations in the United States and how these experiences are often compared to those of Black Americans, who face similar barriers to economic and social equity.
Check out Brad DeLong’s latest Worthy Reads, in which he summarizes and analyzes recent content from Equitable Growth and around the web.
Links from around the web
Since the end of July, when emergency coronavirus aid relief provided in the Coronavirus Aid, Relief, and Economic Security, or CARES Act expired, up to 8 million Americans have slipped into poverty. Two new studies show how the aid worked to prop up many vulnerable families and how those families have fared since the money ran out—namely, that the poverty rate is now higher than it was before the onset of the pandemic, The New York Times’ Jason DeParle reports. The researchers found that the CARES Act relief kept more than 18 million people out of poverty, but that number has dropped now that it has expired. Despite what appears to be an improving job market, the studies show that poverty has continued to rise, indicating that the recovery is too sluggish to offset the negative effects of not renewing aid. Coupled with a recent uptick in Unemployment Insurance claims and rising cases of the virus across the United States, the economy is poised to falter again—and, DeParle writes, Congress is no closer to passing another, desperately needed stimulus package to support those most in need.
The connection between climate change and economic inequality is becoming more obvious with every passing day and is one of the biggest, most daunting challenges we face, writesThe Atlantic’s Vann R. Newkirk II. Rising temperatures are more likely to affect poorer regions of the world, while wealthier areas—which contribute more to climate change via higher emissions—are mostly spared the worst effects of this warming or are easily able to avoid them. Sweltering heat levels also hit lower-income workers, such as farm and field hands, factory workers, and those in construction, harder than their more economically and geographically mobile peers, expanding wealth disparities even further, killing some people and not others, and fomenting conflict within many, and even between some, countries. Rising temperatures also exacerbate racial wealth and health divides, reinforcing structural racism and discrimination, and impacts Black and Latinx communities in the United States more than White areas. In short, Newkirk writes, in the long, hot century ahead, “the heat gap will be a defining manifestation of inequality.”
In the wake of lockdowns, quarantines, and stay-at-home orders earlier this year that most affected restaurants and the service industry in the United States, many small businesses have had to change their operations and business models to stay afloat. Even as some states and cities are now scaling back their restrictions on public gatherings, many people won’t return to their pre-coronavirus habits until they feel safe going out, meaning many of these businesses will continue struggling for months to come. One lifeline for many of them has been online crowdfunding websites, writes Vox’s Rebecca Jennings. But, Jennings continues, the fact that small businesses—the backbone of many U.S. cities, both small and large—have had to use these methods is clear evidence of the lack of public safety net protections for employers and employees alike. Though the Paycheck Protection Program, for instance, was intended to help those companies in this exact situation, many small businesses were excluded from the program for various reasons, and access was further limited for entrepreneurs of color, who faced significant barriers to entry. Crowdfunding and haphazard innovative solutions to coronavirus restrictions, such as makeshift outdoor dining patios and curbside pickup, will only work for so long, Jennings concludes, especially with winter around the corner. Policymakers must act to support the restaurant industry so that no more of these vital local businesses have to shutter permanently.
People line up on the first day of early voting in Arlington, VA. to vote in the 2020 presidential election.
Overview
The civil rights movement, from its mid-20th century growth and successes to its current manifestations, has had a dual focus of eliminating political and social discrimination and bettering the economic lot of Black Americans, as well as that of other people of color in the United States. From the beginning, leaders of the movement and their political allies recognized the intrinsic connection between these goals. They understood that equality under the law meant little without addressing the rampant poverty in Black communities across the country.
Our new research quantifies that direct connection, showing that the Voting Rights Act of 1965, a signature measure of the civil rights era, narrowed the wage gap between Black and White men in the areas where it was most strictly enforced. Specifically, between 1950 and 1980, the gap between the median wages of Black and White workers in the South narrowed by approximately 30 percentage points. And our study, which builds on existing research on the economic benefits of voting rights legislation, shows that the Voting Rights Act was responsible for about one-fifth of that reduction.
This issue brief first details why the Voting Rights Act delivered greater political power to Black voters. We then show that this resulted in higher wages to Black workers and narrowed the Black-White wage gap. We examine some ways the Voting Rights Act could have had this wage effect, specifically developments in public- and private-sector employment and greater enforcement of measures barring discrimination in the workplace. We close with a brief look at how the U.S. Supreme Court decision in 2013 to dramatically weaken enforcement of voting rights may be starting to reverse the wage gains we document after the enactment of the Voting Right Act.
The Voting Rights Act
No civil right was considered more important by civil rights proponents than the right to vote, which had been systematically denied to Black people for decades, primarily in the South. Following the Civil War, the ratification of the 15th Amendment to the Constitution in 1870 enshrined voting rights for American men regardless of race. And during Reconstruction, Black Americans generally prospered economically. But beginning near the end of the 19th century, Jim Crow laws in the South gradually and systematically deprived Black Americans of the right to vote in many areas. By 1910, there was very limited Black suffrage in the South, and that remained the case for more than half a century.
The Voting Rights Act of 1965 changed that. It not only outlawed the standard practices used to deny Black Americans the right to vote, such as the poll tax and literacy tests, but also contained very tough enforcement measures. The new law gave the federal government extraordinary oversight powers to protect the voting rights of people of color in specific counties through much of the South. Any changes in electoral procedures needed to be cleared with the U.S. Department of Justice or the U.S. District Court for the District of Columbia before going into effect, and the Justice Department was authorized to appoint federal examiners to oversee the electoral process in covered jurisdictions to ensure that roadblocks were not placed in the way of Black voters.
The results were dramatic. The size of the Black electorate increased almost overnight. Within 2 years, more Black Americans had registered to vote than at any point since the ratification of the 15th Amendment.
To calculate the effect of the Voting Rights Act on wages, we were able to compare counties that were covered by the stricter Voting Rights Act provisions to those that were not. Only 41 of 100 counties in North Carolina, for example, were covered by the stricter provisions, so neighbor counties can be compared. All of Mississippi was covered, but Arkansas next door was not. In addition, subsequent amendments to the Voting Rights Act added more counties in the South and Southwest, providing additional opportunities for comparisons, not only with newly adjacent uncovered counties but also with the counties that had been covered 5 and 10 years earlier.
How the Voting Rights Act changed politics
In order for the Voting Rights Act to improve the well-being of Black Americans, it had to make government more accountable to Black voters. If improvements were a response to their greater electoral strength, then the first question was how the law affected the demographic makeup of the electorate. So, we first examined voter turnout between 1948 and 1980, and found increases in overall eligible voter turnout for all voters of anywhere from around 6 percent to 10 percent, consistent with existing research in this area.
Moreover, there also was increased White voter registration during the period, but the statute produced much larger increases in Black voter registration. Finally, our research builds on existing research by showing specifically that in jurisdictions where federal examiners monitored the voting process, political participation showed the greatest increases.
As might be expected, elected officials began responding to the increased Black vote. Using data on the behavior of members of Congress from the covered jurisdictions, we found that these elected officials increasingly supported the preferred policies of their Black constituents, specifically on issues directly related to race and civil rights. This finding is consistent with research from political science on the Voting Rights Act.
Impact of the Voting Rights Act on racial earnings inequality
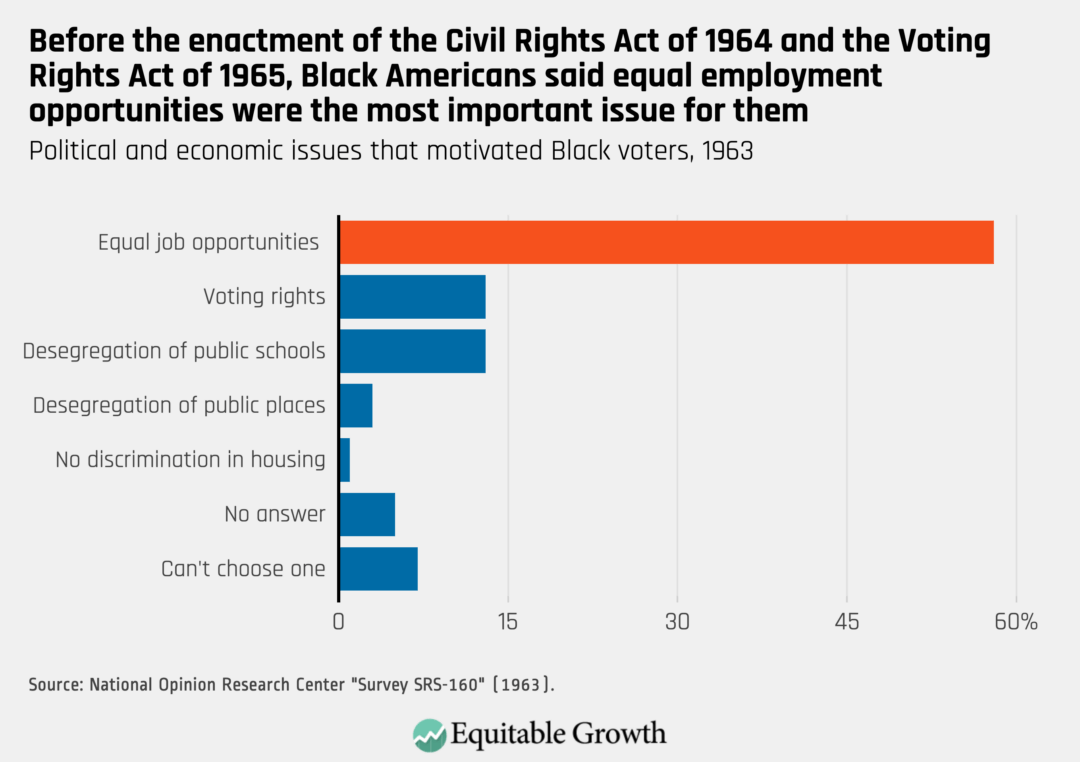
Eliminating U.S. labor market discrimination was by far the most important political issue for Black Americans before the enactment of the civil rights legislation of the 1960s. It should be no surprise, then, that once Black Americans gained greater political power, it would be directed like a laser beam toward that issue. (See Figure 1.)
Figure 1
In our new working paper, we analyzed U.S. Census Bureau data in adjacent jurisdictions, as noted above, to estimate the specific impact of the Voting Rights Act on the gap in earnings between Black and White men. The results were clear: a 5.5 percentage point increase in Black Americans’ wages between 1950 and 1980, relative to White workers with the same characteristics and within the same geographic area.
Between 1950 and 1980, the ratio of wages for Black workers to wages for White workers increased from 55 percent to just more than 80 percent. Since the main impact of the Voting Rights Act in narrowing the Black-White wage gap 5.5 percent took place in the 5 years following its enactment, between 1965 and 1970, the measure is responsible for about one-fifth of the total convergence between Black and White wages.
We also found that the narrowing of this divide was driven primarily by a substantial increase in earnings among Black workers. Yet there was no loss of employment for Black or White workers. Employers did not hire fewer workers because wages rose, perhaps due to the favorable economic conditions of the time.
If the Voting Rights Act is responsible for one-fifth of this phenomenon, what makes up the rest? Other researchers have quantified several other factors, including the migration of Black workers to the North during the period of the Great Migration, improvements in school quality for Black American schoolchildren, and the effect of President Lyndon Johnson’s Great Society programs on U.S. labor force participation, caused, in part, by the increased bargaining power the support provided to Black workers.
A third source of the increase in wages among Black workers was detailed recently by economists Ellora Derenoncourt and Claire Montialoux at the University of California, Berkeley. They find that the 1966 National Labor Relations Act reforms that broadened the federal minimum wage to cover previously exempt industries, including nursing homes, hotels, and agriculture, explains more than 20 percent of the earnings gap reduction. Of course, people of color’s political power may have complemented any of these channels by strengthening enforcement of these laws.
We examined a number of factors that could have made interpretation of our analysis challenging. We tracked Black migration from one county or state to another, the integration of labor markets across county or state borders, and workers commuting from one jurisdiction to another. Using these additional data, we were able to essentially rule out that any of these factors had a significant effect on our research.
What were the means by which the Voting Rights Act affected earnings?
Now that we know that the Voting Rights Act narrowed the Black-White wage gap, the natural question is, how? What are the channels by which this landmark measure effected economic progress for Black workers in the decade-and-a-half following its enactment? We looked at a few possible channels, including:
Increased Black employment in the public sector
Anti-discrimination and affirmative action policies implemented at all levels of government
Changes in human capital, such as improved education and health, leading to workers more capable of earning higher wages
Let’s examine each of these in turn.
Public-sector employment
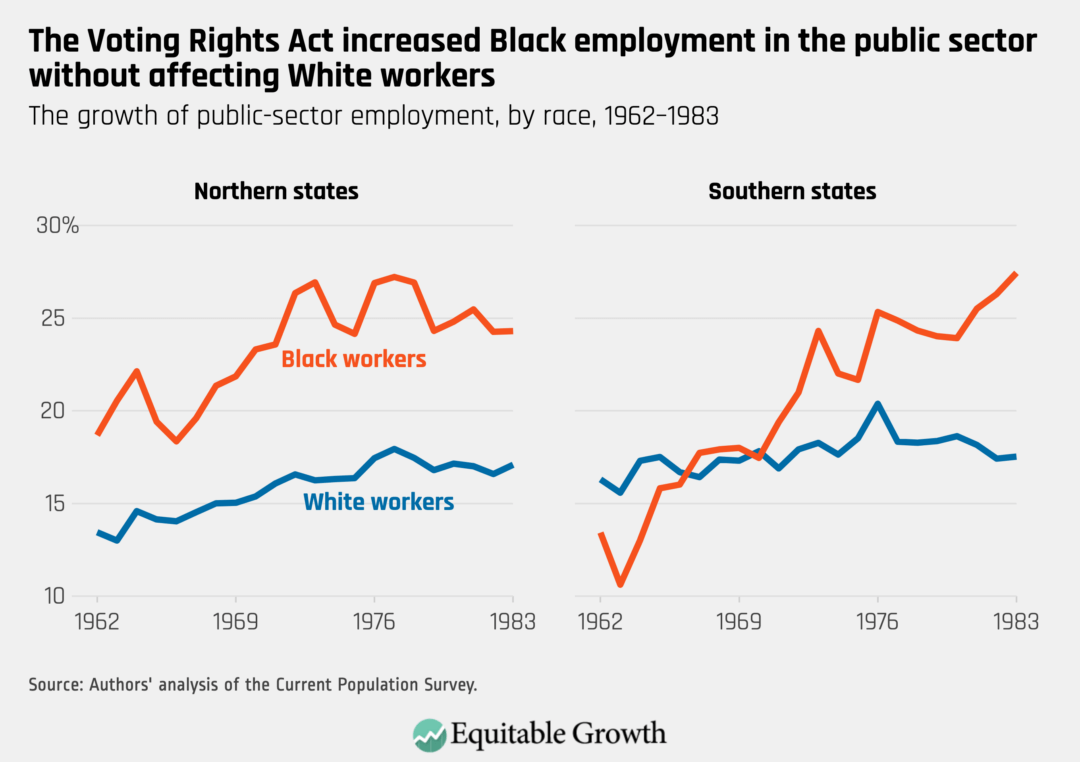
Previous research suggests that greater diversity among government workers is one effect of increased political power for people of color. We calculate that of the approximately 5 percent narrowing of the racial wage divide in Voting Rights Act jurisdictions between 1950 and 1980, at least one-tenth of that convergence was achieved as a result of greater public employment, including its spillover effect on the private sector. (See Figure 2.)
Figure 2
Public employment provided a premium, especially to Black workers, over private employment. Wages in the public sector were higher in general, and there was greater discrimination in terms of hiring, pay, and position in the private sector. Black workers had greater opportunities in the public sector than in private employment to move to higher-paying, white-collar positions.
In addition, this increase was made easier by the concurrent growth of government employment occurring in much of the country. That overall growth meant that the growth of Black employment, which occurred at a higher rate in the jurisdictions covered by the Voting Rights Act, could be achieved without displacing current White workers. We also find, though, that Black workers’ improved circumstances in the public sector had a spillover effect, contributing to the narrowing of the racial wage gap in the private sector. Faced with the higher wages paid by government agencies, private employers likely had to offer more competitive pay to attract workers.
Direct government actions
During the 1960s and beyond, a number of federal, state, and local measures were adopted to improve the economic well-being of Black Americans and other people of color. Two of the most important at the federal level were Title VII of the Civil Rights Act of 1964, which prohibited employment discrimination based on “race, color, religion, sex, or national origin,” and a series of executive actions through several administrations requiring affirmative action to prevent employment discrimination or specifically encourage hiring workers of color. There also was a nationwide increase in the minimum wage. In addition, some local governments took their own actions to encourage hiring and contracting people of color.
Government reporting requirements under Title VII applied only to firms above a set number of employees. Localities thus varied in the fraction of workers employed in establishments subject to these oversight requirements. We found that the Voting Rights Act’s effect on relative earnings was (differentially) more in places where a greater fraction of the private-sector workforce was likely to be subject to these reporting requirements. We believe this may suggest that another mechanism through which political power mattered was through improved Title VII enforcement.
Changes in human capital
Finally, there is no question that expanding the franchise in the United States led to increases in spending on education and health, adding to workers’ human capital. But it turns out these improvements in human capital did not play a significant role in the wage-gap narrowing that we are discussing. Among other reasons, the impact of increased spending was felt later than the narrowing of the wage gap we are discussing.
Unlike the other channels above, the data here do not help us draw a line from the Voting Rights Act to changes in human capital to the narrowing of the Black-White earnings gap. Rather, the clear improvements in school quality for Black children fostered by the Voting Rights Act seem to have occurred in tandem with the improvements in adult outcomes that we document in our paper.
Conclusion
Unfortunately, stringent federal enforcement of voting rights for people of color in the South and other areas covered by the Voting Rights Act is a historical relic. In 2013, the U.S. Supreme Court, in Shelby County v. Holder, invalidated the provision of the Voting Rights Act that authorized the Justice Department to send enforcers to those counties that had a strong history of discrimination against Black voters and other voters of color. While Chief Justice John Roberts claimed that voting equality had been achieved, Justice Ruth Bader Ginsberg argued that if voting equality existed in 2013, it may have been precisely because of the “prophylactic measures to prevent purposeful race discrimination” taken under the Voting Rights Act.
The impact of Shelby County v. Holder on the voting rights of Americans of color is about as controversial a political issue as there is right now in the South and Southwest. And in separate research, we find that the removal of these protections has had a negative economic impact on Black workers, though modest so far, yet consistent with the economic improvements in the 20th century that were attributable to Voting Rights Act enforcement. That impact has been felt largely due to reversals in the same channel where improvements took place half a century ago: public-sector employment, with spillovers into the private sector.
The Voting Rights Act, now hobbled, turned 55 in August 2020. The economic effects of Shelby County v. Holder, which are undoubtedly related to the successful efforts by some governors and state legislatures to reduce voter registration and turnout among people of color, suggest that a revitalized Voting Rights Act, including its stringent enforcement measures, may still be vital to establishing full economic equality for Black voters and other voters of color. As the nation continues to struggle with how to achieve economic justice, voting rights, as in the 1960s, are still front and center.
—Abhay P. Aneja is an assistant professor of law at the University of California, Berkeley,and Carlos Fernando Avenancio-León is an assistant professor of finance at the Kelley School of Business, Indiana University Bloomington.
Equitable Growth is committed to building a community of scholars working to understand whether and how inequality affects broadly shared growth and stability. To that end, we have created the monthly series, “Expert Focus.” This series highlights scholars in the Equitable Growth network and beyond who are at the frontier of social science research. We encourage you to learn more about both the researchers featured below and our broader network of experts.
October 15 marks the end of Latinx Heritage Month. In this installment, we explore the work of five scholars whose research helps us understand the economic aspects of the diverse Latinx experience, including in the workplace, the broader U.S. labor market, and barriers to equitable access to opportunities in the U.S. economy and society. These experiences are often compared to the experiences of Black people in the United States, who tend to face similar barriers to economic equity—comparisons examined by several of the academics whose research we highlight here.
Carlos Fernando Avenancio-León
Indiana University Bloomington
Carlos Fernando Avenancio-León is an assistant professor of finance in the Kelley School of Business and an affiliate of the Center for Research on Race and Ethnicity in Society at Indiana University Bloomington. His work focuses on equitable finance, or the role of finance in economic redistribution, and its effects on disadvantaged communities and inequality. A 2018 Equitable Growth grantee, he and colleague Troup Howard from the University of California, Berkeley published a recent working paper showing that property taxes place an inequitable burden on Latinx and Black homeowners. Their work on systemic racism in taxes highlights the barriers that Latinx and Black homeowners face even after overcoming the U.S. homeownership divide. In other research, featured in this Econimate video, he and his colleague Abhay Aneja, also an Equitable Growth grantee, document how political empowerment through protecting the right to vote had a positive impact on U.S. labor market inequality for Black workers in the South following the passage of the Voting Rights Act of 1965.
Eduardo Bonilla-Silva
Duke University
Eduardo Bonilla-Silva, the James B. Duke distinguished professor of sociology at Duke University, is a longstanding influential voice on understanding the personal, collective, and structural dimensions of racism. His work, from his first publication, titled “Rethinking Racism: Toward a Structural Interpretation” in the American Sociological Review in 1997, to his most recent book, Racism Without Racists: Color-Blind Racism and the Persistence of Racial Inequality in the United States, is critically relevant in the context of the coronavirus pandemic and recession, and the social unrest against systemic racism and police brutality. Furthermore, he recently engaged in conversations on how economics can better adopt a racial equity lens by drawing from outside the discipline. At this moment, he is writing on how the actions of White people are central to the maintenance of systemic racism, lecturing across the nation on the subject “What Makes Systemic Racism Systemic?” and finishing the sixth edition of Racism Without Racists.
Adriana Kugler
Georgetown University
Adriana Kugler is a full professor at the McCourt School of Public Policy at Georgetown University and was the chief economist at the U.S. Department of Labor during the Obama administration. She currently serves on the Science, Technology and Economic Policy committee of the National Academies of Science and Engineering and is the Chair of the Business and Economics Statistics Section of the American Statistical Association. A 2016 Equitable Growth grantee, her current research is on the impact of Unemployment Insurance on the labor market during recessions. During the coronavirus pandemic and subsequent recession, the effect of Unemployment Insurance benefits, partly as a lesson learned from the Great Recession, has remained a vital topic for economic growth and the well-being of families and individuals who may have lost their jobs. Kugler and her co-authors Ammar Farooq and Umberto Muratori, the latter of whom is a former dissertation scholar at Equitable Growth, released a recent working paper showing the benefits of UI extensions to improve the quality of job matches for women, non-White workers, and less-educated workers—an understudied but important subject. Beyond Unemployment Insurance, Kugler’s research looks at labor markets and policy evaluation in developed and developing countries, as well as the role of public policies such as payroll taxes, employment protections, occupational licensing, and immigration.
Juliana Londoño-Vélez
University of California, Los Angeles
Juliana Londoño-Vélez is an assistant professor of economics at the University of California, Los Angeles, a faculty research fellow at the National Bureau of Economic Research, and a 2018 Equitable Growth grantee. Londoño-Vélez’s research focuses on inequality and redistributive tax and transfer policies, including research on developing countries such as Colombia. In her Equitable Growth-funded research, Londoño-Vélez investigates the feasibility of wealth taxation in developing countries.
Marie Mora
University of Missouri-St. Louis
Marie Mora is the provost & executive vice chancellor for academic affairs and professor of economics at the University of Missouri-St. Louis. As a labor economist for 25 years, Mora is a leading voice on education and employment outcomes within/among the Latinx population in the United States. As briefly presented by the Institute for New Economic Thinking, poverty and migration can drive lower outcomes in education and labor opportunities among Latinx groups, including U.S. born individuals. She has also given talks on the lack of access to capital Latinx groups face, which is increasingly evident in today’s recession. In August 2020, Mora obtained the national Presidential Award from the White House Office of Science & Technology Policy and administered by the National Science Foundation for her excellence in mentoring. She continues to play a major role in supporting graduate students and faculty from diverse backgrounds—as evidenced by her leadership of the American Economic Association Mentoring program, as well as long-standing commitment to the Diversity Initiative for Tenure in Economics Program and the NSF ADVANCE Program.
Equitable Growth is building a network of experts across disciplines and at various stages in their career who can exchange ideas and ensure that research on inequality and broadly shared growth is relevant, accessible, and informative to both the policymaking process and future research agendas. Explore the ways you can connect with our network or take advantage of the support we offer here.
Housing is often an important source of wealth accumulation for low- and middle-income families.
Overview
Homeownership in the United States has long functioned as a wealth equalizer, allowing middle-class families to build wealth while they pay for their housing costs. Because houses have generally appreciated at rates that exceed inflation, housing is often an important source of wealth accumulation for low- and middle-income families, which are generally not invested in stocks or other financial investments. In fact, for the middle class (defined here as the middle quintile by income), home equity represents an average of 42 percent of all wealth held by the average family.
The ability of middle-class families to build equity through homeownership historically allowed these families to somewhat keep pace with the growing value of financial investments held by those at the top of the income distribution. Middle-class families generally enter homeownership following key lifecycle events such as getting married and having children. And as they pay off their mortgages and their houses appreciate in value, they steadily accumulate the housing wealth they will need to help support themselves in retirement.
But this pillar of middle-class wealth creation is under threat. The Great Recession of 2007–2009 and the long, tepid recovery that followed it interrupted the standard lifecycle progression of rising homeownership by age for younger generations. The result is that current rates of homeownership are now lower than they were for older generations at comparable ages.
In addition, total housing wealth in the United States continues to be depressed relative to the period prior to the Great Recession. Last week’s release of the Federal Reserve’s 2019 Survey of Consumer Finances shows that inflation-adjusted housing wealth declined 13 percent between 2007 and 2019.
In this issue brief, we focus on families with middle-aged heads of households. These families have suffered a persistent decline in homeownership just as they are preparing for retirement, when owning a house provides an important source of financial security. These families are at risk, and policymakers should act to make homeownership more accessible to them and all Americans. Restructuring mortgages to take account of macroeconomic shocks and changing tax incentives for homeownership are two ways we can tackle the problem.
Why focus on families with middle-aged heads of households?
Economic narratives often focus on declining homeownership for the youngest generations entering the workforce. This is because buying a house is seen as a foundational step toward financial security. The drop in homeownership at young ages is concerning, and economic forces such as reduced earnings prospects and higher student debt burdens may be limiting homeownership for millennials.
Yet some of the long-run decline in homeownership among the youngest families is the result of delayed entry into homeownership because of demographic factors such as declining marriage rates and fewer children. Indeed, 2019 SCF data show a small uptick in homeownership among young families between 2016 and 2019—defined here to include those younger than 45—that would be consistent with delaying rather than completely foregoing homeownership. Still, homeownership rates for the young remain below 2007 levels.
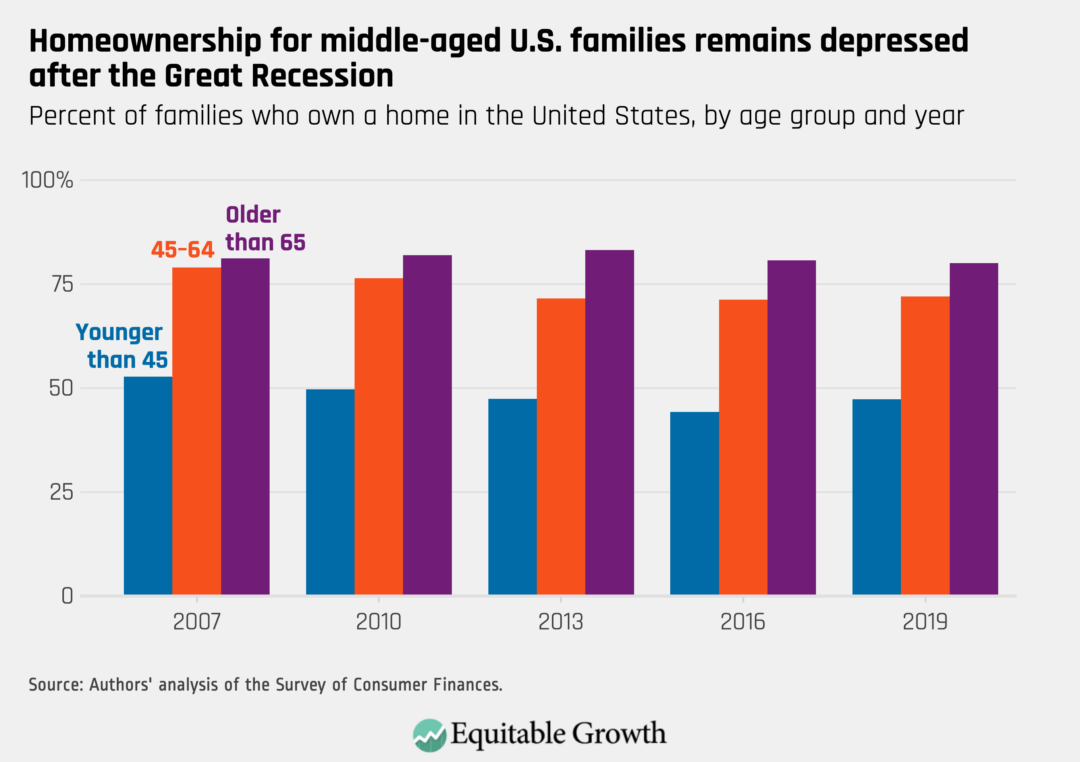
The slight improvement in homeownership for the young between 2016 and 2019 does not extend to the middle-age group. The decline in homeownership among middle-aged (ages 45 to 64) families since the Great Recession has been relatively larger and more persistent. In 2007, 79 percent of U.S. families in the middle-age group owned their homes, and in 2019, that fraction was only 72 percent. (See Figure 1.)
Figure 1
The consequences of this dramatic shift in homeownership for middle-aged families are serious. Just as these families are nearing retirement and should be actively preparing for it, many have lost their most important financial asset or find themselves unable to invest in a house for the first time. The upshot: Typical lifecycle wealth accumulation patterns are no longer working in their favor.
The overall decline in homeownership among the middle-age group is 7 percentage points since prior to the Great Recession, meaning nearly 1 in 10 families who would have owned their home going into retirement prior to the Great Recession are now likely to enter retirement as renters. These families will now have to worry about rental-housing costs in addition to the other costs of supporting themselves when they retire and their income declines—and without any home equity to fall back on.
Inequities in middle-aged homeownership
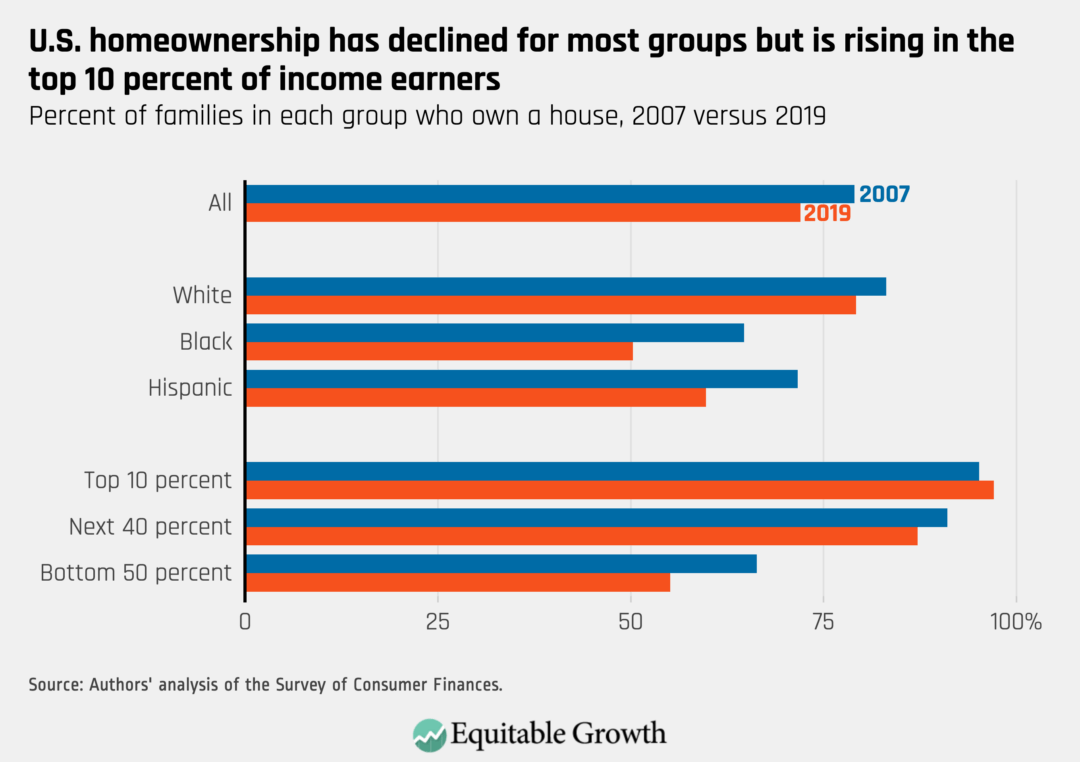
The Fed’s 2019 SCF data release also makes it possible to better understand which families within the middle-age group have experienced declining homeownership since the Great Recession. Unsurprisingly, the decline is greatest for Black and Hispanic families and for those in lower income brackets. In contrast, the top 10 percent of middle-aged families, ranked by income, saw an increase in homeownership between 2007 and 2019. (See Figure 2.)
Figure 2
Homeownership among Black middle-aged families declined a staggering 14 percentage points between 2007 and 2019, while Hispanic middle-aged families experienced an alarming 12 percentage point drop. There was a decline among White non-Hispanic middle-aged families as well, but it was a much more modest 4 percentage point decline and relative to a much larger 2007 base. In 2019, nearly 80 percent of middle-aged White non-Hispanic families owned their homes, while the corresponding values for Black and Hispanic middle-aged families were only 50 percent and 60 percent, respectively.
Differences by income also paint a picture of stark and unequal homeownership rates. The bottom 50 percent of families by income saw an 11 percentage point decline in homeownership between 2007 and 2019, while those in the next 40 percent by income saw a more modest 4 percentage point drop. The top 10 percent of families by income saw an increase in homeownership of 2 percentage points between 2007 and 2019.
On net, the homeownership gap between the top 10 percent and bottom 50 percent of families by income jumped from 29 percentage points in 2007 to 42 percentage points in 2019. Fully 97 percent of middle-aged families in the top 10 percent by income owned their home in 2019, while only 55 percent of middle-aged families in the bottom half of the income distribution were homeowners.
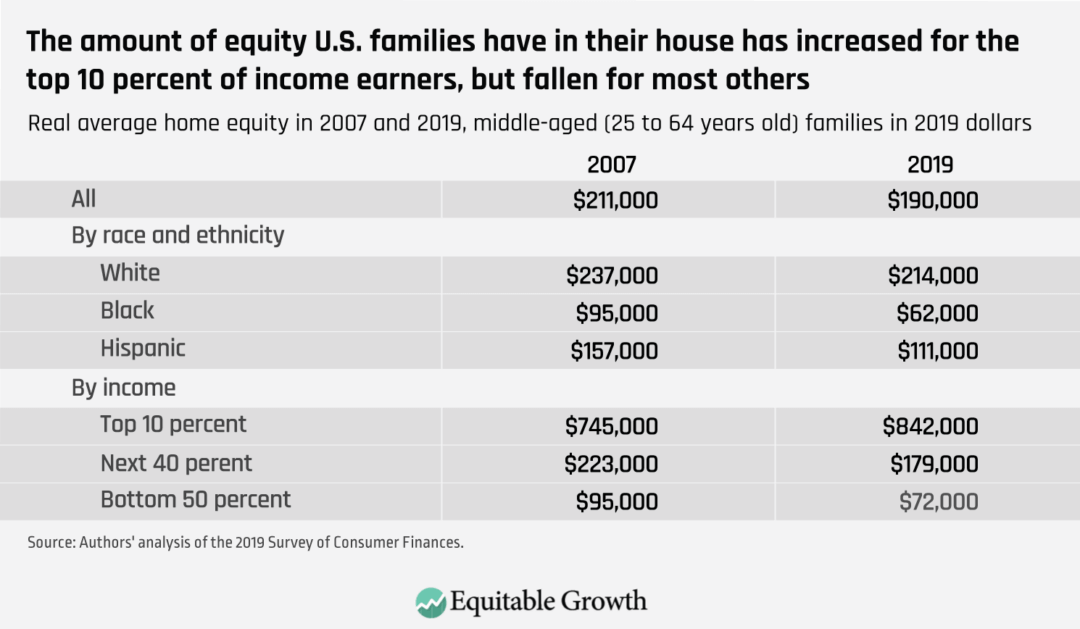
The widening homeownership gap understates the severity of the problem. This is because the amount of equity that families have in their homes also declined. Overall, home equity is down 11 percent, and this decline is inequitably distributed, just as the decline in homeownership is. White families experienced declines in their home equity of about 10 percent, while Black families suffered a staggering 35 percent drop and Hispanic families a 29 percent decline, compared to before the housing crisis in 2007.
As with homeownership, the only place on the income ladder where families are building up their home equity is in the top 10 percent of families by income, where equity is up 13 percent. In the bottom 50 percent of families by income, equity is down 24 percent. (See Table 1.)
Table 1
These drops mean that vulnerable families are less able to take equity out of their homes as a guard against hard times. Given the parlous state of retirement savings in the United States among low- and middle-income families, declining home equity is another kick in the teeth for many families.
Policy prescriptions
These dire trends in homeownership for middle-aged families are both stark and foreboding. Accumulating wealth through homeownership does not happen overnight. Housing appreciation and mortgage repayment is a slow and steady process, and there are generally ups and downs in the housing market along the way. As we contemplate the prospects for changes in U.S. homeownership policy, it is important to delve into the systematic problems that bring us to this point and address those problems directly.
Historically, the focus of U.S. policy toward homeownership allowed tax deductions for mortgage interest. The benefits of those policies are very skewed toward higher-income families, and it’s not clear they even really impact homeownership rates more broadly.
Despite recent legislative changes in the deduction for mortgage interest, the tax benefit of mortgage interest deductibility still cost U.S taxpayers $36.9 billion in Fiscal Year 2020 ending September 30, 2020. That number is just $10 billion less than what the administration requested to fund all of the U.S. Department of Housing and Urban Development for fiscal year 2021.
How might government resources be better-allocated to address inequities in homeownership? One possibility is to directly expand the supply of affordable housing and assist those currently shut out from access to homeownership so they can start investing their rental payments in their own wealth accumulation. Such a policy might be accompanied by redirecting other forms of housing assistance into owning homes rather than renting them. One way could be through repurposing Department of Housing and Urban Development Section 8 vouchers, which provide rent support to low-income households.
Taking an even broader perspective, however, it may be time to recognize that the mortgages predominantly used in U.S. housing finance—and explicitly promoted by the federal government—place an undue amount of risk on families who own their homes. The question is not whether lower-income and disadvantaged families have the resources during normal times to pay monthly housing costs—most of those families do pay those costs, just in the form of rent. The question is what happens to their ability to pay for housing when they experience a large macroeconomic shock.
It is well-known that macroeconomic shocks such as the Great Recession of 2007–2009 and the current coronavirus recession cause disproportionate job and income losses among lower-income and non-White families. The higher income volatility these families face makes it more difficult for them to qualify for a mortgage, especially under the tighter standards in place since the Great Recession. And even if a family manages to enter homeownership prior to the next macroeconomic shock, they are more likely to fall behind on payments and lose their home when the next shock occurs.
This reinforcing dynamic of higher vulnerability to macroeconomic shocks leading to lower homeownership and wealth accumulation should be the starting point for new policies to address rising inequities in homeownership among middle-aged families. The existing U.S. regulatory environment focuses on whether a family can be expected to have the steady income stream needed to keep up with mortgage payments should another macroeconomic shock occur. But that approach is backwards.
Instead, policymakers should develop new approaches to managing employment and income risk so that prospective homeowners among families who currently face barriers to homeownership can safely buy homes. Policymakers should enable the most vulnerable to become homeowners rather than simply accepting unequal employment and income risk and using that to justify stringent mortgage requirements.
Recognizing that macroeconomic shocks are more likely to harm families financially—particularly those historically excluded from homeownership—should be the basis for new policies that directly address the dynamic of steady employment and wealth accumulation. Policies can and should tie mortgage payment obligations to macroeconomic shocks, so that banks and prospective homeowners can enter mortgage contracts with confidence, knowing that the terms of those contracts are explicitly tied to economic realities.
The CARES Act passed in March 2020 provided the option of forebearance to homeowners experiencing pandemic-related economic hardship, but many families are still needlessly delinquent. This underscores the need to automatically connect government policy to macroeconomic reality, and homeowner relief is an important addition to the list of automatic stabilizers that should be in place to help prevent economic shocks from becoming worse.
But even more important is implementing policy changes focused on the group of middle-aged, would-be homeowners—the additional 7 percent of middle-aged families who would have owned homes in 2007 but are renting in 2019. Tying effective homeowner relief policies to macroeconomic reality means that potential buyers and lenders can enter into mortgage contracts with confidence, and policymakers can focus on raising rates of homeownership without creating unmanageable risk.
Failure to improve homeownership policy means accepting that many middle-aged families will continue to be shut out of the housing market as they draw closer and closer to retirement. Unless policymakers act soon, the U.S. economy can expect many more struggling retirees in the years and decades ahead.
1. I was going to note this a while ago, but it vanished into THE PILE, and I have only now managed to dig it out. Read Heather Boushey and Somin Park, “The coronavirus recession and economic inequality: A roadmap to recovery and long-term structural change,” in which they write: “The coronavirus pandemic presents a new and unprecedented challenge to the United States. First and foremost, it is a public health crisis that makes it impossible for our society and our economy to function as usual due to the necessary social distancing required for the health of us all. Because the federal government neither acted early enough to contain the deadly coronavirus nor swiftly enough to forestall mass layoffs, our nation is now facing a health crisis and economic recession simultaneously. What’s more, the underlying problems of U.S. economic inequality today will only prolong and deepen this coronavirus recession … Only a decade has passed since the end of the previous global financial crisis … Decades of failed economic policies, based on ideology instead of evidence, and a blind adherence to the idea that markets can solve every problem, have made our economy and our society more vulnerable…. Broad policy principles to help guide policymakers … [are to] recognize that markets cannot perform the work of government. Address fragilities in our markets themselves. Keep income flowing to all the unemployed workers and small businesses now and in future crises. Ensure those who are still employed can stay employed. Produce headline economic statistics that represent the well-being of all Americans …To have any chance of emerging on a stronger footing as a nation with less economic inequality and more sustainable economic growth, policymakers need to enact a robust set of protections that will ensure high-end inequality is contained, build counterweights to concentrated power, and provide economic security for all now and going forward.”
2. The de-unionization of the United States has had an enormous number of bad consequences that we are still digging through. Here is one more, courtesy of Alexander Hertel-Fernandez and Alix Gould-Werth. Read “Labor organizations and Unemployment Insurance: A virtuous circle supporting U.S. workers’ voices and reducing disparities,” in which they write: “We identify descriptive evidence that: Labor organizations facilitate the use of unemployment benefits and, in the process, help close troubling racial and educational gaps in access to Unemployment Insurance. Greater access to Unemployment Insurance amid the ongoing coronavirus recession leads workers to feel more comfortable engaging in workplace collective action to demand better safety and health standards. Together, labor organizations and Unemployment Insurance form a “virtuous circle,” in which greater access supports workplace collective action, including forming labor unions, which, in turn, support greater access to unemployment benefits. These findings suggest[:]… U.S. labor law and Unemployment Insurance policies should complement one another. Federal and state governments should support unions and worker organizations in connecting workers with the Unemployment Insurance system … A European model, in which unions or worker organizations directly administer unemployment benefits on behalf of the government … should [be] consider[ed] … given the strong level of public support for such a model.”
Worthy reads not from Equitable Growth:
1. I’m starting a DeLongToday weekly half-hour video series. On Wednesday October 7, I did the U.S. economic outlook. It is not good: Watch me at “DeLongToday.” The next broadcast begins at 10:00 a.m. EDT on Wednesday, October 14, and stay for a 30 minute “BRADCHAT” Q&A.
2. Kleptocracy comes to the United States, big time, naked, and proud. Read Ben Thompson, “The TikTok Deal, The Wrong Danger, TikTok Takeaways,” in which he writes: “I don’t put a whole lot of stock in Oracle’s overview: First, there was no indication that Oracle has any sort of legal responsibility for the TikTok algorithm. Apparently they will check it because they promise to? Second, I don’t have much faith that Oracle has the capabilities to truly check the algorithm, both because it is machine learning derived (and thus constantly evolving, even as it is individual tuned to subscribers), and also because all of the documentation is in Chinese. Third, the fact that ByteDance can deliver a code dump to Oracle has precious little to do with whatever it is that TikTok is actually doing in real time, both in terms of censorship and propaganda. Indeed, this entire bit seems so impractical to me that it is hard to interpret it as anything other than a sop to people like me who actually think this is a real issue. In short, this deal is the worst possible outcome: First, there is at best a marginal gain in U.S. data security, which probably wasn’t a concern in the first place. Second, there are only fig leaf improvements to the question of the recommendation algorithm, which will have zero impact on very real concerns around the Chinese Communist Party’s ability to censor and push propaganda to U.S. consumers. Third, the very concept of the rule of law is in shambles, as the only real change from the original Microsoft deal is to ensure that ByteDance keeps the company while Trump donors get a cloud deal. This last point can’t be made enough: this deal is significantly worse than the original Microsoft deal that Trump squashed, but unfortunately for Satya Nadella, he wasn’t a big Trump donor. I hate to be cynical, but it’s honestly hard to see what else mattered.”
This is a post we publish each Friday with links to articles that touch on economic inequality and growth. The first section is a round-up of what Equitable Growth published this week and the second is relevant and interesting articles we’re highlighting from elsewhere. We won’t be the first to share these articles, but we hope by taking a look back at the whole week, we can put them in context.
Equitable Growth round-up
The Federal Reserve last week released its 2019 Survey of Consumer Finances, a triennial dataset on U.S. households’ financial situation. Austin Clemens analyzes the data and finds that over the more than 10 years of economic growth since the previous economic downturn, U.S. households barely recovered their prerecession levels of nonhousing wealth, and many are less likely now to own a home that could be leveraged as a financial asset. Clemens disaggregates the data by race, income, and educational level to show that Whiter, wealthier, and more educated households were much more able to recover their wealth than Black, Hispanic, lower-income, and less educated households. In fact, he writes, White households, on average, had 15 percent more wealth in 2019 than they did in 2007, while Black households had 14 percent less wealth and Hispanic households had 28 percent less wealth in 2019 than in 2007. This means that as the U.S. economy entered the coronavirus recession earlier this year, most families were in a worse position than they were at the start of the Great Recession to weather the economic storm. Clemens urges policymakers to act, and quickly, to avoid repeating the mistakes that led the last recovery to be sluggish and deepen existing inequalities.
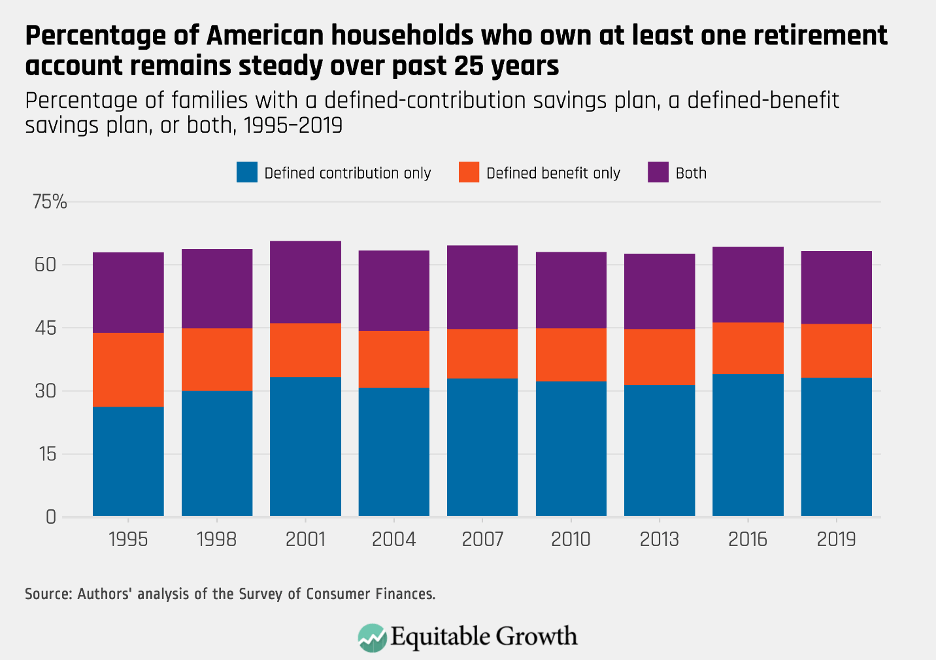
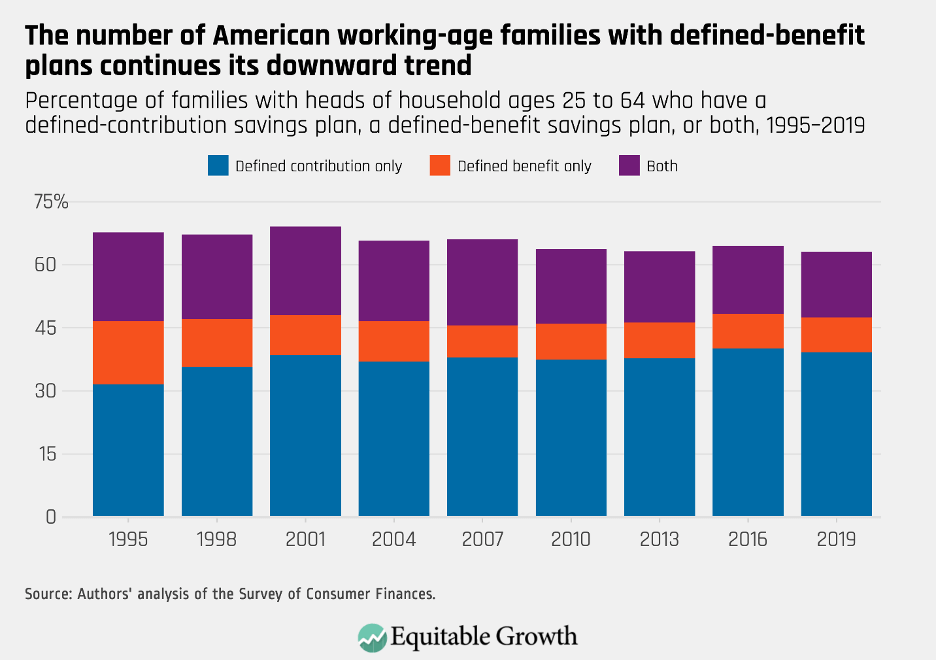
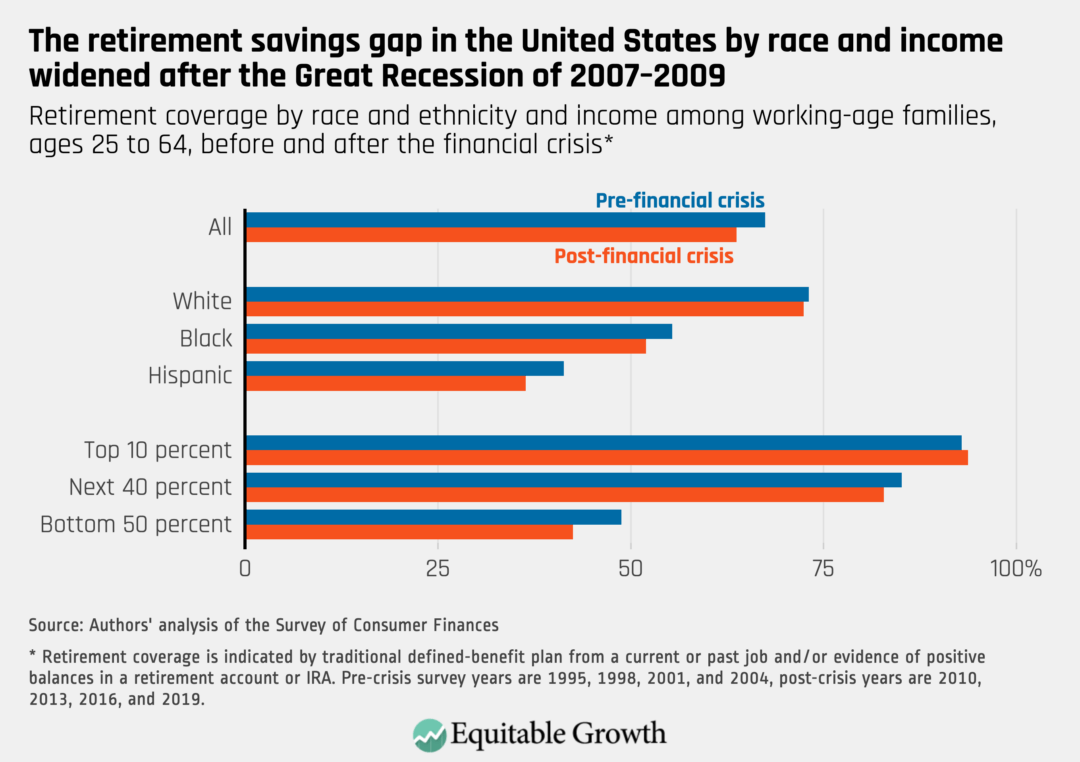
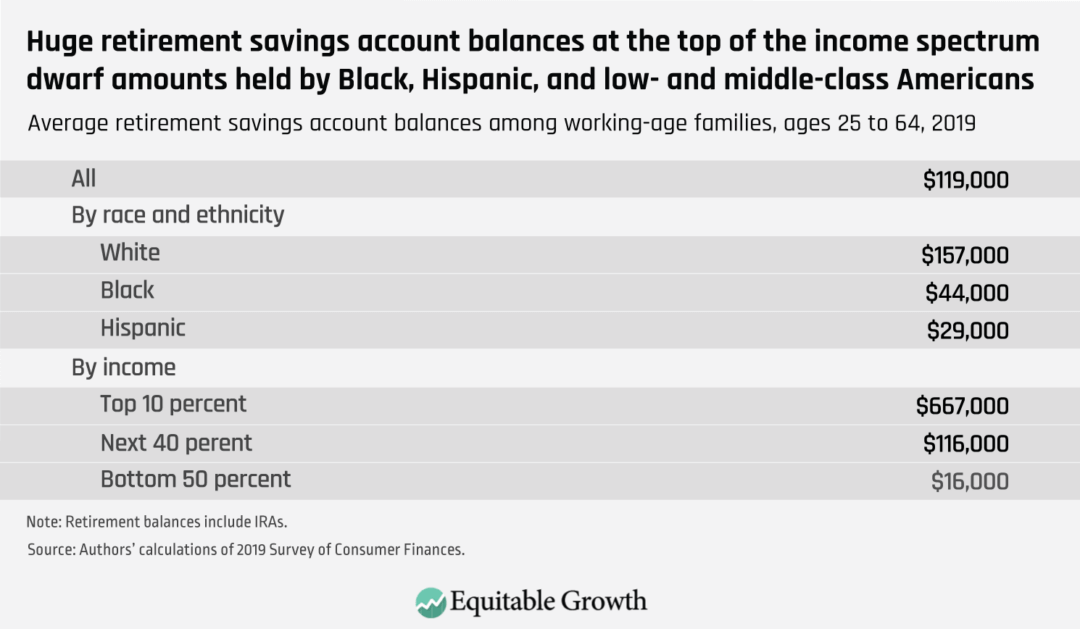
One way of building wealth in the United States—outside of homeownership—is through savings for retirement. David Mitchell and John Sabelhaus review the 2019 Survey of Consumer Finances to specifically determine trends in retirement savings since the Great Recession of 2007–2009. They find that many U.S. households don’t have retirement savings, and, looking at a survey from May 2020, see that many of those who do have drawn on it this year to help them remain afloat during the coronavirus recession. After breaking down the data further by race and income, Mitchell and Sabelhaus reveal that almost two-thirds of Hispanic households and half of Black households don’t own a retirement savings account, compared to one-fourth of White families and fewer than one-tenth of high-income households. In fact, those families in the top 10 percent of the income spectrum have more in retirement savings than the bottom 90 percent combined. Mitchell and Sabelhaus offer several policy solutions to close the racial and economic divides in retirement savings coverage, including several ideas that have already been proposed by some policymakers.
The coronavirus recession drives home anew the importance and benefits of a strong Unemployment Insurance system across the United States to protect and support workers during economic crises. Alexander Hertel-Fernandez and Alix Gould-Werth explore the links between labor organizations and Unemployment Insurance in propping up workers’ voices and reducing disparities in applying to and receiving unemployment benefits. They find that labor organizations make it easier for workers to use unemployment benefits, narrowing racial and educational divides in UI applications and receipt. Hertel-Fernandez and Gould-Werth also show that workers who had better access to the UI system during this recession felt more comfortable engaging in workplace collective action, such as strikes for better working conditions or pay. The co-authors close with three important implications for public policy of this so-called virtuous cycle, in which greater access to unemployment benefits “supports workplace collective action, including forming labor unions, which, in turn, support greater access to unemployment benefits.”
Hertel-Fernandez and Gould-Werth also participated in the latest installment of Equitable Growth’s In Conversation series, in which they further discuss a wide range of topics related to Unemployment Insurance. They touch upon themes such as the current weaknesses of the UI system in the United States and five specific policy reforms to strengthen it, fiscal constriction’s role in hampering UI programs and access to unemployment benefits, the role of academics (and academics’ understanding of the lived experience of unemployed workers) in designing a better way of delivering Unemployment Insurance to those in need, and more.
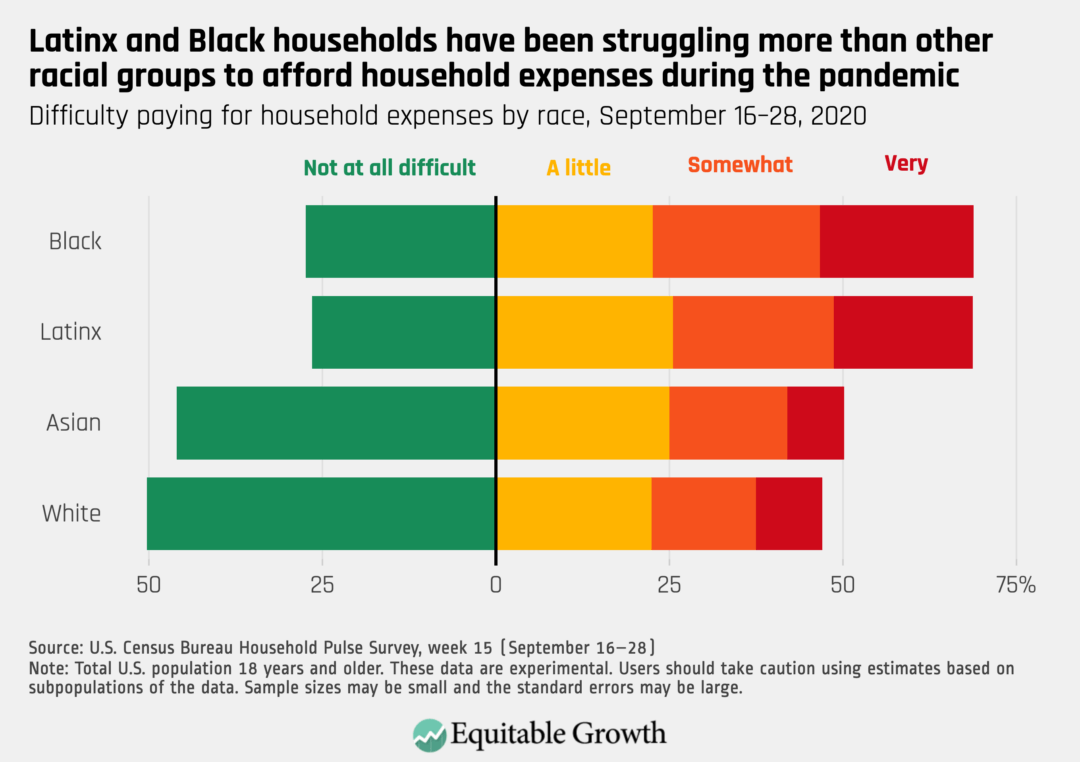
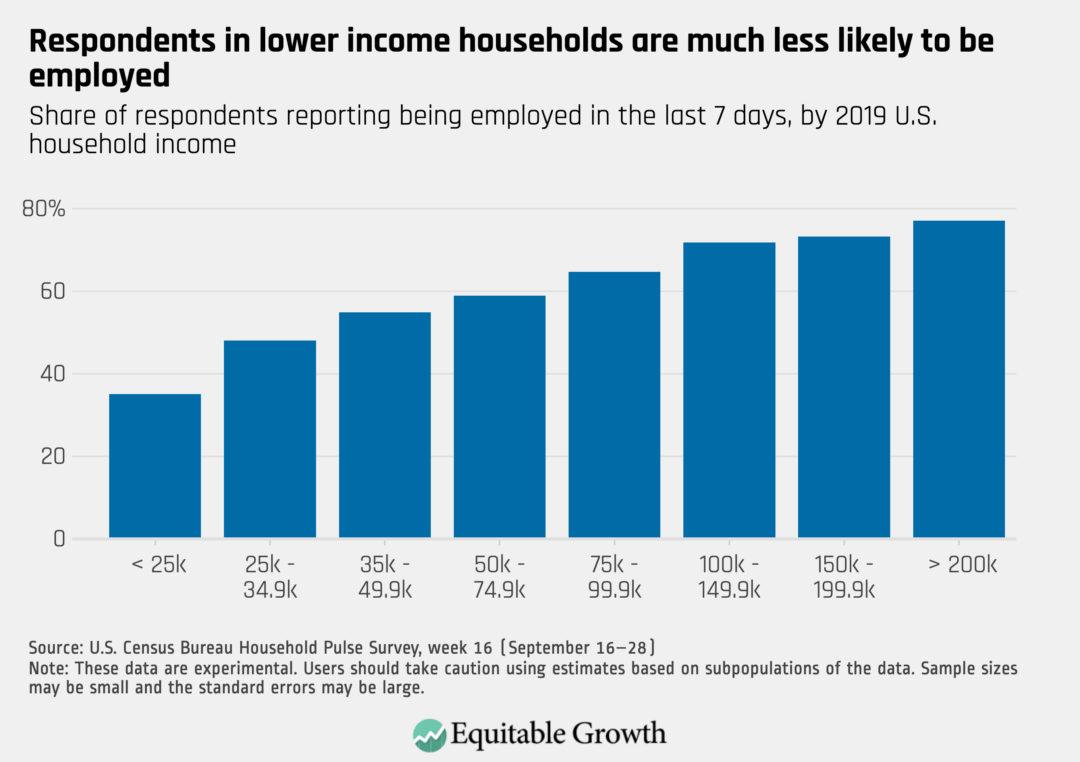
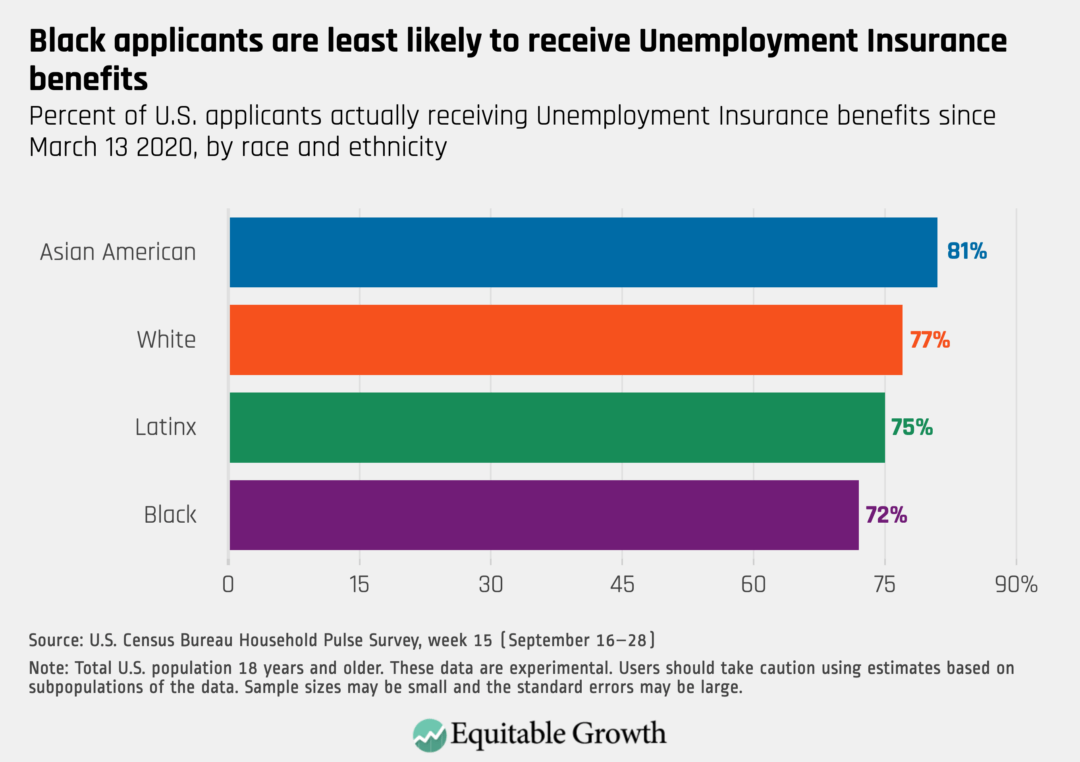
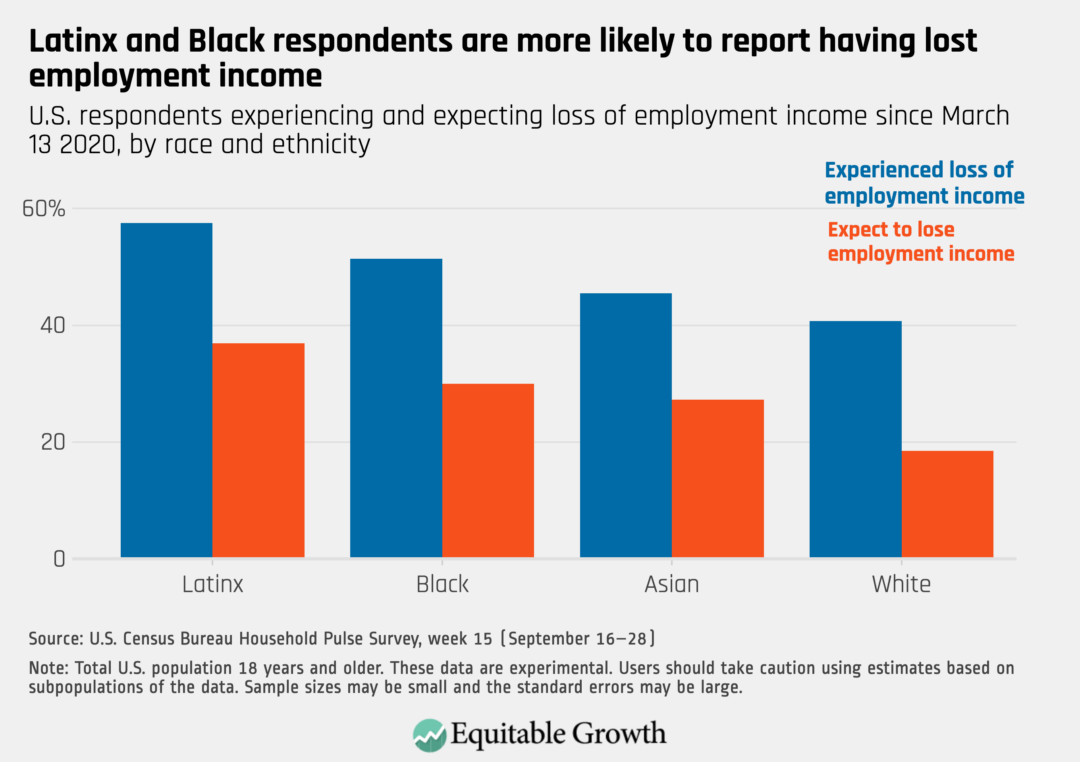
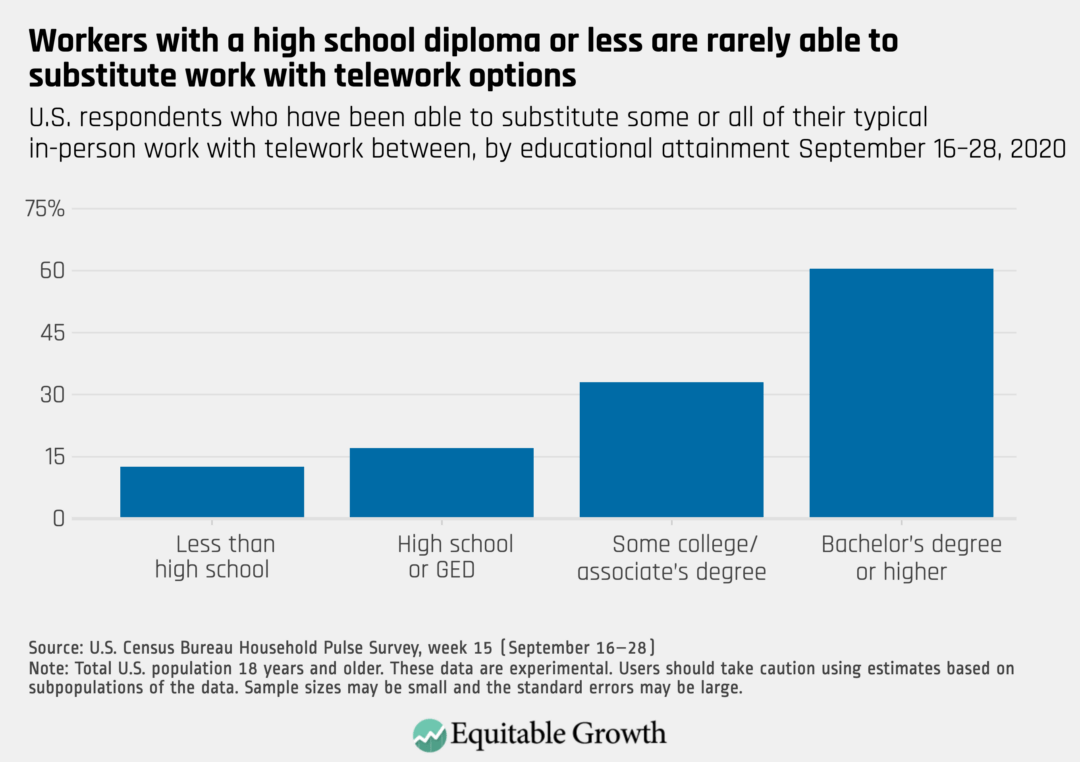
Earlier this week, the U.S. Census Bureau released new data on the effects of the coronavirus recession on workers and households for the period between September 16 and September 28. Austin Clemens, Kate Bahn, Raksha Kopparam, and Carmen Sanchez Cumming put together a series of five graphics that highlight key trends in the data.
Links from around the web
Before the coronavirus swept through the U.S. economy and society, low- and middle-income earners were finally starting to see their wages rise, writes The Washington Post’s Tory Newmyer, who looks at the Census Bureau’s 2019 Survey of Consumer Finances. Yet despite average wealth slowly increasing alongside rising wages, the divide between the haves and the have-nots continued to grow wider after the Great Recession of 2007–2009. In fact, Newmyer continues, the top 1 percent owns around one-third of all wealth in the United States—close to a three-decade high for that group—while the bottom 90 percent of income-earners saw their wealth decline over the past 30 years. Newmyer looks at the effect of generational transfers of wealth, namely via inheritances, on the racial wealth divide, as well as the booming stock market, finding disparities in both of these areas by race and income.
In small tourist towns, the coronavirus recession is threatening local economies in unprecedented ways. Vox’s Terry Nguyenvisits the city of Anaheim, California, which is home to Disneyland and whose economy revolves around the theme park’s success. But, as the park has been closed indefinitely to prevent the spread of the coronavirus and COVID-19, the disease it causes, small businesses in Anaheim have been hit hard and the city’s revenue has plummeted, leaving many to wonder whether any businesses will survive long enough to serve the millions of people who will return once the pandemic wanes and the park reopens. In the wake of Disney’s recent announcement that it will lay off 28,000 employees across its parks and in other corporate divisions, Nguyen writes, the fate of the city of Anaheim is tied to the fate of Disneyland. But, somewhat surprisingly, not all tourist towns are in the same dire position. Nguyen turns to Telluride, Colorado, and Sevierville, Tennessee—two small cities that are equally dependent on their local tourism attractions but have managed to stay afloat—in search of why some towns are struggling more than others.
If it wasn’t already clear that the coronavirus recession is hitting certain demographic groups harder than others, the latest employment data from the U.S. Bureau of Labor Statistics shines a harsh spotlight on the gender disparities of this recession. In fact, reports Stephanie Ebbert for The Boston Globe, four times more women than men left the labor force in September. Of the 1.1 million workers to drop out of the workforce, 865,000 were women, compared to 216,000 men. This discrepancy indicates that the burden caused by the child care crisis is being disproportionately carried by women, and reinforces many economists’ worries that women’s labor market gains over the past several decades are likely to be lost in this recession. The employment numbers also obscure the racial unemployment divides, Ebbert continues, with both Black women and Latina workers facing unemployment rates around 11 percent even as the overall joblessness rate for women is 7.7 percent.
Last week, California Gov. Gavin Newsom (D) signed a law establishing a taskforce to study the state’s role in the enslavement of Black Americans prior to the end of the Civil War and make recommendations about reparations. California at that time was a free state, Gillian Brockellwrites in The Washington Post, yet many White southerners brought these enslaved workers with them during the Gold Rush beginning in 1848 and could keep them enslaved in the state until it was abolished nationally in 1865. Brockell tells a handful of California’s hidden stories about enslaved Black Americans, which will get renewed attention now, thanks in part to this first-of-its-kind law, which had bipartisan support in the state legislature. Though some critics argue that no state alone can fully atone for the original sin of our nation and society—that has to come from the federal government, they argue—whatever action the California taskforce decides to take could be a start, alongside a federal reparations program.
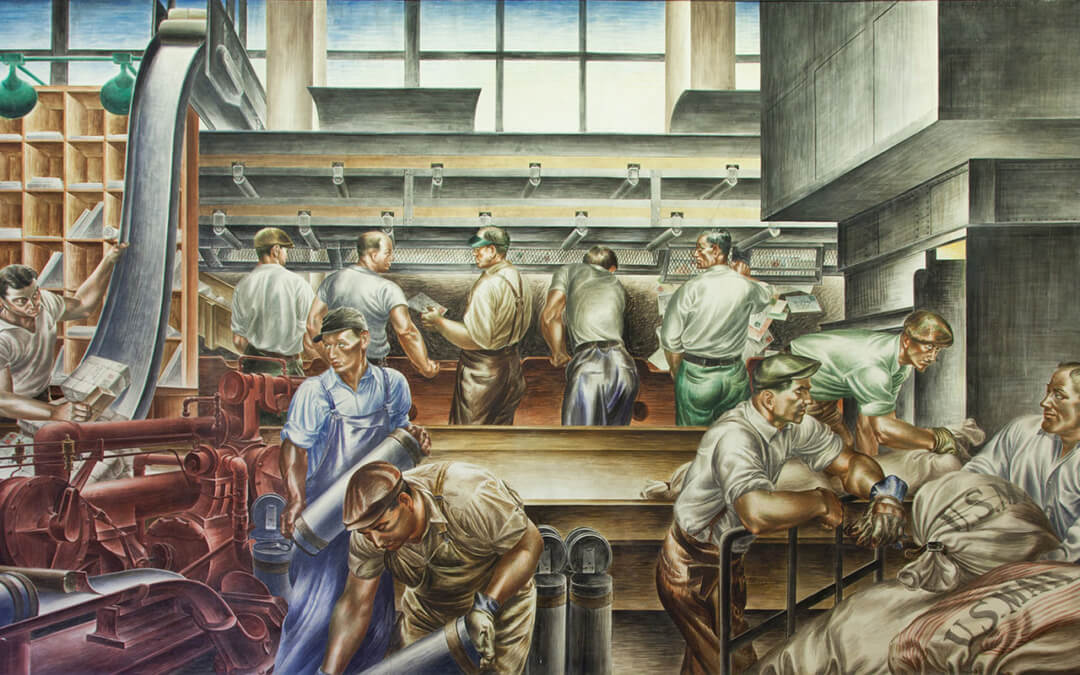
Photograph of mural “Post Office work room,” by Alfredo de Giorgio Crimi at the Ariel Rios Federal Building in Washington, D.C.
Overview
In March 2020, communities across the United States realized the gravity of the novel coronavirus pandemic and the deadly reach of COVID-19, the disease caused by the virus. As businesses shut their doors to prevent the transmission of the disease, the joint federal-state Unemployment Insurance program, which funds and administers unemployment benefits, provided important income replacement for people who could no longer report to work. Today, as March’s waves of temporary layoffs turn into permanent job losses, the role of the Unemployment Insurance system in stabilizing the U.S. economy and providing income security to unemployed workers and their families is no less crucial.
Yet although the continuing coronavirus recession makes clear the importance of unemployment benefits, the severe strains on the Unemployment Insurance system illuminate the deep flaws in the program. Inadequate financing for administration continues to cause long delays for workers who apply for unemployment benefits, as well as the denial of benefits for eligible workers. Stingy benefits paid by many states also leave workers relying on a patchwork system of uncertain federal benefits supplements subject to expiration. And the overlapping timing of this economic crisis with the national uprising over anti-Black racism shines a light on widespread racial disparities in access to unemployment benefits.
These increasingly visible failings are now spurring policymakers to better understand problems with the UI system and how they could be addressed through reforms at the state and federal levels. In this issue brief, we bring new findings to bear on the conversation around UI reform. We document the close connections between worker organization and access to unemployment benefits, as well as workplace collective action. Specifically, drawing on two sources of data—an original survey of essential workers fielded in spring 2020 and the 2018 Current Population Survey UI nonfilers supplement—we identify descriptive evidence that:
Labor organizations facilitate the use of unemployment benefits and, in the process, help close troubling racial and educational gaps in access to Unemployment Insurance.
Greater access to Unemployment Insurance amid the ongoing coronavirus recession leads workers to feel more comfortable engaging in workplace collective action to demand better safety and health standards.
Together, labor organizations and Unemployment Insurance form a “virtuous circle,” in which greater access supports workplace collective action, including forming labor unions, which, in turn, support greater access to unemployment benefits. These findings suggest three important implications for public policy, which we detail at the end of this issue brief:
U.S. labor law and Unemployment Insurance policies should complement one another.
Federal and state governments should support unions and worker organizations in connecting workers with the Unemployment Insurance system.
Though there are questions about whether a European model, in which unions or worker organizations directly administer unemployment benefits on behalf of the government, would operate effectively in the U.S. context, policymakers should consider it given the strong level of public support for such a model.
Unemployment Insurance: A vital—yet limited—social insurance program
Unemployment Insurance is the main social insurance program designed to support U.S. workers who lose a job through no fault of their own. By providing partial wage replacement to unemployed workers, Unemployment Insurance addresses both the symptoms of macroeconomic contraction (economic hardship at the individual level) and its causes (decreases in spending resulting in layoffs).
Unemployment Insurance is administered through a federal-state partnership, with the federal government setting program standards and providing funding for the administration of benefits, and individual states designing and implementing their own programs. To qualify for unemployment benefits, workers must satisfy both monetary eligibility criteria (typically amassing sufficient earnings over a four-quarter period to demonstrate attachment to the labor force) and nonmonetary eligibility criteria (typically leaving a job involuntarily and not for misconduct, searching for work, and remaining available for new work).
In many ways, Unemployment Insurance is successful. Unemployed workers who receive these benefits experience less poverty, mortality, and home foreclosures than workers who lack access to the program. The receipt of benefits also boosts worker health, facilitates access to credit, and improves the ability of workers to match with better re-employment opportunities when they return to work.1
At the same time, the coronavirus recession exposes a number of serious and longstanding flaws with the UI program. An erosion of UI financing makes it challenging to administer the program well, and many workers have faced difficulty accessing benefits because of cumbersome application procedures, outdated technical infrastructure, and overburdened staff.2 Many states have made unprecedented cuts to unemployment benefits since the Great Recession more than a decade ago, with some states now providing as few as 12 weeks of benefits, down from a customary 26 weeks.3 Significantly, the program’s overall structure has not changed much since its creation in the 1930s. This means the UI system is increasingly poorly matched to the changing nature of work. 4
An especially glaring problem with Unemployment Insurance involves low rates of applications for benefits and the actual take-up of those benefits. Many workers who are eligible to receive benefits do not apply for them in the first place. There are two key points that affect one’s ability to receive UI benefits. The first is the worker’s decision whether to apply. The second is the state’s decision whether the worker is eligible to receive benefits, which ultimately translates to the receipt of unemployment benefits.
In between each of these decision points, there are a variety of administrative hurdles that workers must clear. One is the potential difficulty of completing an application and undergoing recertification each week to demonstrate continued eligibility to receive benefits. Another is the potential difficulty of properly adjudicating eligibility decisions and disbursing benefits on the part of the state.
Through it all, workers must contend not only with state administrators but also the firms where they previously worked, which may attempt to discourage or challenge UI claims.5 Firms fight claims because employers’ UI contributions are linked to the payment of benefits to their previously employed workers, which means a greater number of workers’ claims will raise employers’ payroll tax liabilities.
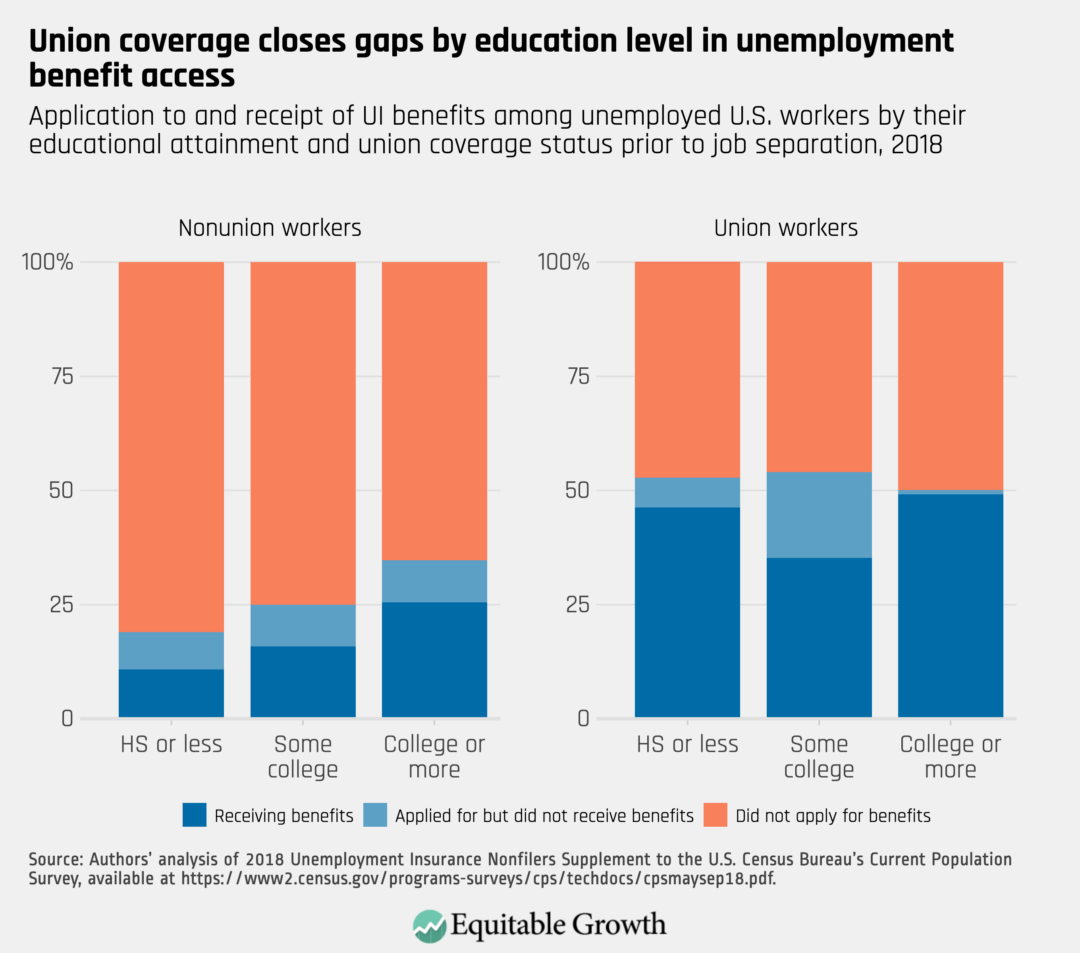
At each administrative hurdle, historically marginalized workers—especially workers of color and workers with lower levels of formal education—face barriers in accessing unemployment benefits. We can see this clearly when examining the UI nonfilers supplement to the Current Population Survey, the best nationally representative data collected on how unemployed workers make decisions about filing for Unemployment Insurance and whether they receive it.
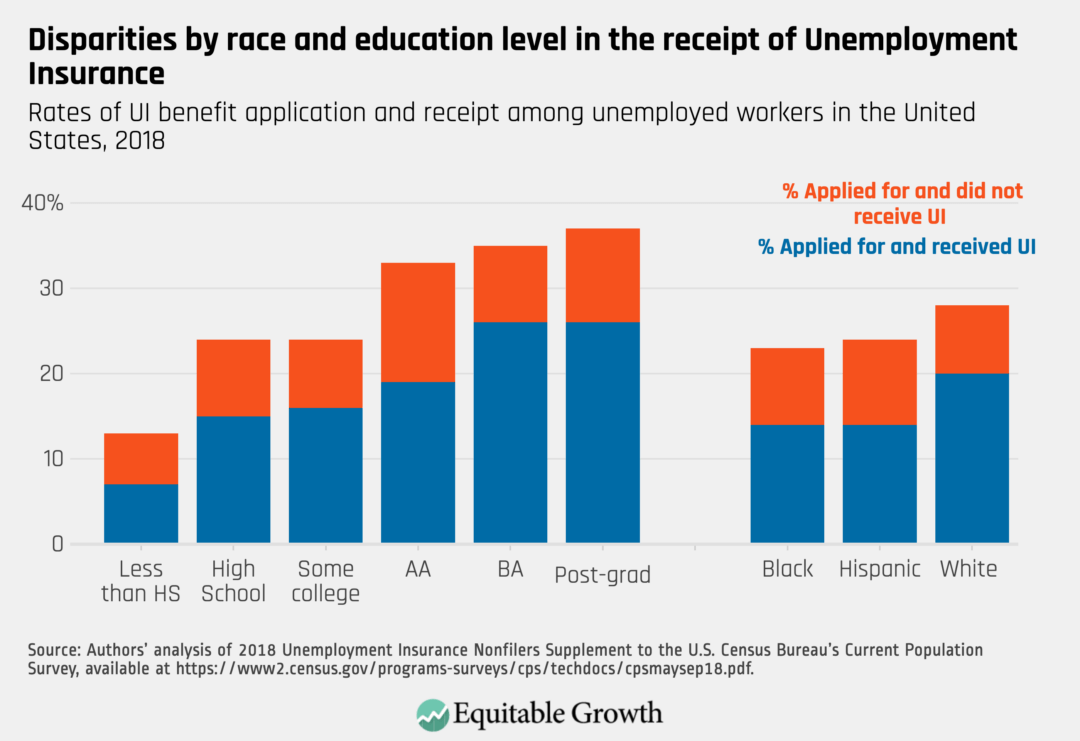
According to the 2018 Current Population Survey UI supplement, 28 percent of White, non-Hispanic unemployed workers applied for benefits, compared to 23 percent of Black unemployed workers and 24 percent of Hispanic unemployed workers. Differences by education were even starker: Just 20 percent of unemployed workers with a high school degree or less applied for benefits, compared to 27 percent of jobless workers with some college education and 35 percent of jobless workers with a 4-year college degree or more.
Data about who actually receives unemployment benefits also show disparities along the lines of race and education. Twenty percent of unemployed White workers received benefits, compared to 14 percent of Black and Hispanic unemployed workers. Across education levels, just 12 percent of jobless workers with a high school degree or less reported receiving benefits, compared to 17 percent of unemployed workers with some college and 26 percent of jobless workers with a college degree or more.
In sum, unemployed workers of color and those with less education are less likely to apply for unemployment benefits and, conditional on application, also are less likely to receive them. More recent, though less detailed, demographic data on access to Unemployment Insurance confirm these disparities have persisted throughout the coronavirus recession, with unemployed Black, Hispanic, and other workers of color remaining substantially less likely to apply for, and receive, Unemployment Insurance.6 (See Figure 1.)
Figure 1
Because of discrimination in the U.S. labor market, workers of color have lower earnings and thus are less likely to meet monetary eligibility criteria.7 Their employers may be more likely contest their claims, and they are disproportionately clustered in states with onerous application and recertification processes.8 In addition, there are several reasons why workers may fail to apply for unemployment benefits in the first place. They may not be aware of the program. They may not believe themselves to be eligible for the UI program. Or they may see the program as a source of stigma, or they may believe that it is too difficult to apply.9
The disparities in levels of applications for unemployment benefits and levels of receiving those benefits among less-educated workers and workers of colors are concerning because they signal that jobless workers who might most need them are not accessing them. Depressed levels of access to the UI program also dampen the ability of the program to play its role stabilizing the macroeconomy when it is most needed. Yet the lack of access to unemployment benefits does not just threaten the ability of the UI program to support the economy. It also undermines workers’ voices in the workplace, as the following section documents.
Unemployment Insurance and workplace collective action
There is good reason to think that unemployment benefits might affect the possibilities for collective action by workers in their places of employment. If workers are less fearful about the prospects of losing their jobs because of access to generous and timely unemployment benefits, then they might be more likely to engage in workplace actions to raise labor standards and organize unions. Indeed, past research suggests that generous Unemployment Insurance systems in other countries help foster more vibrant labor movements and worker organizing.10
In this section, we draw on an original nationally representative survey of 2,662 essential workers conducted at the early height of the coronavirus recession in late April and early May 2020 to understand the relationship between workers’ perceptions of access to Unemployment Insurance and their interest in workplace collective action.11 The timing of this survey was important because it was fielded at a moment when essential workers faced substantial risks to their health given the spread of COVID-19 and the uneven availability of protective equipment, such as masks or gloves.
The timing of the survey also overlapped with a number of high-profile labor actions at both traditional employers, including large retail chains such as Target and Whole Foods, and gig economy businesses, including Instacart and Amazon.com Inc.12 And the survey coincided with the temporary—and large—expansion of unemployment benefits as part of the Coronavirus Aid, Relief, and Economic Security, or CARES, Act enacted by Congress in late March 2020. The new law not only extended eligibility for Unemployment Insurance to workers traditionally excluded from state UI programs, such as self-employed workers, but also added $600 per week to conventional UI payments.
Did the availability of these generous new unemployment benefits and broadened coverage encourage workers to be more comfortable engaging in workplace actions to address health and safety conditions? To answer this question, we can turn to several questions on the survey.
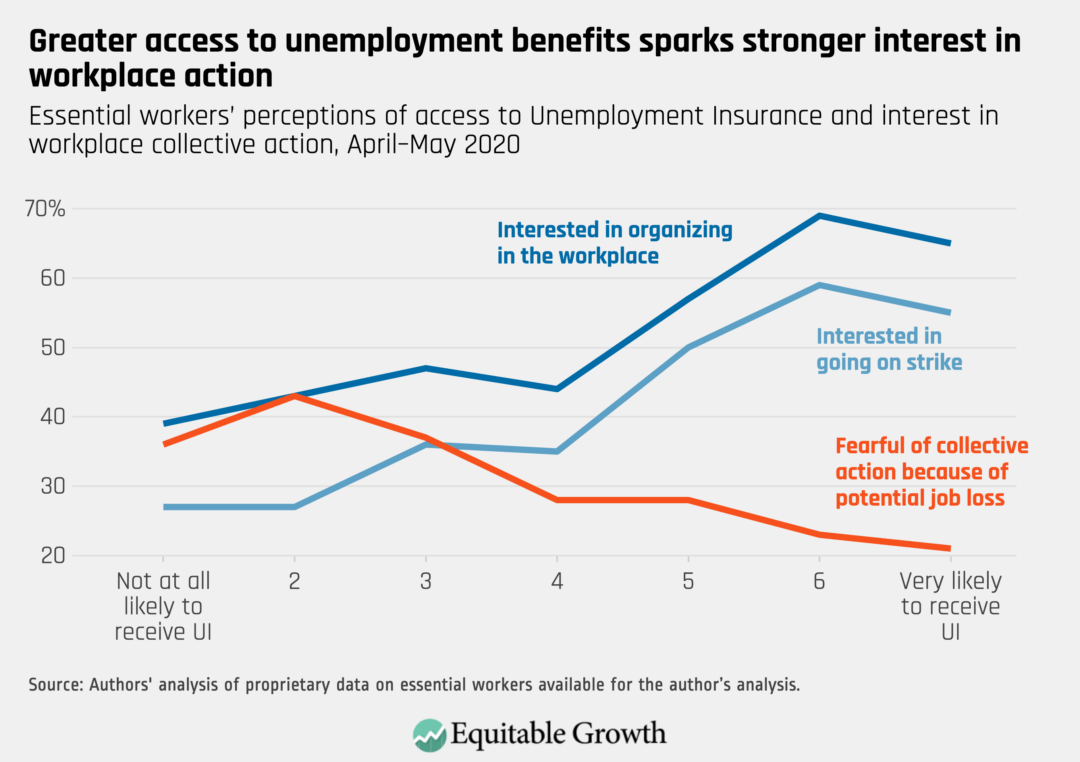
The first item asked respondents how likely they thought they would be to receive unemployment benefits if they had to quit their jobs due to health or safety reasons, on a scale of one to seven, which we use to gauge workers’ perceived access to Unemployment Insurance.13 The second set of items asked how likely workers would be to participate in a range of collective action at their jobs to address health and safety issues related to the coronavirus pandemic, including participating in a strike and joining a worker organization, on a one-to-four scale.14 The final set of survey items asked why workers might be reluctant to engage in collective action at their jobs, including if workers were fearful of losing their jobs.15 (See Figure 2.)
Figure 2
Figure 2 shows that workers who were more confident in their ability to access Unemployment Insurance were more likely to express interest in joining worker organizations and going on strike to address health and safety concerns at their jobs. Workers who were most confident about this access were about twice as likely as those who were least confident about this access to express interest in both forms of collective action.
In addition, workers who were more confident in their access to unemployment benefits were substantially less likely to say that the obstacle to collective action was their fear of losing their jobs. This implies that access to the UI program drives comfort with collective action by reducing the downside risks of losing one’s job. Importantly, all three relationships—interest in joining a union, going on strike, and fear of collective action resulting in losing one’s job—remain virtually unchanged even after adjusting for a range of respondent characteristics.16
The essential workers survey thus suggests that unemployment benefits not only provide an important source of economic security to workers and their families, but also underpin employees’ voices in their workplaces, supporting collective action necessary for securing the resources and protections workers need to keep themselves and their communities healthy amid this pandemic. The protection that Unemployment Insurance affords to workers who might otherwise be fearful of losing their jobs or facing pay cuts is especially important because U.S. employers can and do discipline and fire workers for speaking out about working conditions.
Investigative reporting reveals companies blocking worker attempts at collective action amid the coronavirus recession across numerous industries. They include online giant Amazon.com, food conglomerate Cargill Corp., the ubiquitous fast-food chain McDonald’s Corp., major retailer Target Corp., and the regional sit-down restaurant chain Cheesecake Factory Inc. All of these companies have either barred workers from sharing information about COVID-19 cases in their workplaces or restricted workers from speaking out about poor workplace health and safety standards.17
Given that access to Unemployment Insurance is so important for empowering workers, how can policymakers ensure that all workers—especially historically marginalized workers—have access to the system? We turn next to the role that labor unions play in connecting workers with UI benefits.
Labor organizations and access to Unemployment Insurance
Just as access to unemployment benefits supports workplace collective action and unionization, unions also help workers exercise their legal rights—including applying for and receiving unemployment benefits.18 On an informational level, unions can help workers become aware of the UI program and the process necessary to apply for and continue receiving jobless benefits.19 On a practical level, union staff can help workers to complete their initial claims for unemployment benefits, as well as the ongoing certifications necessary to document continued eligibility for benefits.
By normalizing discussion about using unemployment benefits, unions may additionally help to reduce any stigma surrounding the UI program that might prevent workers from applying—a major impediment to take-up of other U.S. social programs.20 Unions also can protect workers against retaliation from employers seeking to prevent workers from claiming benefits. And lastly, by setting higher standards around wages and work schedules, unions might make it more likely that workers would qualify for unemployment benefits in the first place by meeting both monetary and nonmonetary eligibility criteria.
Indeed, in many ways unions are uniquely well-equipped to connect workers with the UI program. Unions often have close and trusted relationships with workers, including historically vulnerable workers—relationships that can be used to convey information and assistance about the program. Because access to Unemployment Insurance lowers barriers to labor organizing, unions and other labor organizations have a strong incentive to help members access the program. And, perhaps most importantly, labor organizations such as unions and many alt-labor groups are unique because they are designed to pursue democratic accountability. This focus on democratic accountability, both in mission and organizational structure, pushes them to help their members secure important labor market benefits, including Unemployment Insurance.
Indeed, past research indicates that unions historically played an important role in facilitating access to unemployment benefits. Using the National Longitudinal Survey of Youth for 1979–1991, labor economists John Budd at the University of Minnesota and Brian McCall at the University of Michigan document that unionized workers were more likely to receive unemployment benefits.21 The authors found no differences between white-collar workers receiving unemployment benefits depending on whether they were in a union job, but identified large differences among blue-collar workers depending on union coverage. Blue-collar workers laid off from union jobs were about 23 percent more likely than comparable workers to receive Unemployment Insurance. Repeating the same exercise using Current Population Survey data from 1996, Budd and McCall reached nearly identical conclusions.22
In this brief, we extend and update this analysis of union differences in UI access, relying on the 2018 Current Population Survey UI Supplement to understand whether unions can continue to facilitate more workers receiving unemployment benefits even after decades of declines in union membership.
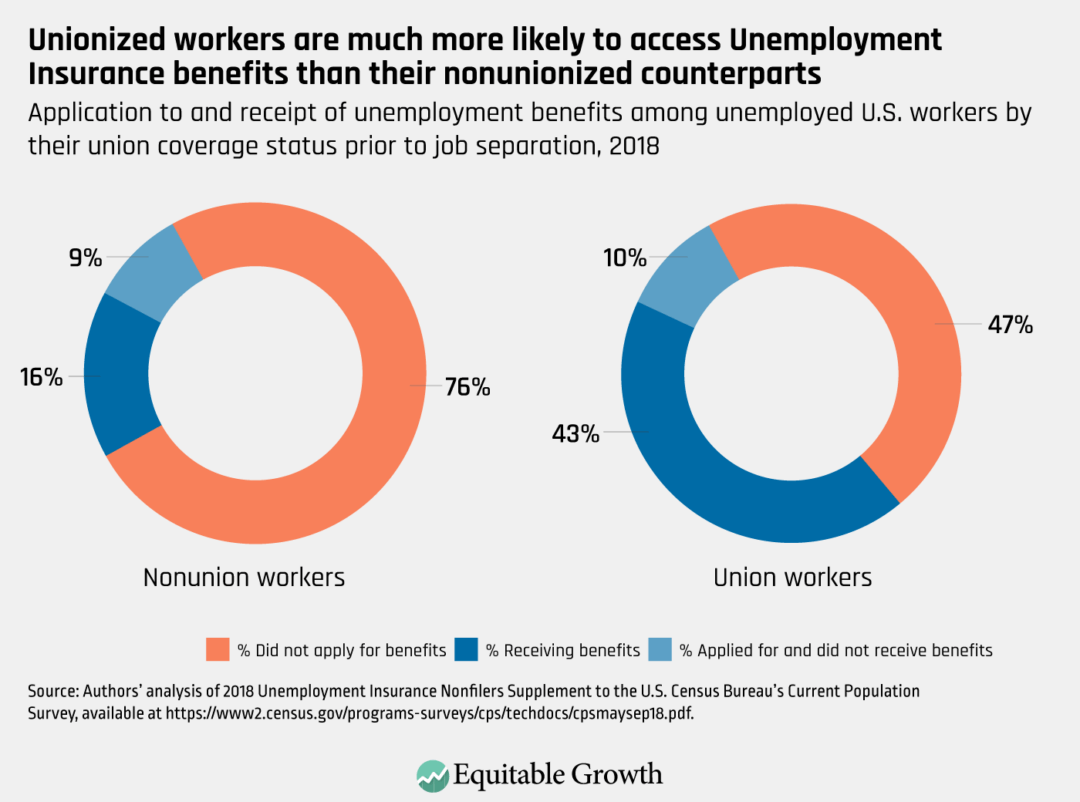
Looking first at overall rates of access to Unemployment Insurance among unemployed workers with recent work histories, we find that workers who had previously been in a union job were substantially more likely to report that they applied for unemployment benefits and received them than were workers who had not been in union jobs.23 (See Figure 3.)
Figure 3
Figure 3 shows that only 24 percent of nonunion workers reported applying for benefits in 2018, but 53 percent of unionized workers did—more than double the nonunion rate. The difference was even larger when looking at those workers who received unemployment benefits. Just 16 percent of nonunion unemployed workers reported receiving benefits in 2018, compared to 43 percent of unionized jobless workers.
One question is whether the union difference reflects the effect of unions themselves or the characteristics of workers in unionized workplaces. If more highly educated workers are more likely to work in unionized businesses and are also more likely to apply for and receive unemployment benefits, then the union difference might be spurious—reflecting workers’ educational attainment and not unions themselves. Similarly, unionized workers might be more likely to live and work in states with easier-to-access UI programs.
To account for these possibilities, we estimated the union difference in either UI application or receipt while adjusting for a range of worker and job characteristics. We additionally factored into our analysis the states where workers lived to account for the characteristics of underlying UI programs, such as the generosity of benefits or eligibility requirements.24 Importantly, we also factored in the reason workers reported for being unemployed.
With these adjustments, we find that unemployed union workers were about 19 percentage points more likely to apply for Unemployment Insurance and were also about 19 percentage points more likely to receive these benefits. The magnitude of these effects is very similar to those identified in past research, suggesting that unions are continuing to help workers apply for and ultimately receive UI benefits.
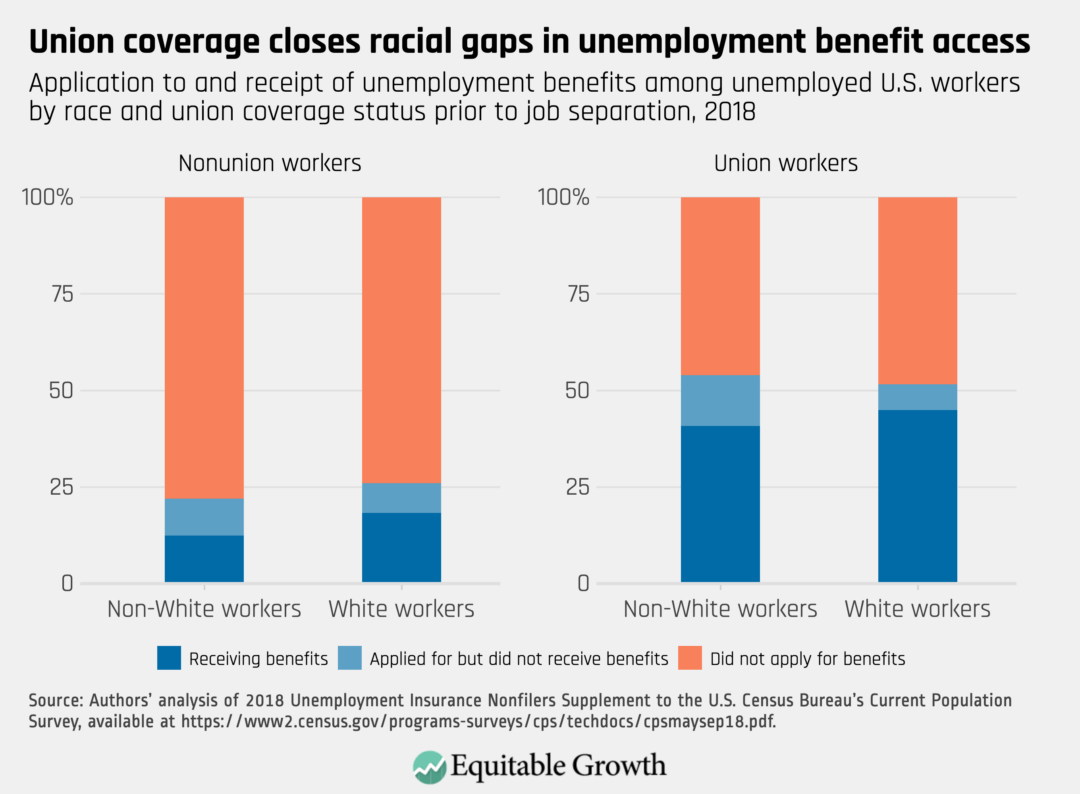
Unions facilitate access to unemployment benefits. But can they help close gaps in UI application and receipt among workers of color and those workers with less education? We examine this question next.
Labor organizations and disparities in UI access
We find that unions can help address the stark inequalities in applying for and receiving unemployment benefits by education and race and ethnicity that we documented earlier. Figures 4 and 5 show rates of UI application and receipt by union coverage and race or education.25 In each case, unionized workers are more likely to apply for and receive benefits, confirming the results in the previous section. But, just as importantly, these gaps in rates of access and receipt are smaller between union workers than for nonunion workers.
Looking first at race, among those workers outside of the labor movement, non-White workers are about 17 percent less likely to apply for and 32 percent less likely to receive unemployment benefits than are White workers. This is a relatively large divide. But among unionized workers, the gap in receiving these benefits by race fell to just 9 percent, and the trend reverses at the point of application, with workers of color being slightly more likely to apply for benefits (though the difference is not statistically significant). (See Figure 4.)
Figure 4
For nonunion workers, more educated workers are more likely to apply for and receive unemployment benefits than their less-educated counterparts. This trend does not hold for union workers, indicating that inequalities across formal levels of education are much smaller for union members, compared to nonunion workers. Indeed, these differences are not statistically significant. (See Figure 5.)
Figure 5
Implications for reforming the Unemployment Insurance system
This issue brief documents how unions play an important role in the U.S. Unemployment Insurance system, helping jobless workers to apply for and receive benefits that they need to support themselves and their families and that boost the U.S. economy during economic downturns. In recent years, unionized workers are about 19 percentage points more likely to apply for and receive benefits than are nonunionized workers, even after accounting for worker, job, and state characteristics. Just as importantly, our results suggest that unions may help to close large gaps in access to and receipt of unemployment benefits—gaps that limit jobless benefits for already marginalized workers.
Too often, policymakers and academics alike separate issues related to Unemployment Insurance and those related to unionization and worker power. When it comes to crafting sound policies for both of these areas, our issue brief implies that policymakers should work across these siloes. There are several concrete measures that policymakers concerned with these issues should consider.
First, policymakers who focus on worker organization should consider the serious shortcomings of the U.S. Unemployment Insurance system. These failings prevent many workers from feeling that they are truly insured against involuntary job losses and have important implications for worker power.26 When workers are more confident that they can claim unemployment benefits, they are more comfortable exercising their voices in their workplaces. In addition to raising benefit access and generosity, one concrete reform that policymakers should thus consider is making Unemployment Insurance more widely available to workers engaged in labor strikes or other forms of collective action on the job.
Second, at a time when policymakers are debating measures to expand access to unemployment benefits, our research suggests that unions ought to be a central part of those reforms. Unions are already connecting workers, especially vulnerable workers, to unemployment benefits and could do even more in a reformed UI system. For instance, policymakers might consider creating federal and state funding for worker organizations—including unions, but also worker centers and other labor groups—to help facilitate even greater access to these benefits. Such funding would formalize the benefit navigation function that unions are already providing to millions of jobless workers and additional resources would permit unions to reach even more workers.27
Finally, there is an active policy conversation about building unions or other worker organizations into the Unemployment Insurance system. Permitting worker organizations to run unemployment insurance funds of their own on behalf of state governments and the federal government—what is known as a Ghent-style UI system—is used successfully in several Northern European countries.28 Still, lower levels of union membership in the United States could pose challenges to successfully implementing such an approach across all states, territories, and the District of Columbia. In addition, a key lesson amid the coronavirus recession is the need to increase the strength of the UI system so that it is more—not less—centralized. And policymakers would need to ensure that worker-led UI funds provide a baseline level of benefits to all eligible workers, regardless of whether they are union members.
On the other hand, many U.S. unions have longstanding experience administering health and benefit funds, and worker-led UI funds could improve access to the Unemployment Insurance system at a time when the infrastructure for administering UI benefits is quite weak. Moreover, as we detail above, unions may have advantages in providing labor market services such as UI benefits alongside other services such as job search and training functions, given their close relationships to both workers and employers. Many American workers say they support this type of change, which is why policymakers should thoughtfully consider it as an option for helping unions to reach more workers interested in labor representation, while also scaling up access to the Unemployment Insurance system.29
On October 7, the U.S. Census Bureau released new data on the effects of the coronavirus pandemic on workers and households. Below are five graphs compiled by Equitable Growth staff highlighting important trends in the data.
While continued progress on extending economic relief has stalled, a majority of Black and Latinx households reported having difficulty paying household expenses as of the last two weeks of September.
Job losses are concentrated among low- and middle-income workers, who are much less likely to be employed compared to high-income workers as of the end of September.
One-quarter of Latinx workers and 28 percent of Black workers who have applied for Unemployment Insurance have not received benefits since the start of the Coronavirus Recession.
More than half of Latinx and Black survey respondents reported they have lost income since the beginning of the Coronavirus Recession and roughly a third expect to lose income in the coming month.
Most workers without a college degree are not able to work remotely from the safety of their homes, exacerbating the polarization of job quality by education level.
The retirement savings system in the United States is deeply flawed.
Overview
Outside of homeownership, retirement savings are the most important way middle-class workers and their families build wealth in the United States. But this second pillar of wealth creation is woefully inadequate for most workers to prepare for a financially secure retirement. What’s worse, the coronavirus pandemic and resulting recession are forcing many workers to tap their savings just to stay financially afloat.
Thirty percent of Americans with a retirement savings account withdrew a portion of their savings over the previous 2 months, with more than half using the money to cover necessary expenses such as groceries or housing payments, according to a May 2020 survey by a unit of the online lender LendingTree LLC. An additional 19 percent of savers planned to make a withdrawal, according to the survey. And the Federal Reserve’s just-released 2019 Survey of Consumer Finances, or SCF, finds that even before the pandemic, 18 percent of households with more than $2,500 in a retirement account had less than that in easily accessible liquid savings. More than 1 in 3 Black households and 22 percent of Latinx families found themselves in this precarious situation in 2019.
Then, there are so many other low- and middle-income workers who simply don’t have enough money, after monthly expenses, to save at all. Their sole savings plan is Social Security, which offers uneven retirement security due to its eligibility based on work history and an ineffectual minimum benefit formula. In fact, there is evidence that working Americans are heavily reliant on debt—the financially debilitating opposite of savings—just to make ends meet.
Indeed, brand new data on retirement savings from the Federal Reserve that we examine in this issue brief shows just how shaky and inequitable this second pillar of the middle class really is. The new data show that:
Since the end of the Great Recession of 2007–2009, the only demographic group better-off in terms of retirement plan coverage are the rich—those in the top 10 percent of the income spectrum.
Nearly two-thirds of Hispanic families and nearly one-half of Black families do not own a retirement plan, compared to roughly one-fourth of White families and fewer than one-tenth of high-income families.
White, working-age families have more than 3.5 times the retirement savings of their Black counterparts and nearly 5.5 times more than Hispanic families.
The top 10 percent of working-age families by income have more in retirement savings than the bottom 90 percent combined.
Some policymakers recognize these deficiencies in our retirement savings system and have proposed reforms that would:
Increase Social Security’s minimum benefit and make other improvements to the program, paid for by raising payroll taxes on the very rich or by reducing the tax incentives for retirement savings that disproportionately benefit the wealthy
Create, at the federal level, a more muscular version of the kind of state automatic-enrollment IRA plans now providing a streamlined way for some low- and middle-income families to save
Make it easier for families to save for both short- and long-term needs by allowing taxpayers the chance to save a portion of their tax refund and employers to automatically enroll their workers in emergency savings accounts
In this issue brief, we examine the state of the retirement savings system in the United States, explore the deep racial and income disparities embedded in that system, and then detail these possible policy solutions.
The state of retirement savings in the United States today
Like homeownership, public policies are used to help workers save for retirement. There are tax-preferred retirement accounts, such as employer-sponsored individual retirement accounts, or IRAs, and 401(k)s, which allow families to defer taxes on savings, and the investment earnings on those savings, until withdrawal in retirement. These two “defined-contribution” savings vehicles are the most popular retirement plans.
But there are other types of tax-preferred retirement accounts. They include 403(b)s for nonprofits, a number of plans geared at small businesses and sole proprietorships, including Savings Incentive Match Plans for Employees, or SIMPLE IRAs, Simplified Employee Pension plans, Payroll Deduction IRAs, and Keogh plans for self-employed workers and small businesses. There also are so called Roth versions of some of these accounts, in which contributions are made with post-tax money so that withdrawals in retirement are entirely tax free.
These retirement accounts are the one place where the low- and middle-class savers get a modicum of exposure to stock investments, with all the upside and all the risk that comes with it. But still, the vast majority of stock holdings are owned by White, rich Americans.
It is important to remember, though, that private retirement wealth is in addition to Social Security, a public program that is guaranteed to all Americans who spend at least 10 years in the formal workforce. The current average benefit amount for Social Security retirees is $1,514 a month, but the amount is much lower for those with limited work history and low wages during their working years.
But even before Americans can start supplementing their Social Security by saving in tax-preferred accounts, they need to have access to an account at work. Technically, individuals can open an IRA on their own, but behavioral research tells us this is very rare because it takes initiative and know-how on the part of busy, cash-strapped families.
Also exceedingly rare in today’s economy are companies that don’t just provide an account but also take on the investment responsibilities and guarantee a defined benefit upon retirement. In a risk-shift of epic proportions, these defined-benefit plans have been largely replaced over the past three decades by defined-contribution plans, which include the vast majority of savings vehicles listed above (though some Keogh plans can be set up as defined-benefit plans and sometimes IRAs are considered a separate category).
New data on retirement coverage and account balances
According to the Federal Reserve’s Survey of Consumer Finances, a triannual survey released just last week, 63.3 percent of families in the United States had a retirement plan of some kind in 2019, likely from a current or former job. (See Figure 1.)
Figure 1
Among those families with a head of household ages 25 to 64, 63.2 percent owned a retirement account. (See Figure 2.)
Figure 2
These data are roughly aligned with the U.S. Department of Labor’s most recent National Compensation Survey, or NCS, which estimates that 71 percent of current workers are offered a retirement plan through their job, with 78 percent of those taking up the offer. This results in a 55 percent participation rate. Offer rates are considerably higher at unionized workplaces (94 percent), larger firms (89 percent at companies with 500 or more employees), and those firms with high-paid workforces (90 percent when the firm’s average wage falls in the top fourth of the income distribution).
The NCS numbers are from March 2020, right as the coronavirus pandemic was hitting the United States, and the SCF numbers are from 2019, before the current public health and economic crises. Both sets of surveys are telling policymakers more about the financial health of American families going into the coronavirus recession, rather than their current circumstances.
While overall retirement coverage has held steady over the past two-and-a-half decades, the topline numbers mask the aforementioned shift from defined-benefit to defined-contribution savings plans, which is particularly evident among working-age Americans, as seen in Figure 2.
The economic inequalities perpetuated by the U.S. retirement savings system
Also masked, to some extent, are the consequences of the 2008 financial crisis and resulting Great Recession, which is still delivering a lasting, negative impact on retirement coverage for working-age Americans. New data from the 2019 Survey of Consumer Finances confirm this effect across race and income.
The data show that the only demographic group better-off since that crisis in terms of retirement plan coverage are the rich—those in the top 10 percent of the income spectrum. As a result, gaps in coverage rates between White, high-income families and everyone else have only widened. Nearly two-thirds of Hispanic families and nearly one-half of Black families do not own a retirement plan, compared to roughly one-fourth of White families and fewer than one-tenth of high-income families. (See Figure 3.)
Figure 3
Retirement savings account balances also paint a distressing picture. The overall average of $119,000 would amount to just $505 per month in retirement. This calculation is based on the U.S. Department of Labor’s Lifetime Income Calculator and assumes the $119,000 is used to purchase a single annuity with no survivor benefit, effective at age 65. Even assuming that the $119,000 belonged to a 45-year-old today (so that it could grow at a 7 percent nominal rate per year over 20 years), the amount of lifetime income provided would be just $1,102 per month.
What’s more, that $119,000 average conceals substantial inequities. White, working-age families have more than 3.5 times the retirement savings of their Black counterparts and nearly 5.5 times more than Hispanic families. These racial discrepancies are illustrative of the way discrimination and structural racism permeate every aspect of economic life in the United States, going back more than four centuries. The top 10 percent of working-age families by income have more in retirement savings than the bottom 90 percent combined. (See Table 1.)
Table 1
Additionally, early withdrawals from these retirement accounts often deplete account balances prematurely. According to a survey by the Robert Wood Johnson Foundation, at least 4 in 10 Latinx, Black, and Native American households have used up all or most of their household savings to cope with the consequences of the coronavirus recession. Some “leakage” from retirement accounts is a result of a recently enacted relaxation of early withdrawal penalties, which normally charge savers a 10 percent fee to access retirement money early. This relaxation happened because Congress wanted to help Americans suffering financially amid the coronavirus recession, but even when the penalty was intact, leakage is a common occurrence, especially for families that lack other sources of emergency savings.
This often makes sense from the household perspective: What good is $15,000 some 20 years from now if rent is due this week? According to the Fed’s 2019 Survey of Household Economics and Decisionmaking, 37 percent of families say they would have to borrow or sell something in order to cover a hypothetical $400 unexpected expense. And the just-released SCF finds that in 2019, 18 percent of households with more than $2,500 in a retirement account had less than that in easily accessible liquid savings. More than 1 in 3 Black households and 22 percent of Latinx families found themselves in this precarious situation.
Policy prescriptions
There are a number of interesting policy ideas for addressing this complex web of problems. The most sweeping proposals call for expanding Social Security. The Social Security 2100 Act proposed by Rep. John Larson (D-CT), for example, would increase the program’s benefits, including the minimum benefit. Boosting the minimum benefit would go a long way to reducing poverty in old age and reversing the aforementioned risk shift that has placed a heavy burden on individuals to manage their own investments and forecast their retirement spending needs decades into the future. The money for such an expansion could come from relaxing the cap on wages covered by the Social Security payroll tax, which today only applies to the first $137,700 in salary. The Social Security 2100 Act would apply the payroll tax to wages above $400,000, affecting the top 0.4 percent of wage earners.
Expanding Social Security also could be paid for by reducing the current tax incentive provided to private retirement savings. As is well-documented, the vast majority of the benefits of the current retirement tax breaks go to the wealthiest Americans—and actually provide more benefit, in both dollar and percentage terms, the higher up the income spectrum one goes. This upside-down system costs taxpayers roughly $250 billion each year, according to the Joint Committee on Taxation’s 2019 estimate of the following tax expenditures: Keogh plans ($14.4 billion), defined-benefit plans ($84.8 billion), defined-contribution plans ($125 billion), traditional IRAs ($18.2 billion), and Roth IRAs ($7.7 billion). In total, this amounts to roughly 15 percent of all federal income tax revenue.
Even if not coupled with an expansion of Social Security, curtailing this regressive tax expenditure would make for good public policy. Today, wealthy Americans (who surely would save a large proportion of their bountiful income even without any tax incentive) are able to shelter $57,000 a year in an employer-sponsored retirement account (assuming they are self-employed or have established a small business, which is easy enough to do), almost equal to the entire income of the median American family in 2019. It is true that business owners who make use of the $57,000 tax break must also make a plan available to their employees, but even today, with this generous incentive intact, many businesses choose not to sponsor plans at all.
Capping the total amount that could be saved in a tax-preferred retirement account (to, say, the amount needed to fund a veryample annuity) or limiting the tax deduction allowed for those at the upper reaches of the income spectrum would be sensible, if small, ways for the government to stop subsidizing the massive concentration of wealth at the top.
Not surprisingly, the financial industry opposes these potential reforms, claiming that reducing the tax incentives will mean less retirement savings coverage overall. What is perhaps more surprising, though, is the financial industry’s opposition to far more modest attempts to make the country’s savings system more egalitarian.
Take, for example, state automatic-enrollment IRA plans, or auto-IRAs. California, Oregon, Illinois, and a number of other states recently launched universal automatic enrollment plans that place into government-sponsored Roth IRAs a small portion (usually 5 percent) of the wages of all workers who don’t otherwise have access to a retirement plan at work. Workers are free to opt out, but most go along, a testament to the power of the default.
Because these state auto-IRA plans are large and publicly managed, the investment and administrative fees are low—an important consideration, given the confusing mix of high, often hidden fees that plague private-sector IRAs and 401(k)s. What’s more, because the contributions to these state-run IRA plans are post-tax, there is no penalty for taking the money out early should the saver need the cash sooner rather than later.
Even though these are small-dollar savers putting away their own money (there is no employer or government contribution), private retirement providers still feel threatened, which is one reason why conservative federal lawmakers, usually champions of states’ rights, continually push to preempt states’ ability to pursue these programs. Thankfully, the states have been able to proceed, though the programs are just getting off the ground. Even if implemented successfully, however, the account balances in these state auto-IRA plans will likely be small, given the low-income population they target and the lack of any employer or government match.
There are a number of federal proposals that would go further than the states in this regard. Most notable is the Saving for the Future Act from Sens. Chris Coons (D-DE) and Amy Klobuchar (D-MN). The proposed law would expand access to portable plans to those currently without coverage and would require employer contributions.
Finally, to address Americans’ lack of short-term, emergency savings, a bipartisan group of senators have proposed the Refund to Rainy Day Savings Act and the Strengthening Financial Security Through Short-Term Savings Accounts Act. The former would allow workers to seamlessly put aside part of their tax refund into an interest-bearing account for use later in the year, and the latter would allow employers to automatically enroll their workers in a “sidecar” account for short-term savings, alongside the less liquid retirement account. These ideas mirror those that were included in our Vision 2020 essay by economists Emily Wiemers at Syracuse University and Michael Carr at the University of Massachusetts Boston on improving workers’ short- and long-term economic well-being.
None of these proposed policy solutions to the growing retirement savings divide would individually do enough to close the gaping divide between the haves and have-nots, and between White savers and savers of color. But these policy proposals are evidence-based ideas that, in the right political moment, could come together alongside other policy reforms to improve the financial security of low- and middle-class American families and unleash the country’s true economic potential.
Every month the U.S. Bureau of Labor Statistics releases data on hiring, firing, and other labor market flows from the Job Openings and Labor Turnover Survey, better known as JOLTS. Today, the BLS released the latest data for August 2020. This report doesn’t get as much attention as the monthly Employment Situation Report, but it contains useful information about the state of the U.S. labor market. Below are a few key graphs using data from the report.
The quits rate declined slightly to 2.0% in August as the tenuous recovery stalled.
The vacancy yield edged up slightly as job openings declined and hires were unchanged. The steady hires rate was a result of increased government temporary hiring for the Decennial Census balanced by decreased hiring in accommodation and food services and healthcare and social assistance.
The ratio of unemployed-worker-per-opening dropped to nearly 2:1 as the slight decrease in job opening rate was offset by a greater decrease in the unemployment rate.
The Beveridge Curve moved closer to its position prior to the pandemic, but remains in unprecedented territory as the unemployment rate remains elevated, alongside a job opening rate that has returned to its lower early 2020 levels.