Most recent JOLTS release provides latest data on how the coronavirus recession is different from the Great Recession

The U.S. Bureau of Labor Statistics today released its monthly Job Openings and Labor Turnover Survey for the month of June. Also known as JOLTS, the survey collects data on job openings, hires, layoffs, quits, and other separations between workers and employers, providing information on the labor market dynamics behind June’s overall change in employment.
Over the past few months, JOLTS data have shown how the coronavirus recession has, so far, been different from previous downturns. In typical economic contractions, the number of job openings, hires, and quits usually start to fall before there is a surge in layoffs because workers and employers become more cautious when the economy starts to take a turn for the worse. But when the consequences of the pandemic crashed into the U.S. economy in February, layoffs led the way, with a record 11.5 million workers losing their jobs in March alone.
By June, the previous month with published JOLTS data, as states lifted their shelter-in-place orders and coronavirus cases declined, the pace of layoffs plunged. Hiring was strong, as many temporarily laid-off workers were called back. Yet job openings and quits were still below their pre-pandemic levels, a clear sign that the U.S. economy remained in a downturn.
The most recent Employment Situation Summary, also known as the Jobs Report, released this past Friday, detailed labor market statistics for mid-June to mid-July and showed a slowdown in the job gains the U.S. economy made in the previous 2 months. Today’s JOLTS release provided data for the entire month of June and showed, for instance, that between May and June there was no change in the pace of layoffs, the rate of hiring declined with respect to the previous month, and job openings continued to recover in June.
Here are what four labor market indicators available through JOLTS can tell us about how workers and employers experience economic booms and downturns, as well as how this recession is different from the previous one.
The quits rate
The quits rate measures the share of the U.S. workforce that decides to leave their job in a given month. Because most quits are voluntary and tend to reflect job-switching for new opportunities rather than entry into unemployment or exit from the labor force, the quits rate gives insight into workers’ confidence in the strength of the labor market. During booms, workers are more willing to change jobs and find positions that are a better match for their skills or desired earnings, freeing up spots for other workers. As a result, quits tend to have a positive relationship not only with overall job creation but also with the quality of those jobs, since employers have to offer higher wages and more career-advancement opportunities in order to keep and compete for workers.
Conversely, the relationship between quits and the business cycle points to one of the many channels through which both employed and unemployed workers lose bargaining power during downturns. Gadi Barlevy of the Federal Reserve Bank of Chicago proposes that as workers become less willing and able to leave their jobs during recessions, the decline in the quits rate points to a “sullying” effect, where workers get stuck in either low-quality jobs or in positions that are a bad match for their skills. Research shows, for instance, that one of the reasons the Great Recession of 2007–2009 was particularly tough on younger workers was that many older workers decided to retire later and work longer hours, freeing up fewer opportunities for those just stepping into the labor force.
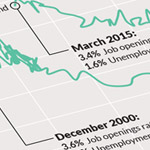
Capturing the onset of the coronavirus recession, March’s JOLTS data show that the quits rate dropped from 2.3 percent in February to 1.8 percent in March—the largest month-to-month decline since the start of the series, in December 2000—and dropped further to 1.4 percent in April. The quits rate rebounded to 1.9 percent in June, but continues to be far below its pre-recession level. (See Figure 1.)
Figure 1
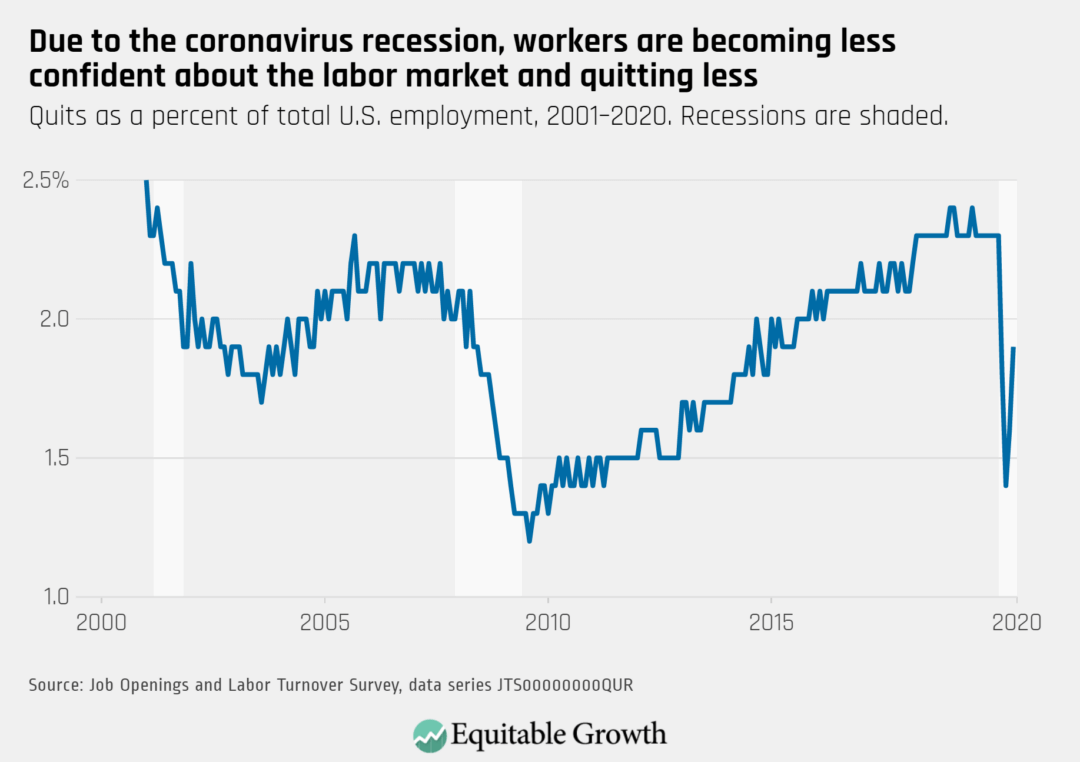
Compared to the Great Recession, however, the initial drop in the quits rate was small, relative to the massive surge in layoffs. That the quits rate did not drop down further is likely a consequence of the coronavirus health crisis: Unlike previous downturns, more workers have had to leave their jobs over health concerns or because of new caregiving responsibilities—work that falls heaviest on women in general and women of color in particular. By industry, the information sector—the industry in which workers are most likely to be able to work from home for pay—has seen the largest decline in its quits rate between February and June.
The ratio of unemployed workers to job openings
The ratio of unemployed workers per job opening is one of the measures economists use to determine how “tight” the labor market is. A low ratio means there are few job-seekers and many vacancies, demand for workers is strong, and the U.S. labor market is operating near full-employment. A tight labor market therefore shifts the bargaining power in favor of workers and, according to economic theory, spurs wage growth, since employers have to make better offers in order to compete for workers.
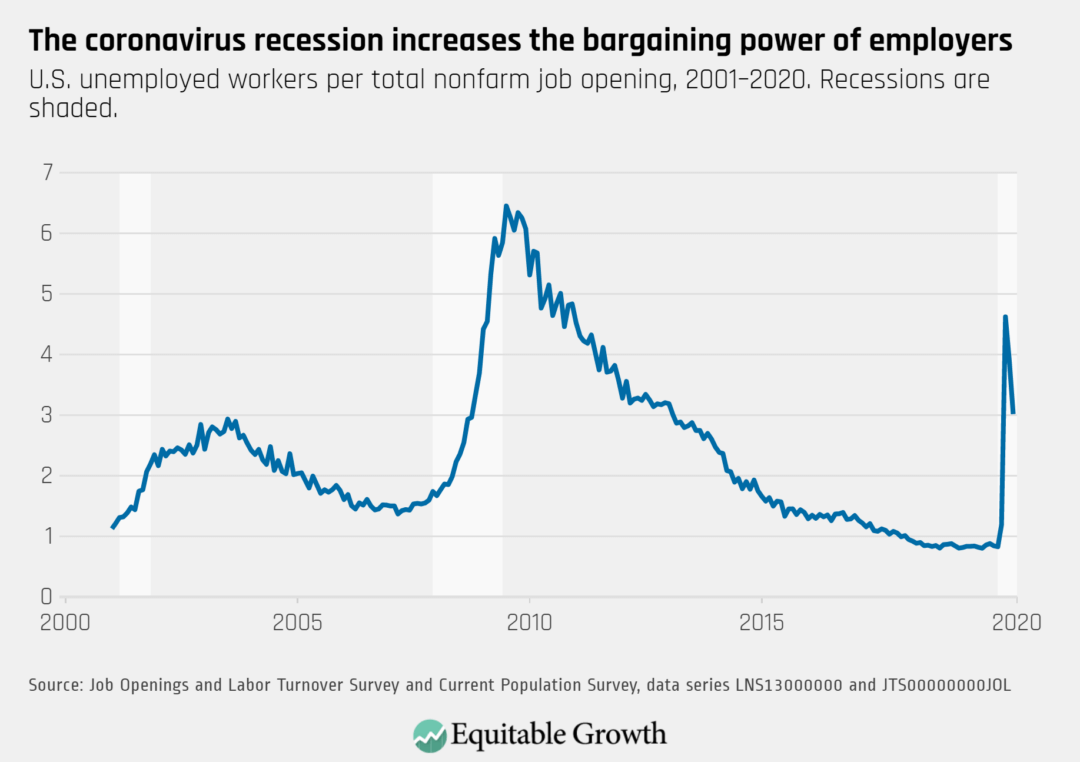
During the Great Recession and its immediate aftermath, the U.S. unemployed-to-job-openings ratio surged, reaching a high of more than 6.4 jobless workers for every job opening in July 2009. The ratio returned to its pre-crisis level in mid-2015, and by early 2018, there were fewer unemployed workers looking for a job than there were job vacancies for the first time since JOLTS data have been available.
But even as the unemployed-to-vacancies ratio reached a series low, wage growth remained slower than expected. The relationship between unemployment, job openings, and wage growth was weaker than in previous booms, sparking a debate among economists, with some researchers arguing that the labor market was not as strong as the jobless rate suggested. The “wage growth puzzle” has big implications for the U.S. economy, suggesting that the labor market has to be very tight before workers start seeing significant wage gains. This is particularly true for Black workers because their earnings are more responsive to fluctuations in the labor market.
When the coronavirus recession hit the U.S. economy and the unemployment rate skyrocketed, there were more unemployed workers in March than vacancies for the first time since February 2018. By June, there were three jobless workers for every job opening. (See Figure 2.)
Figure 2
The vacancy yield
Also called the job-filling rate, the vacancy yield captures the number of hires in a given month per the number of job openings at the end of that same month. In a strong labor market, there are more job openings, fewer job-seekers, and businesses find it harder to turn their open positions into hires. Conversely, downturns make it easier for employers to fill their vacancies.
Similar to previous downturns, during the Great Recession of 2007–2009, the vacancy yield surged. As many newly unemployed workers competed for few available jobs, employers filled their openings quickly. But in the recovery from the 2007–2009 downturn, the job-filling rate dropped more than in previous recoveries, with some economists proposing that the process by which workers and employers match to turn a job opening into a hire somehow became less efficient.
For instance, Jason Faberman of the Federal Reserve Bank of Chicago argues that a decline in employers’ recruiting intensity helps explain why the U.S. labor market was so slow to recover from the Great Recession. When hiring, employers can ramp up their recruitment efforts not only by posting job openings but also by lowering their hiring standards, spending more time and money on screening candidates, and offering higher wages and better benefits. A team of economists, for example, find evidence that during the 2007–2009 crisis, there was “opportunistic upskilling” as employers began requiring greater levels of experience and education from applicants.
Broken down by sector, researchers find that the leisure and hospitality industry played a major role in the aggregate drop in recruiting intensity during the Great Recession. This could be particularly damaging in the context of the coronavirus recession since this sector is both one of the largest employers in the U.S. economy and the industry that has suffered the greatest number of layoffs since March.
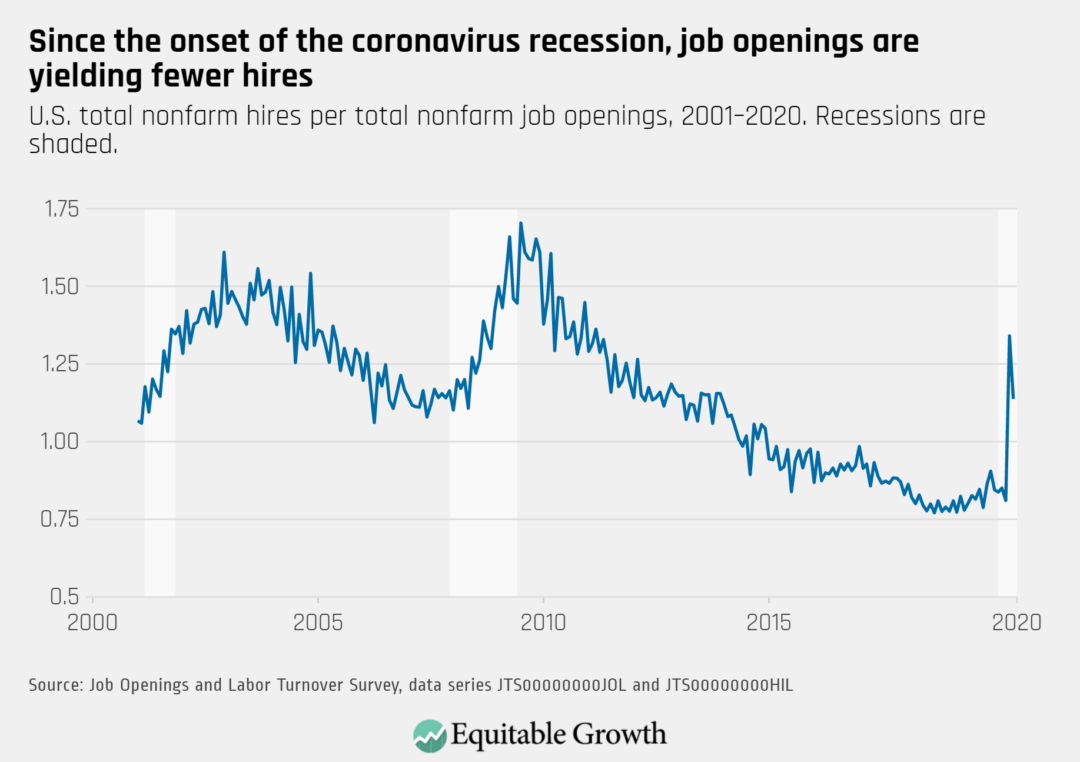
The vacancy yield climbed from 0.8 hires for every job opening in February to 1.1 hires per job opening in June. Despite anecdotal evidence that some businesses are having a hard time re-hiring workers, JOLTS data show that, at least at the aggregate level, employers are now filling their open positions faster than at any point since January 2014. In other words, there does not appear to be a shortage of willing workers, but rather a shortage of job openings. (See Figure 3.)
Figure 3
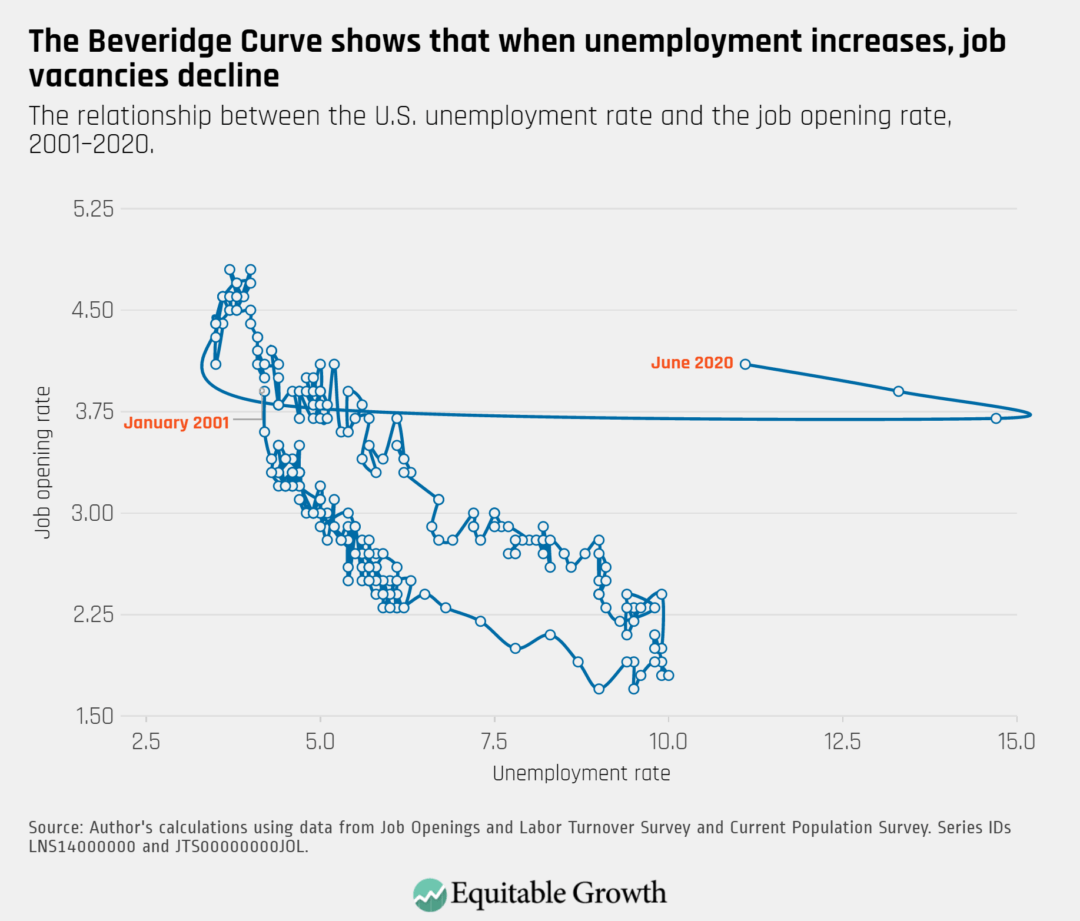
The Beveridge Curve
The Beveridge Curve maps the relationship between unemployment and job openings. It shows that when the job opening rate increases, the unemployment rate tends to fall. During economic downturns, the opposite happens: Unemployment rises, job openings decline, and the data points move along the curve down and to the right.
In the Great Recession of 2007–2009, this is exactly what happened. The unemployment rate increased, the vacancy rate fell, and the Beveridge Curve tracked the same path it followed in the 2001 recession. As the economy began to recover, however, the curve shifted, moving right and upward from its 2001–2007 recovery pattern. The shift meant that the increase in the job openings rate was not followed by a corresponding drop in the unemployment rate. Some economists worried that the way unemployed workers and open positions matched had become less efficient, while others argued it was a normal consequence of a particularly deep downturn.
The coronavirus recession has led to sharp movements in the Beveridge Curve. As the unemployment rate soared to 14.7 percent in April, the curve shifted to the right. Job openings also fell, but much less so. Even though the curve is now shifting back, generally, the decline of hiring plays a much bigger role in the rise of joblessness. So far, layoffs have led the way. (See Figure 4.)
Figure 4
Job search as a measure of the health of the labor market
A dynamic labor market, where workers are searching for and moving into new jobs that are a better match and higher quality, contributes to overall productivity and income growth and is a fundamental way to understand the health of the labor market. The economic literature on job search theory allows researchers to examine the extent to which “frictions”—or impediments to healthy labor market dynamics—influence unemployment rates, job vacancies, and wage levels. Where there are more frictions evident in job-search measurements, both employment levels and wage levels are lower since it is harder for workers to find a good job and bargain for higher wages, which we can predict by looking at the quits rate.
Job search theory has been a core component of understanding the extent of monopsony in the labor market. When the labor market is not dynamic, workers are not changing jobs in response to the ability to achieve higher wages, which enables employers to exploit these conditions and offer wages lower than would exist in a tight, competitive labor market. Research by Briggs Depew of Utah State University and Todd Sorensen of University of Nevada at Reno finds that so-called labor supply elasticity, or the extent to which workers are sensitive to wage changes, is lower in economic contractions, such as recessions, and higher in expansions. Lower labor supply elasticity in a downturn means that employers will have more wage-setting power, further exacerbating the downside impacts of a recession.
Conclusion
Economic shocks have short-, middle-, and long-term consequences for the way employers make hiring decisions, the confidence with which people move from job to job, and the opportunities available for workers to move up the career ladder and bargain for higher wages. As the coronavirus recession drives uncertainty for workers and employers, the downturn and policy choices aimed at reining it in will continue to have big implications not only for the number of jobs available, but for the quality of those jobs, too. JOLTS data will continue to give economists and policymakers alike a better bead on where the U.S. economy stands in all of these key data measurements.