Equitable Growth’s Jobs Day Graphs: July 2020 Report Edition
On August 7th, the U.S. Bureau of Labor Statistics released new data on the U.S. labor market during the month of July. Below are five graphs compiled by Equitable Growth staff highlighting important trends in the data.
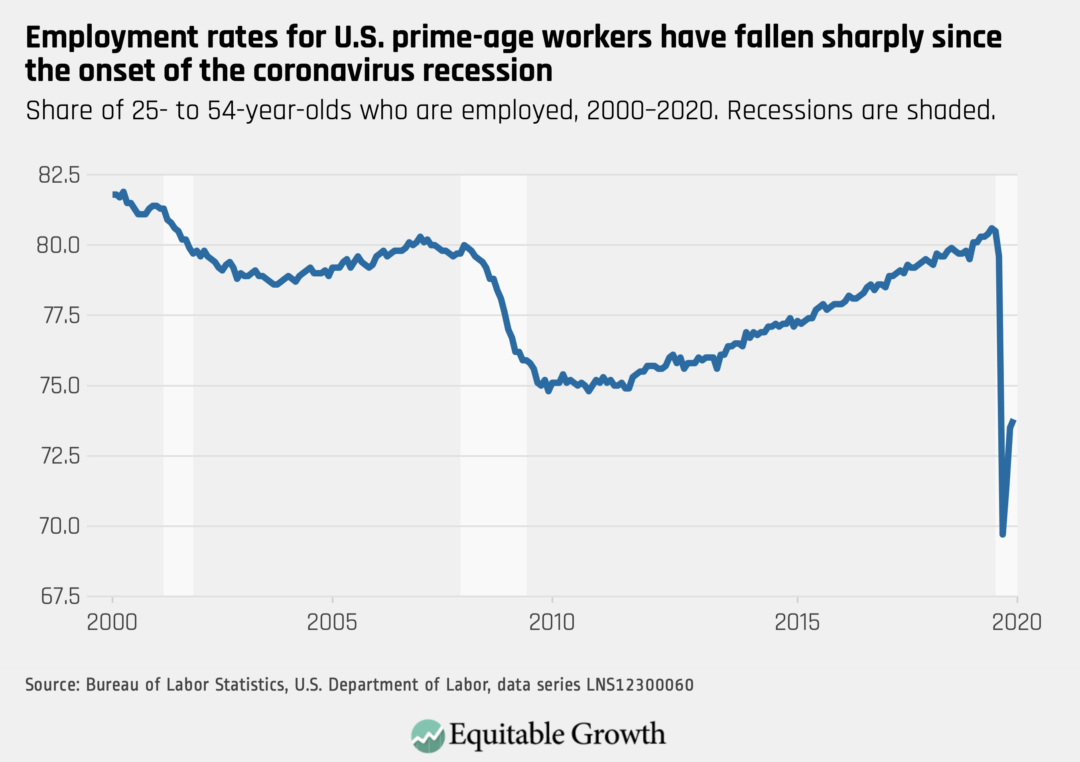
While the labor market added a relatively robust 1.8 million jobs in July, the prime-age employment-to-population ratio only increased slightly from 73.5% to 73.8%.
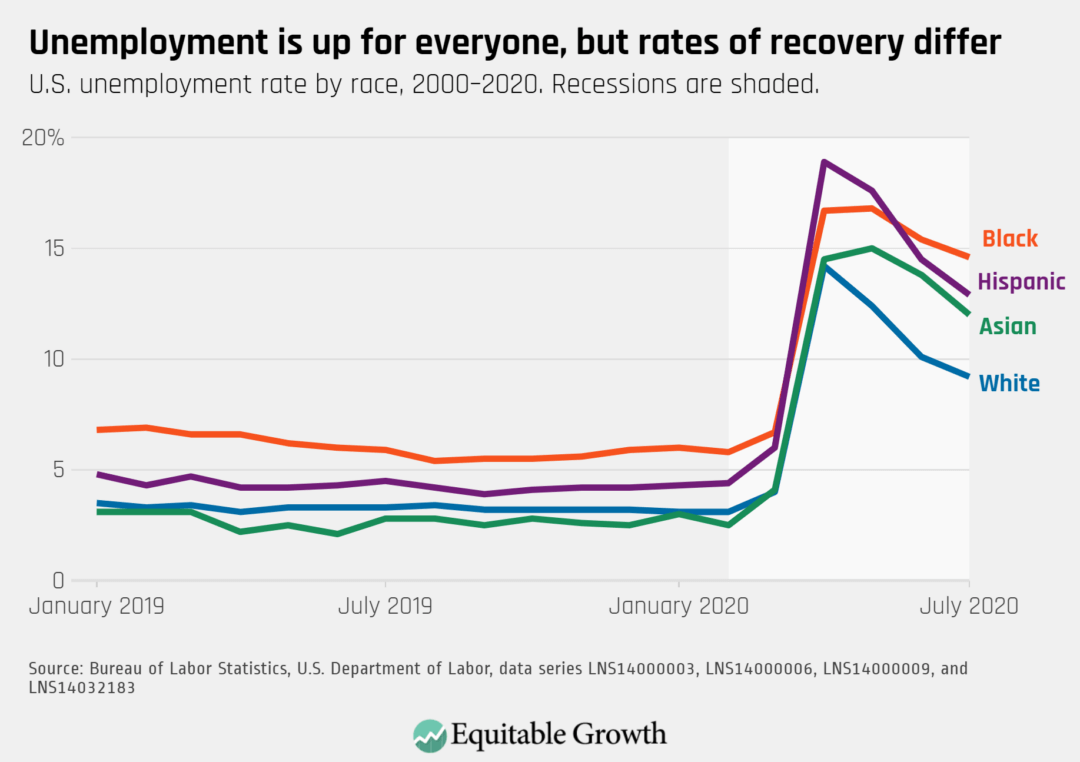
While unemployment rates have been declining for White, Hispanic, and Asian workers since May, the decline has been slower for Black workers, whose unemployment rate was at a high level of 14.6% in July.
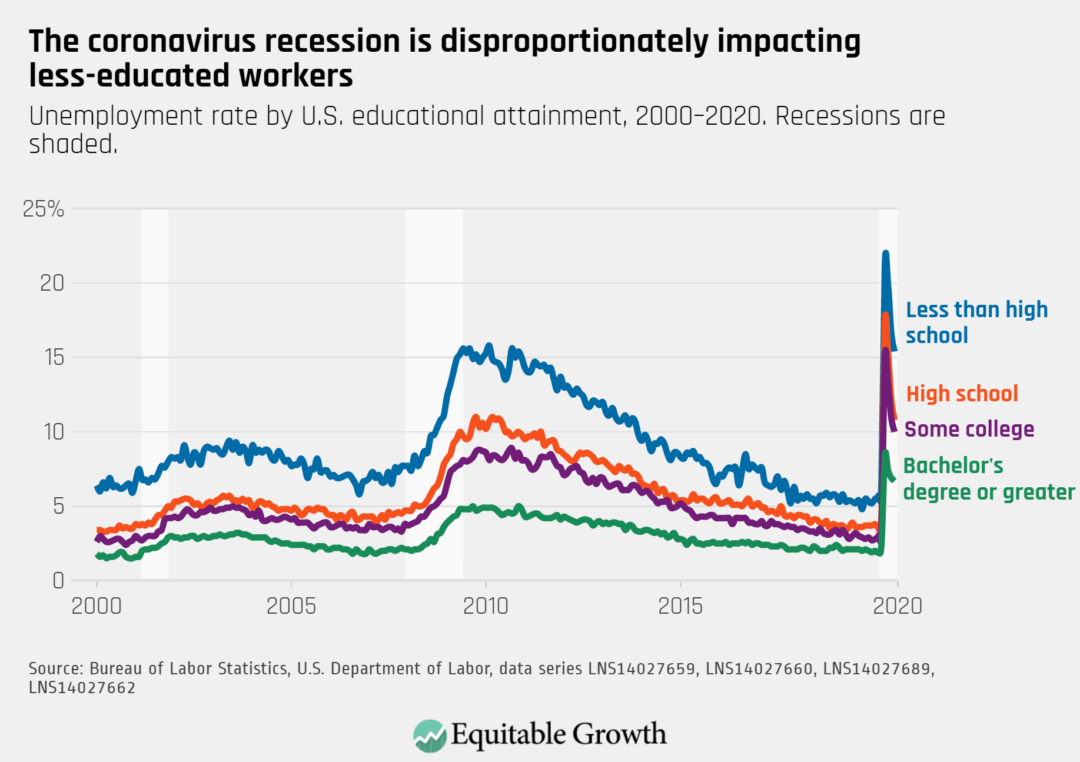
Unemployment rates continue to be higher for those with lower levels of education, but workers with a college degree experienced the smallest decline in unemployment in July at 10%, down from 10.9% in June.
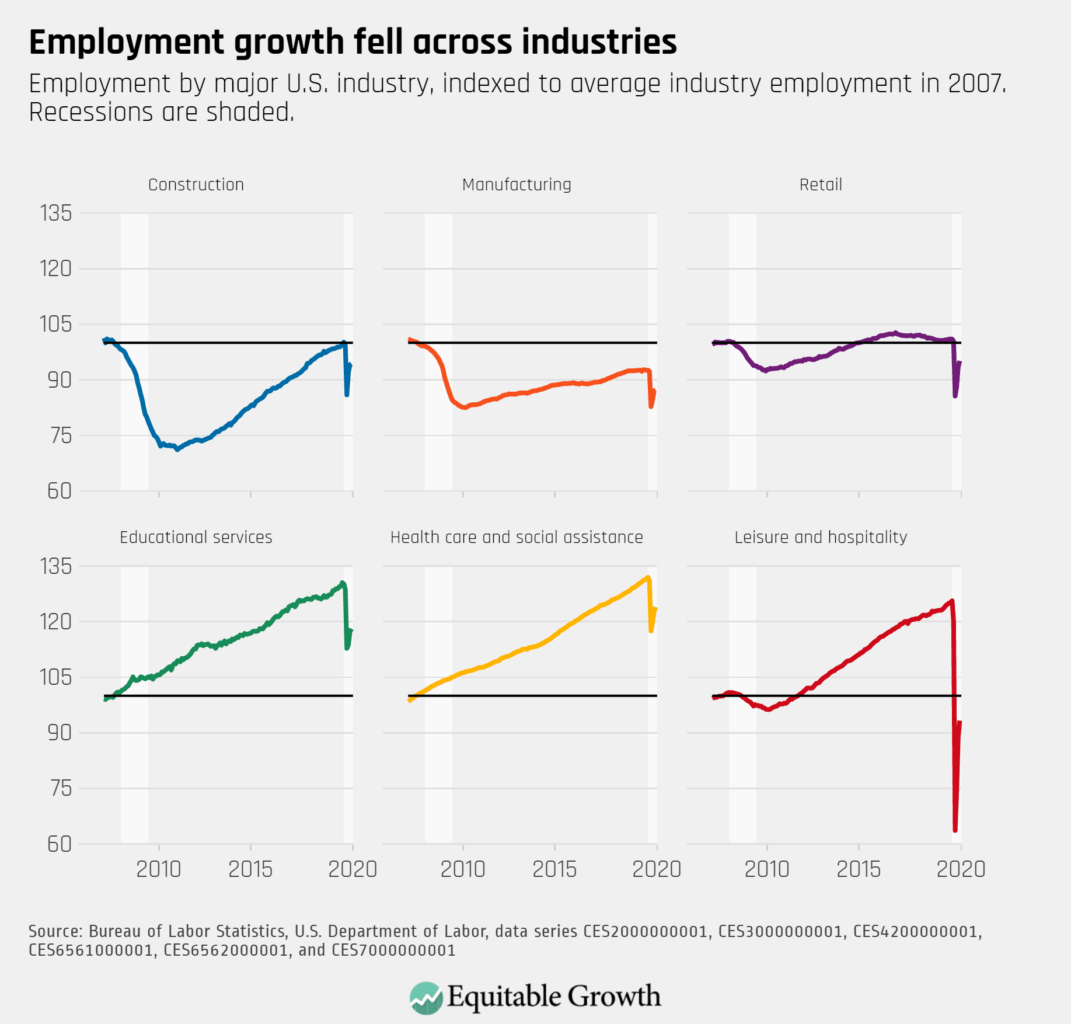
Despite the surge in coronavirus cases across the country, employment in leisure and hospitality led the increase in payroll employment, accounting for nearly one-third of jobs added in July.
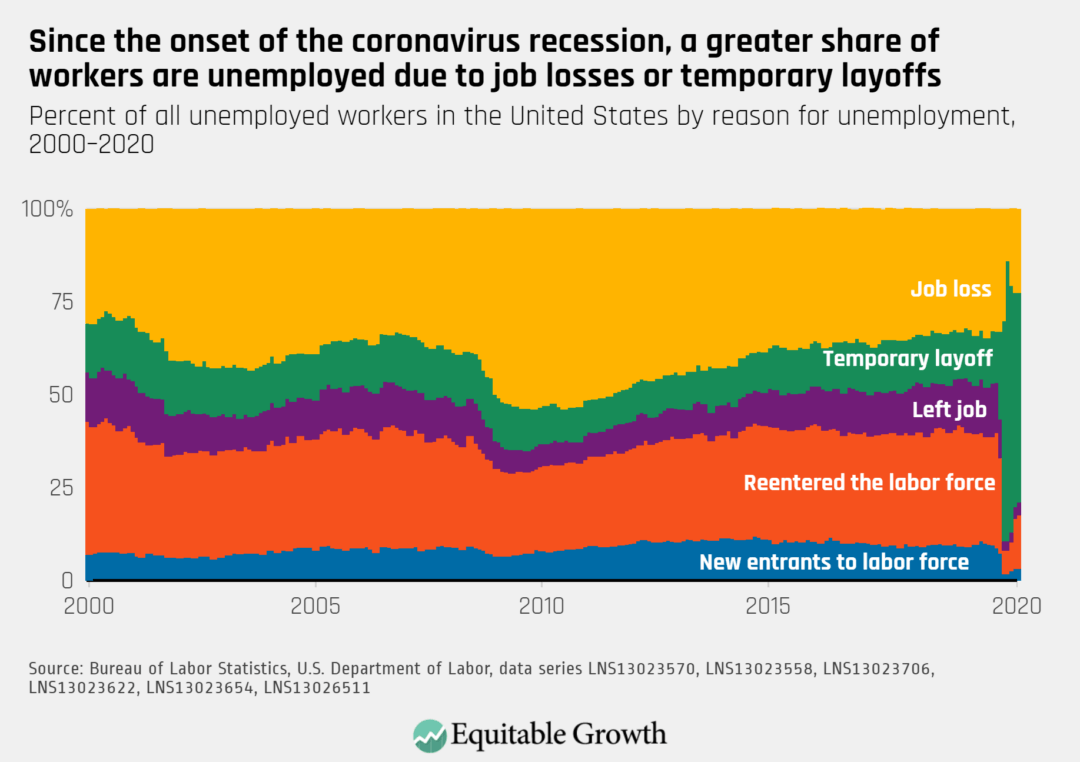
As unemployment decreased in July, the proportion of unemployed workers who have permanently lost their jobs remained steady, while the share of re-entrants to the labor force increased.