Equitable Growth’s Jobs Day Graphs: June 2019 Report Edition

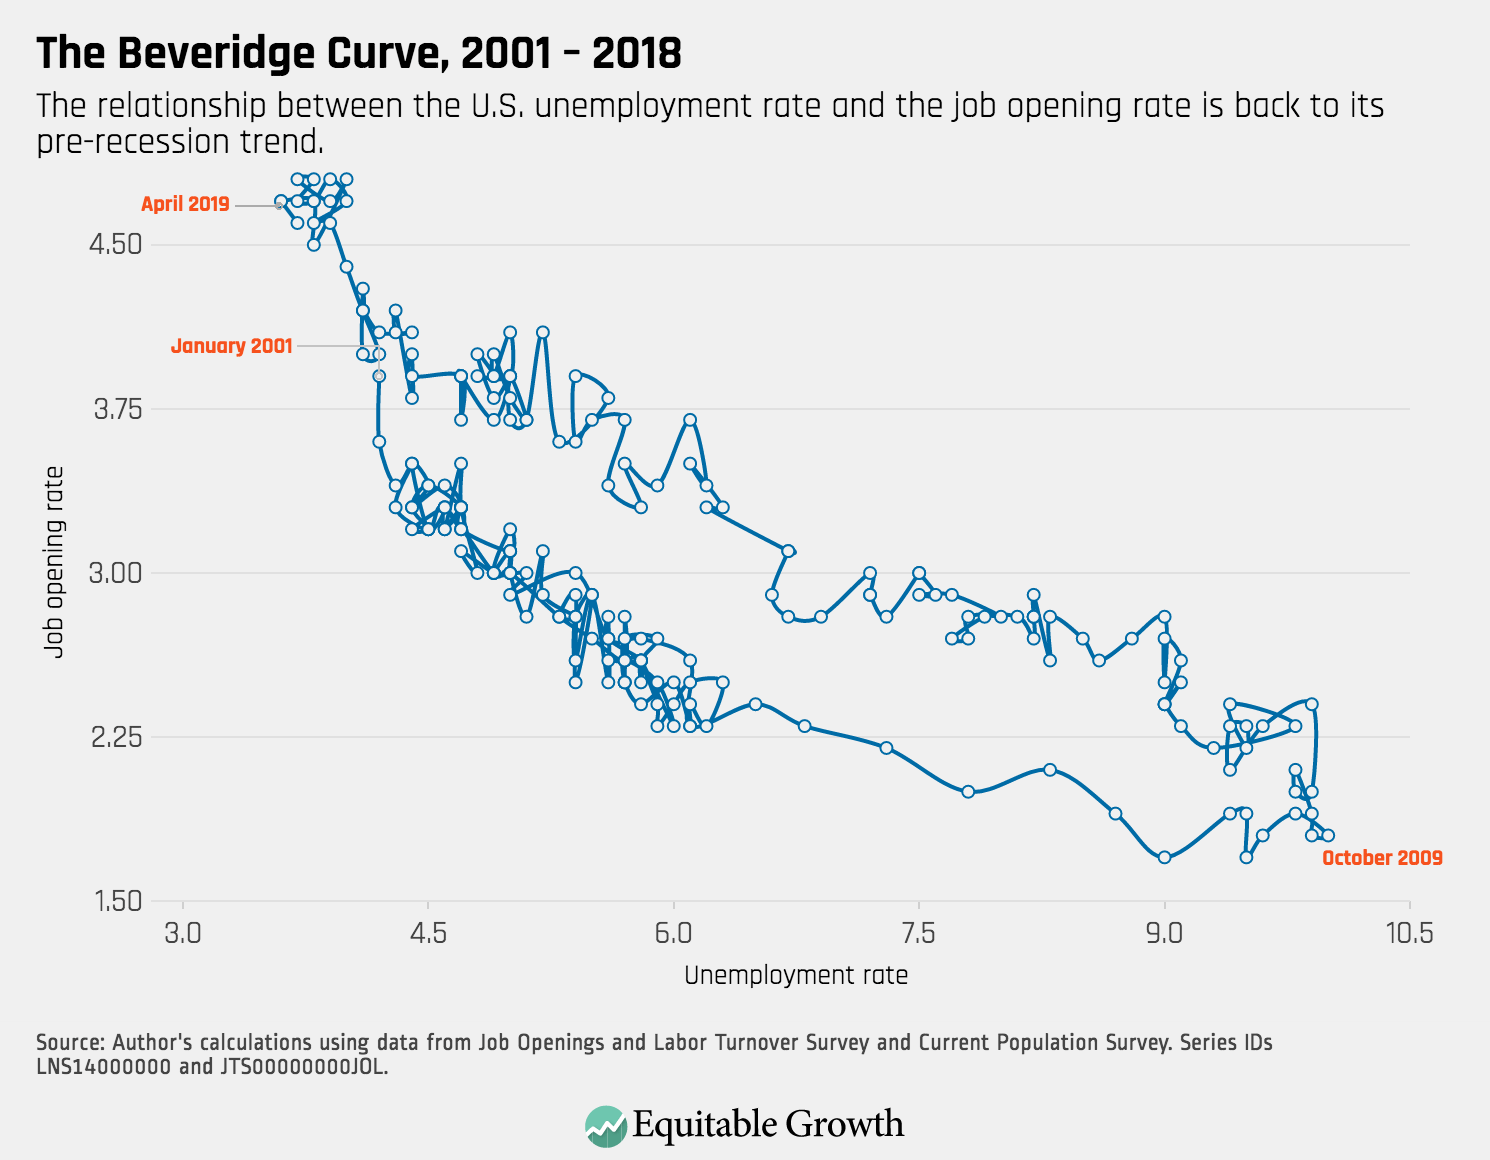
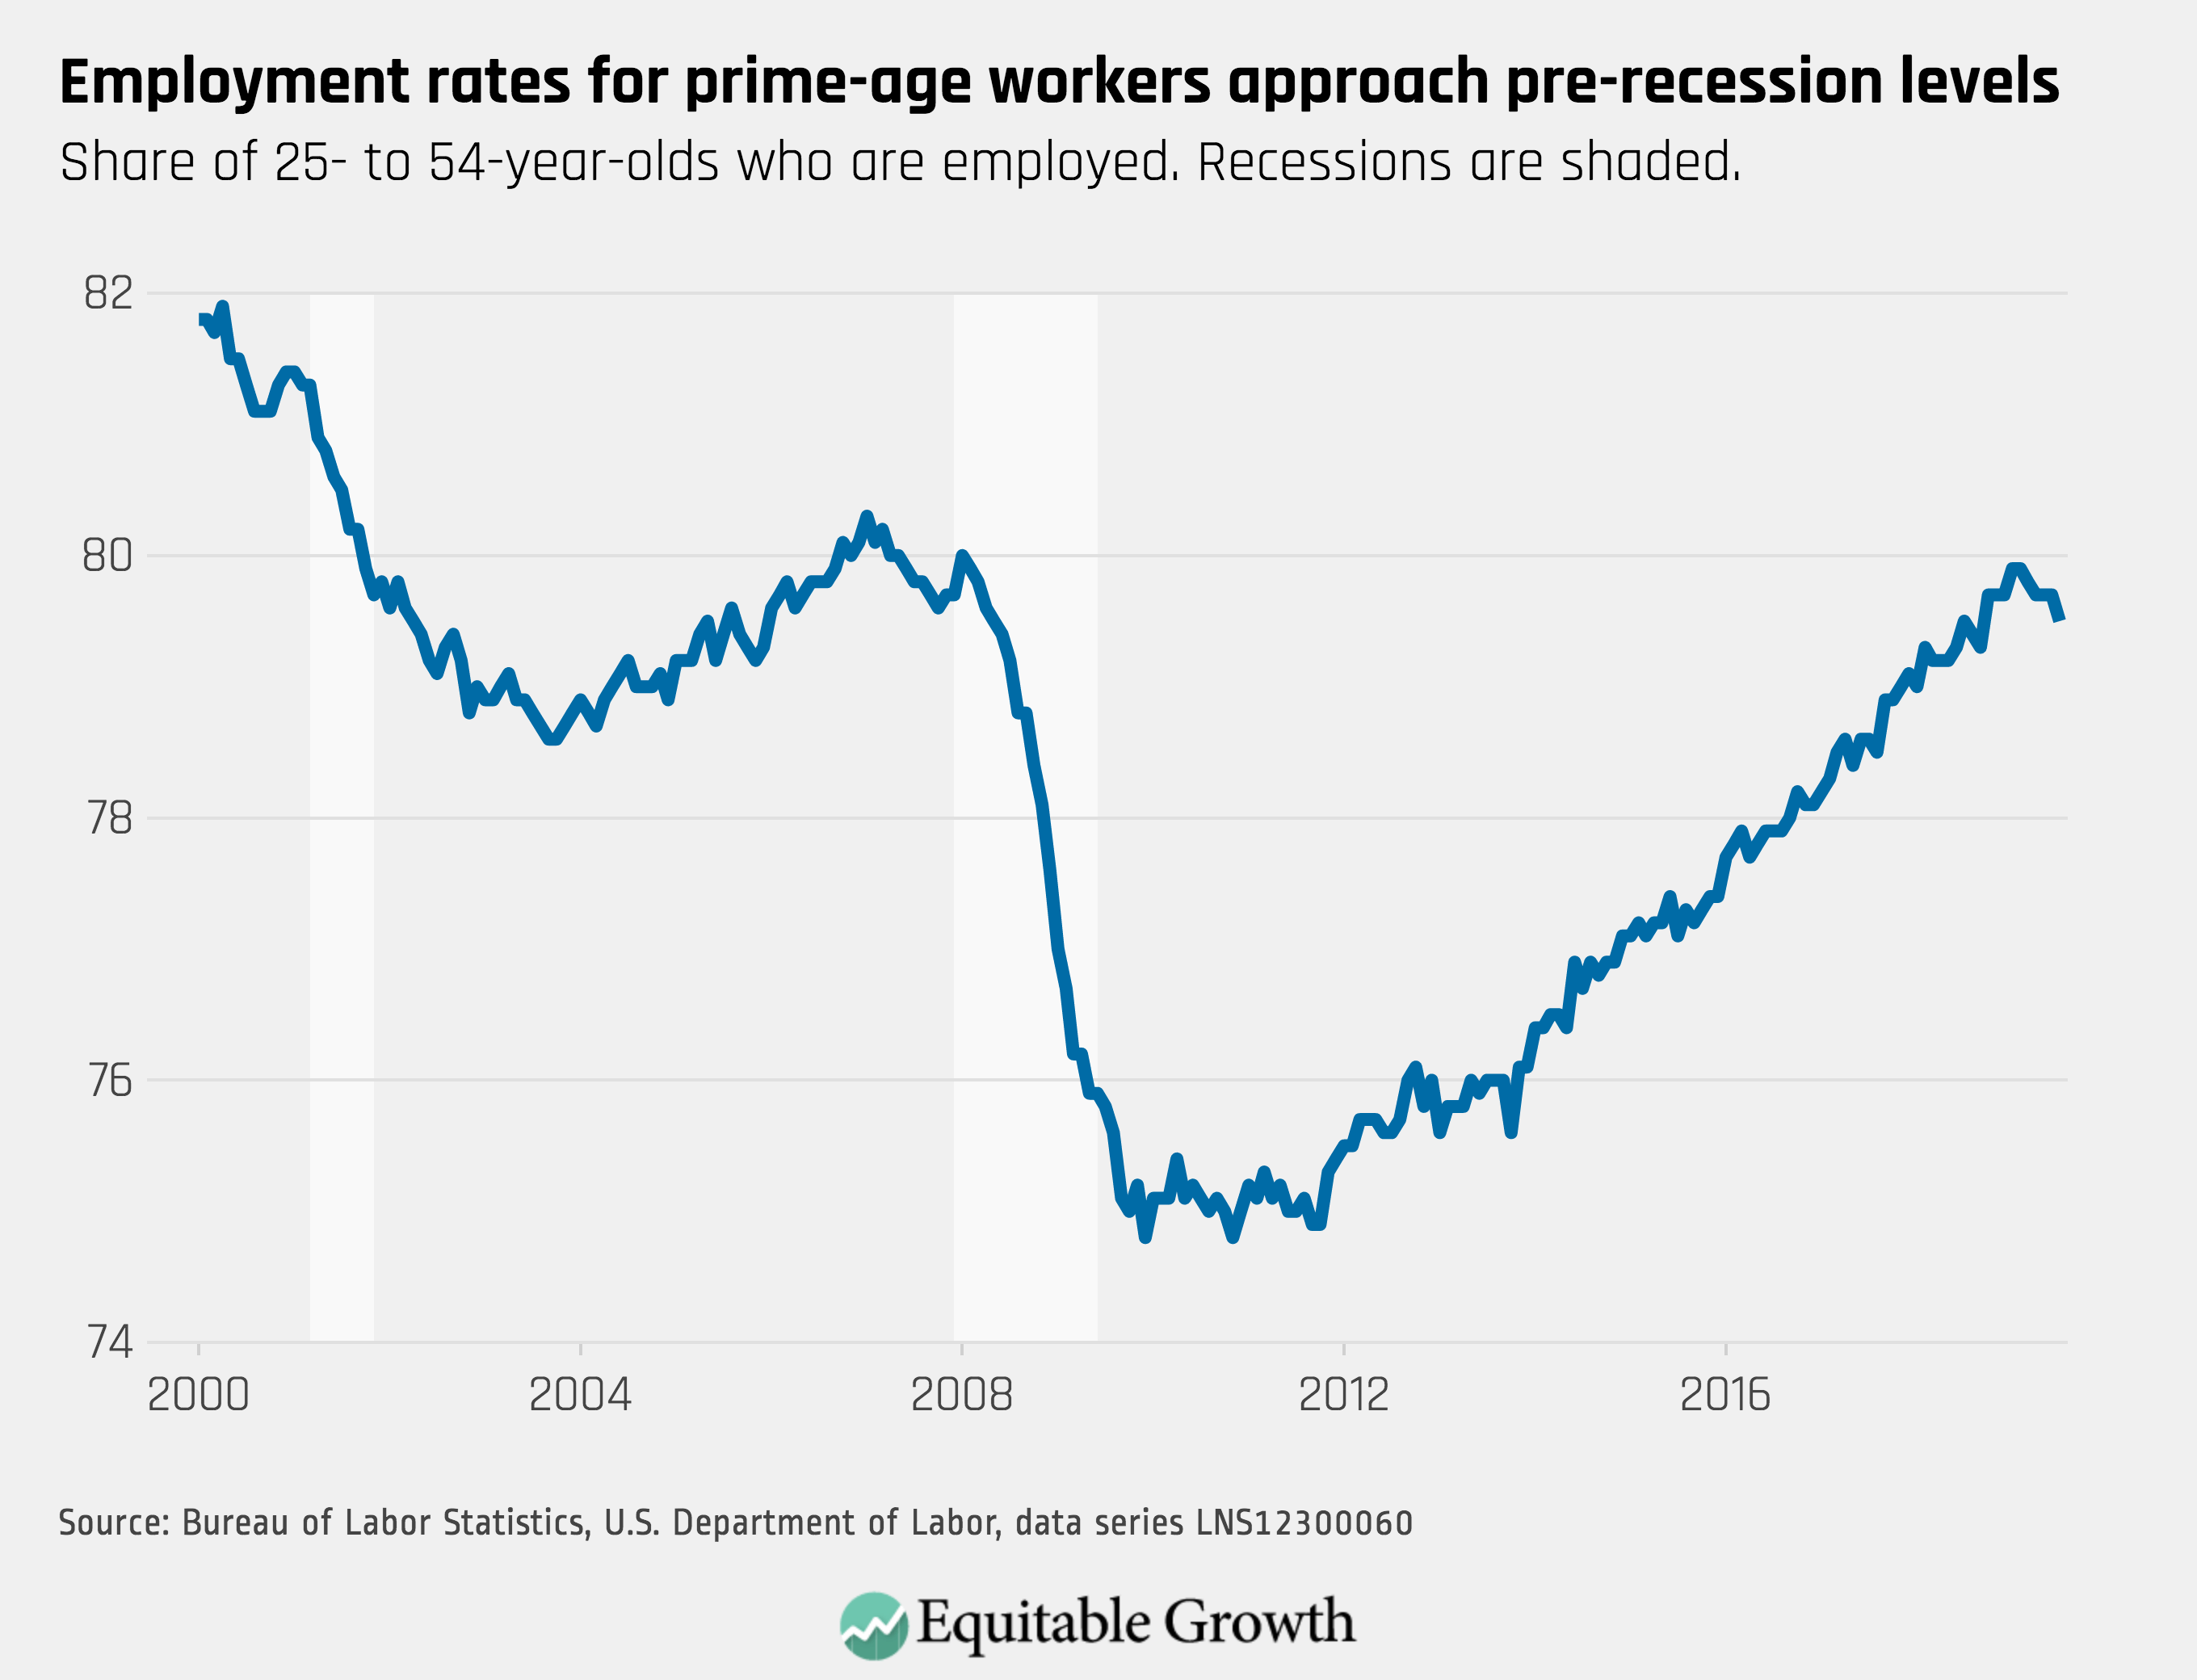
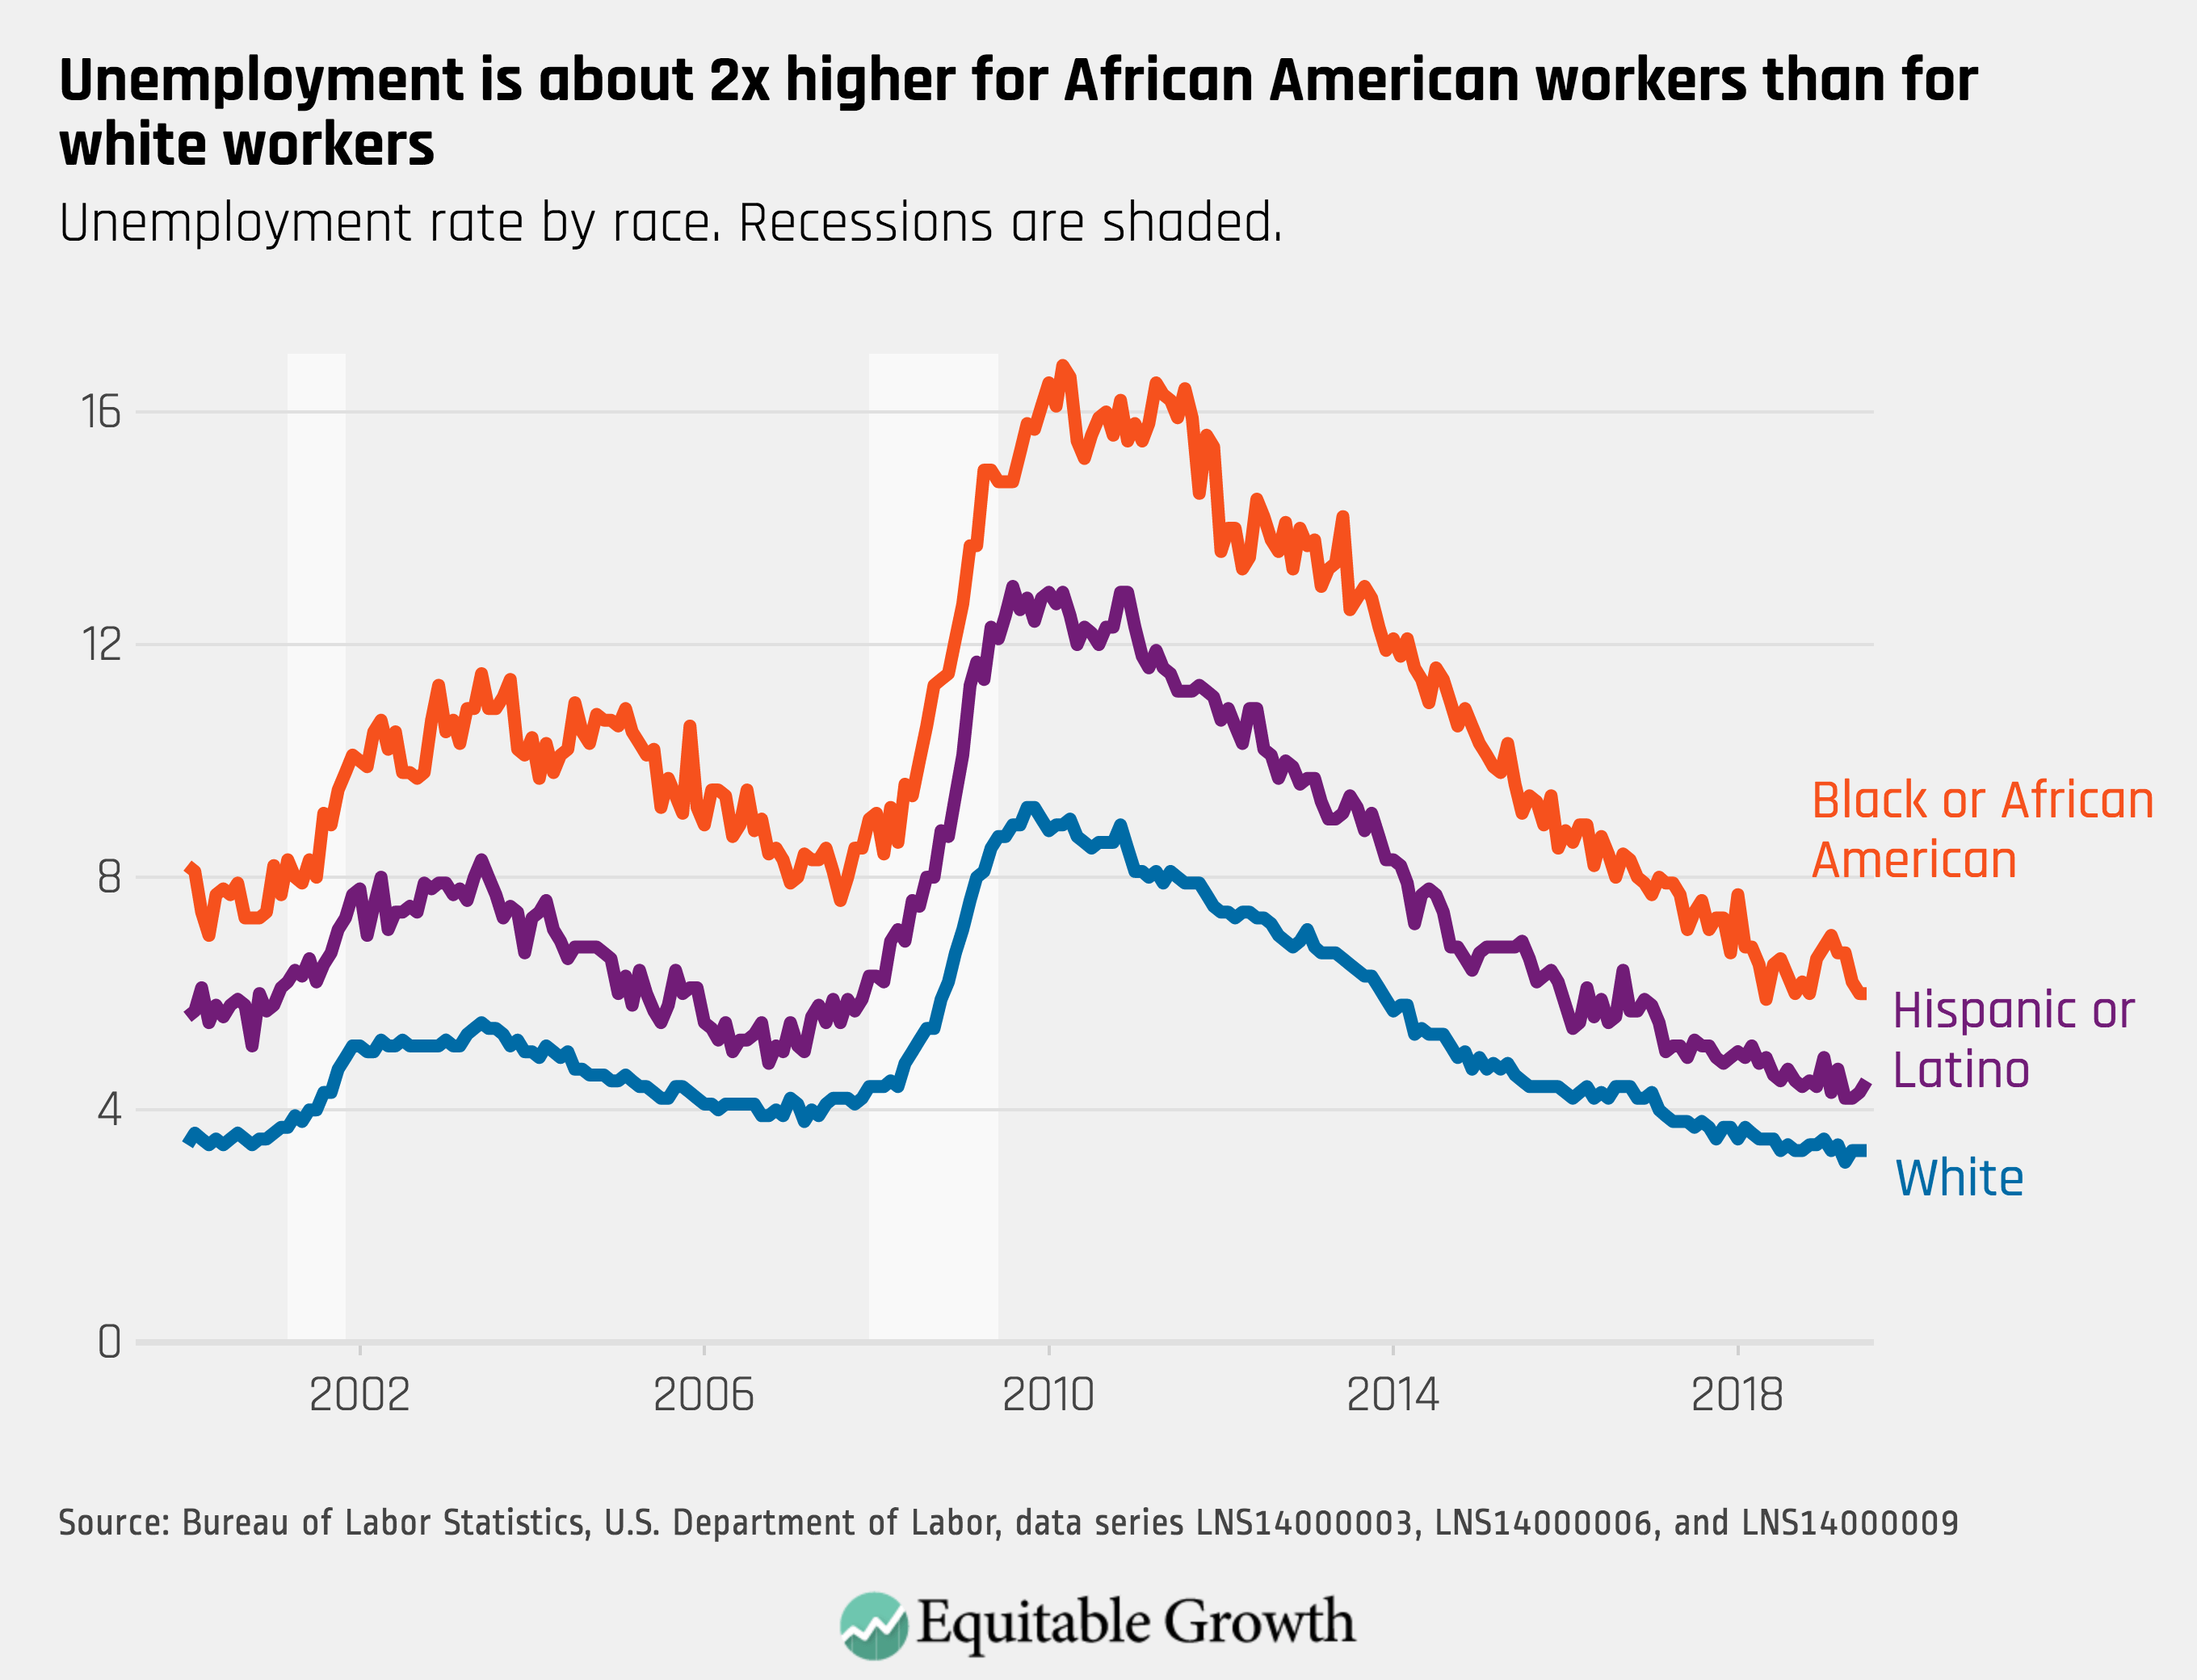
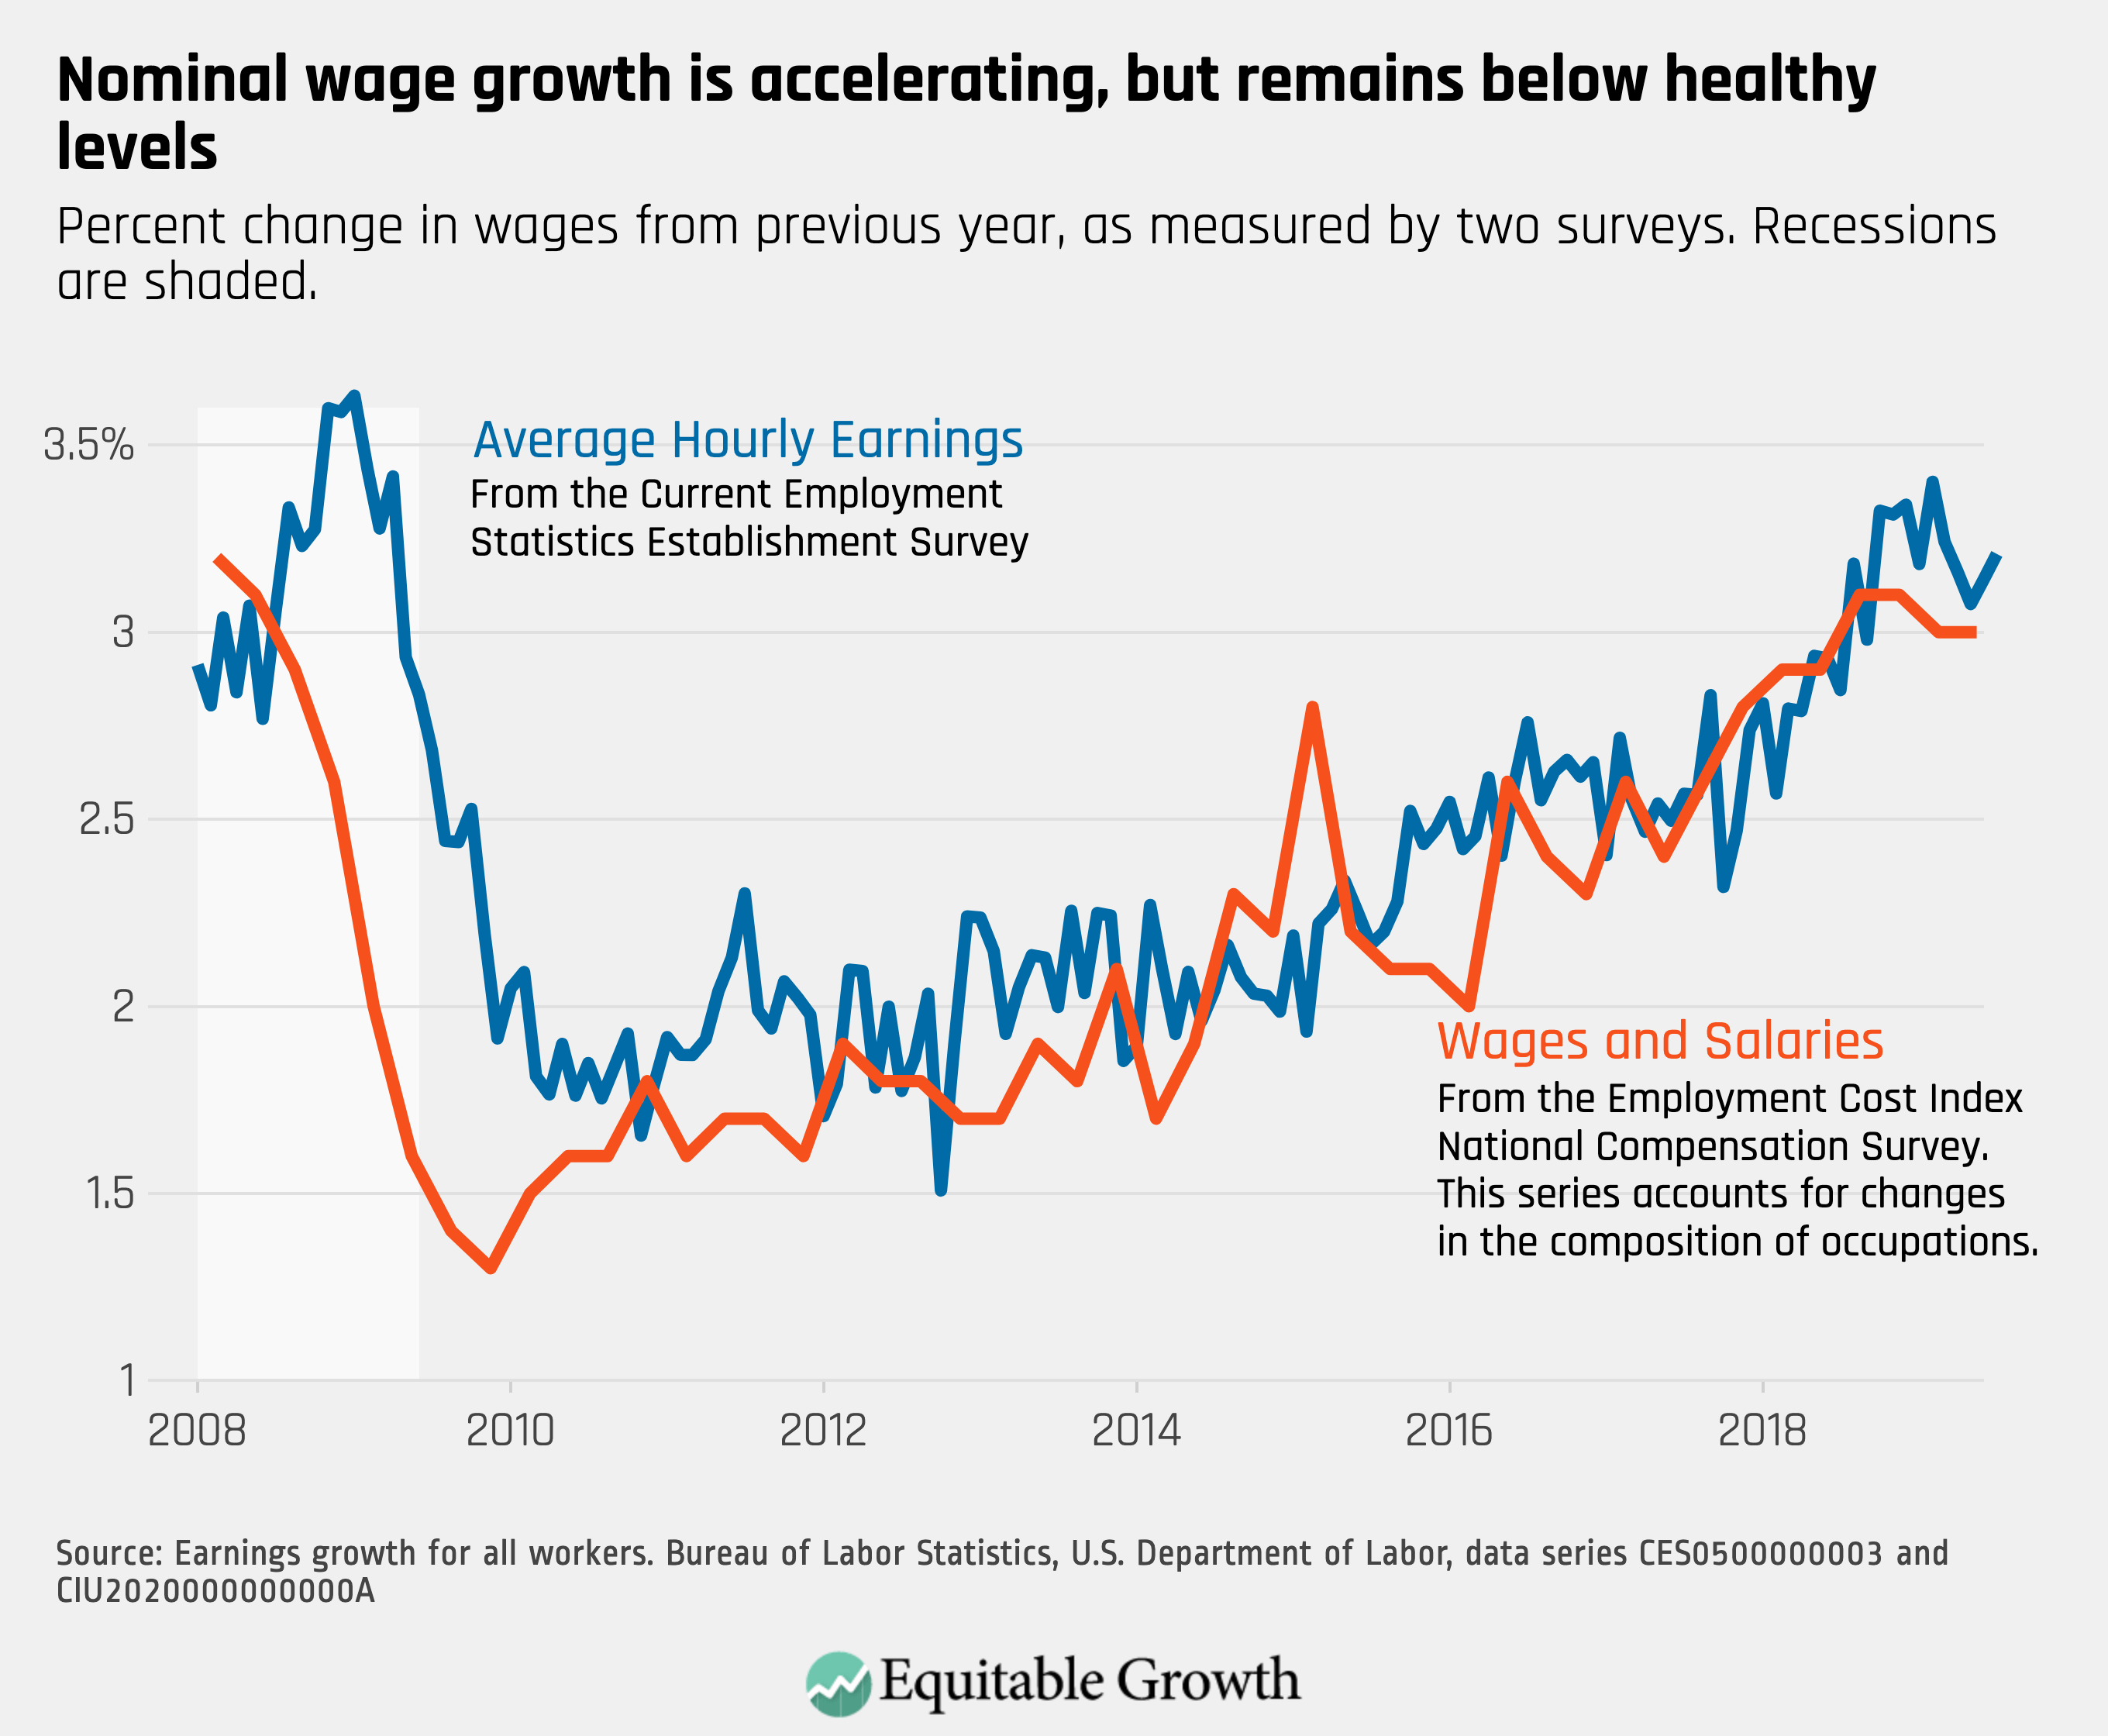
On July 5th, the U.S. Bureau of Labor Statistics released new data on the U.S. labor market during the month of June. Below are five graphs compiled by Equitable Growth staff highlighting important trends in the data.

1.

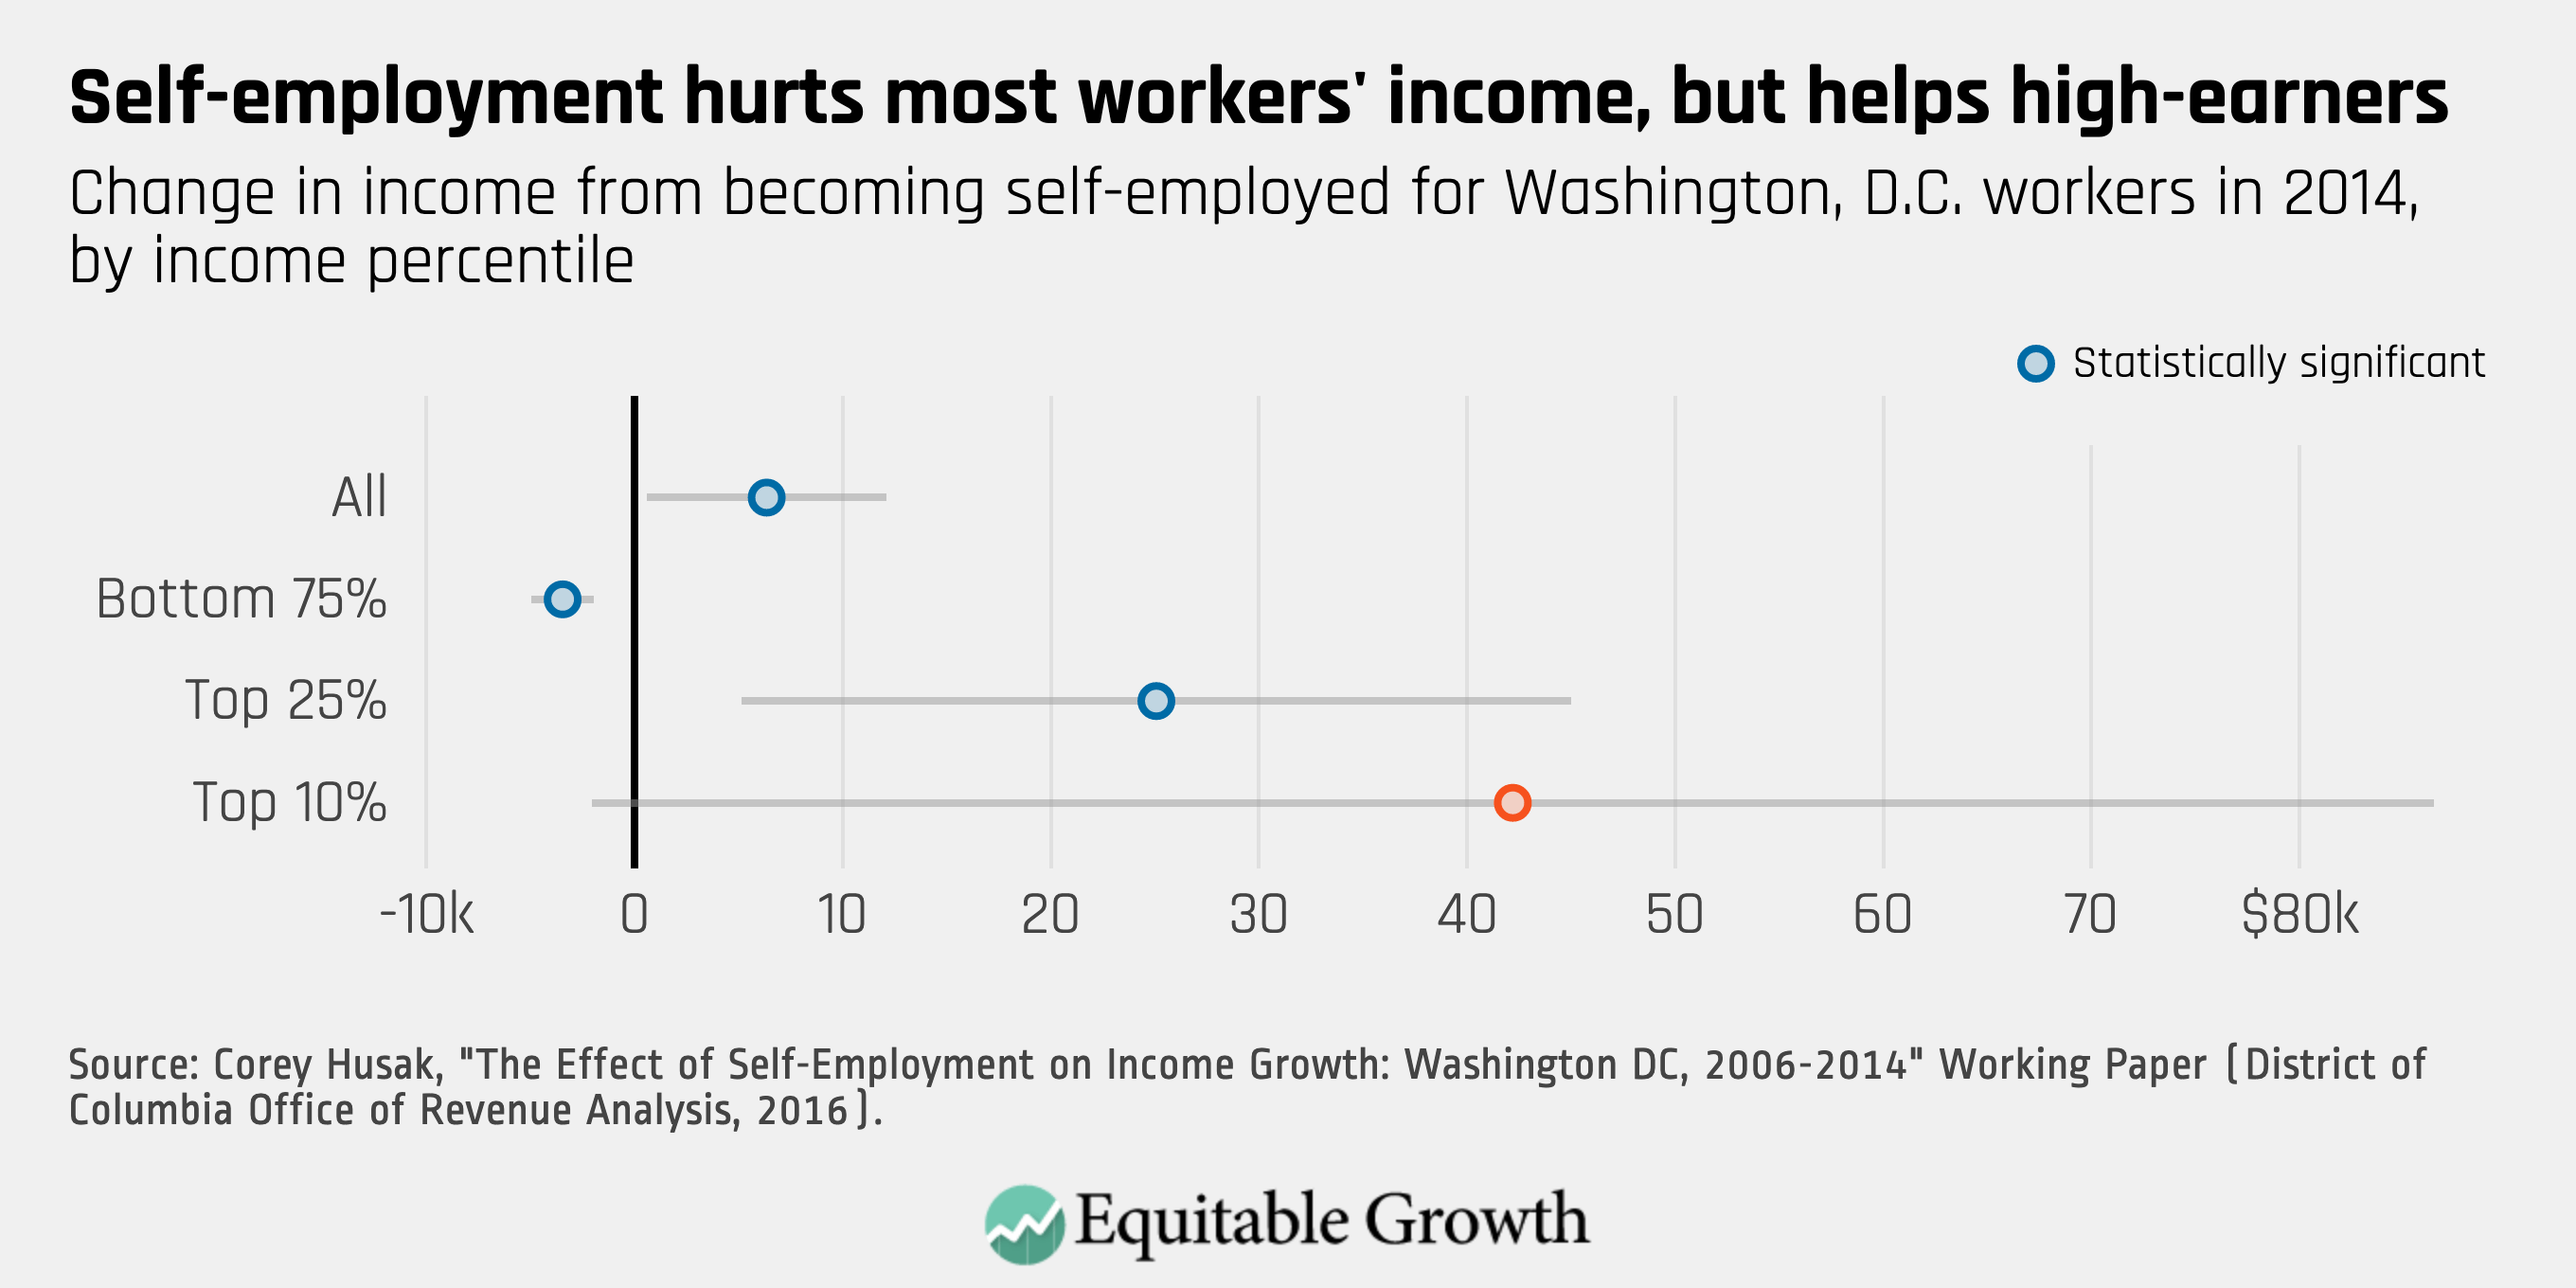
The prime-age employment rate has held at at 79.7% since April.

2.

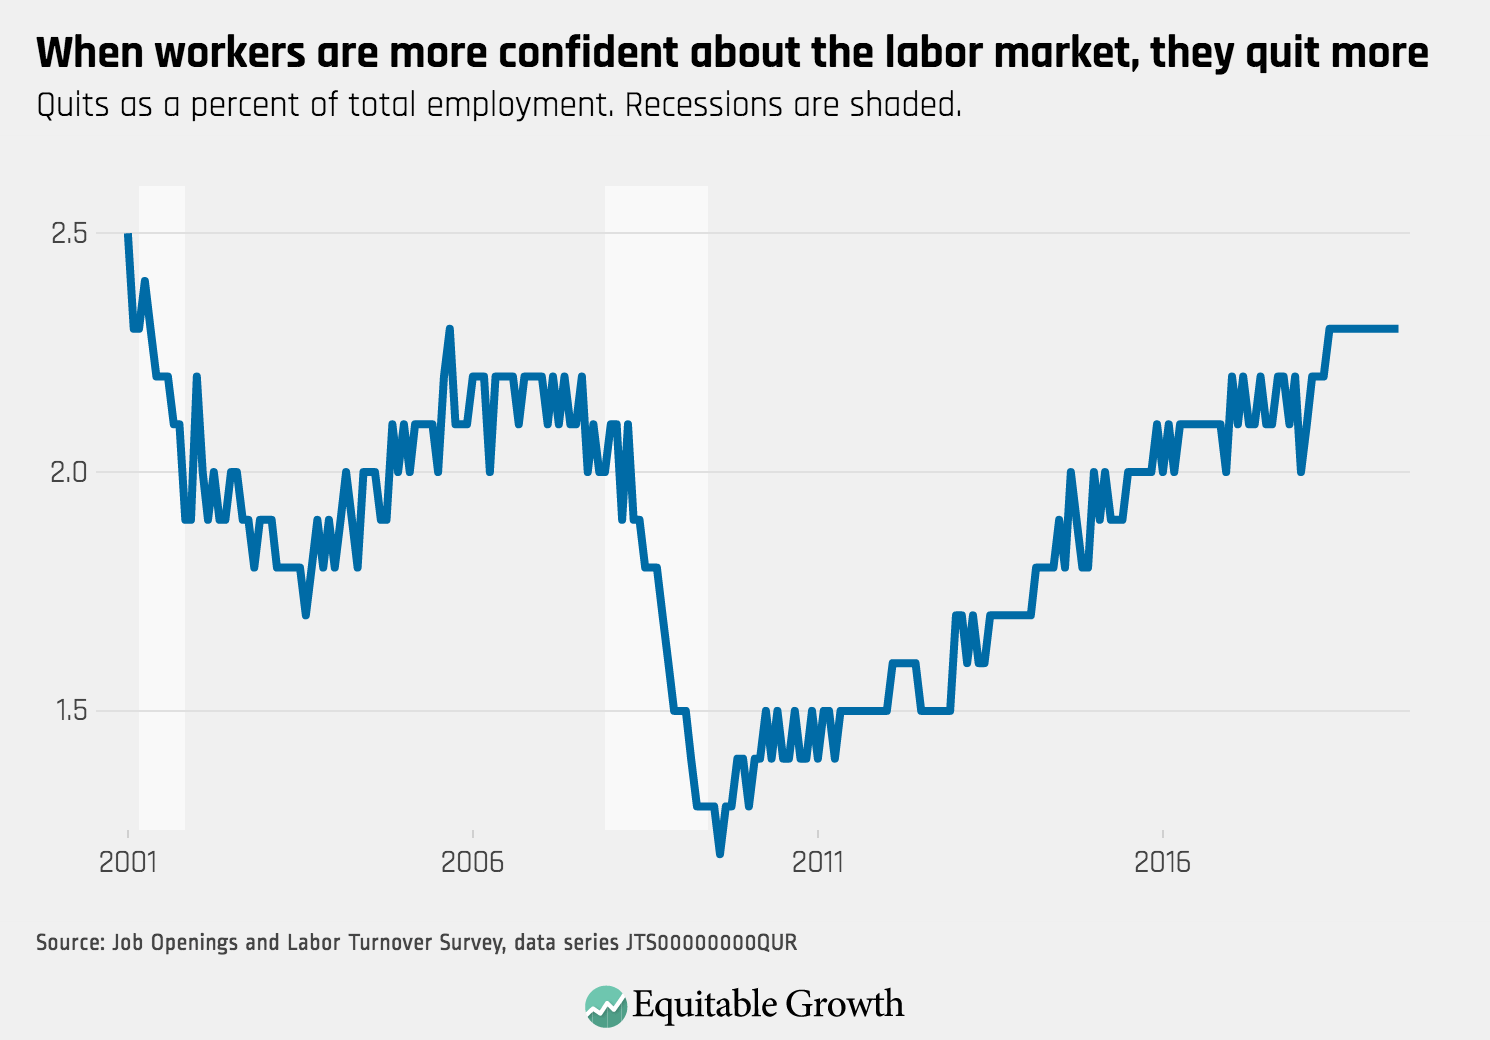
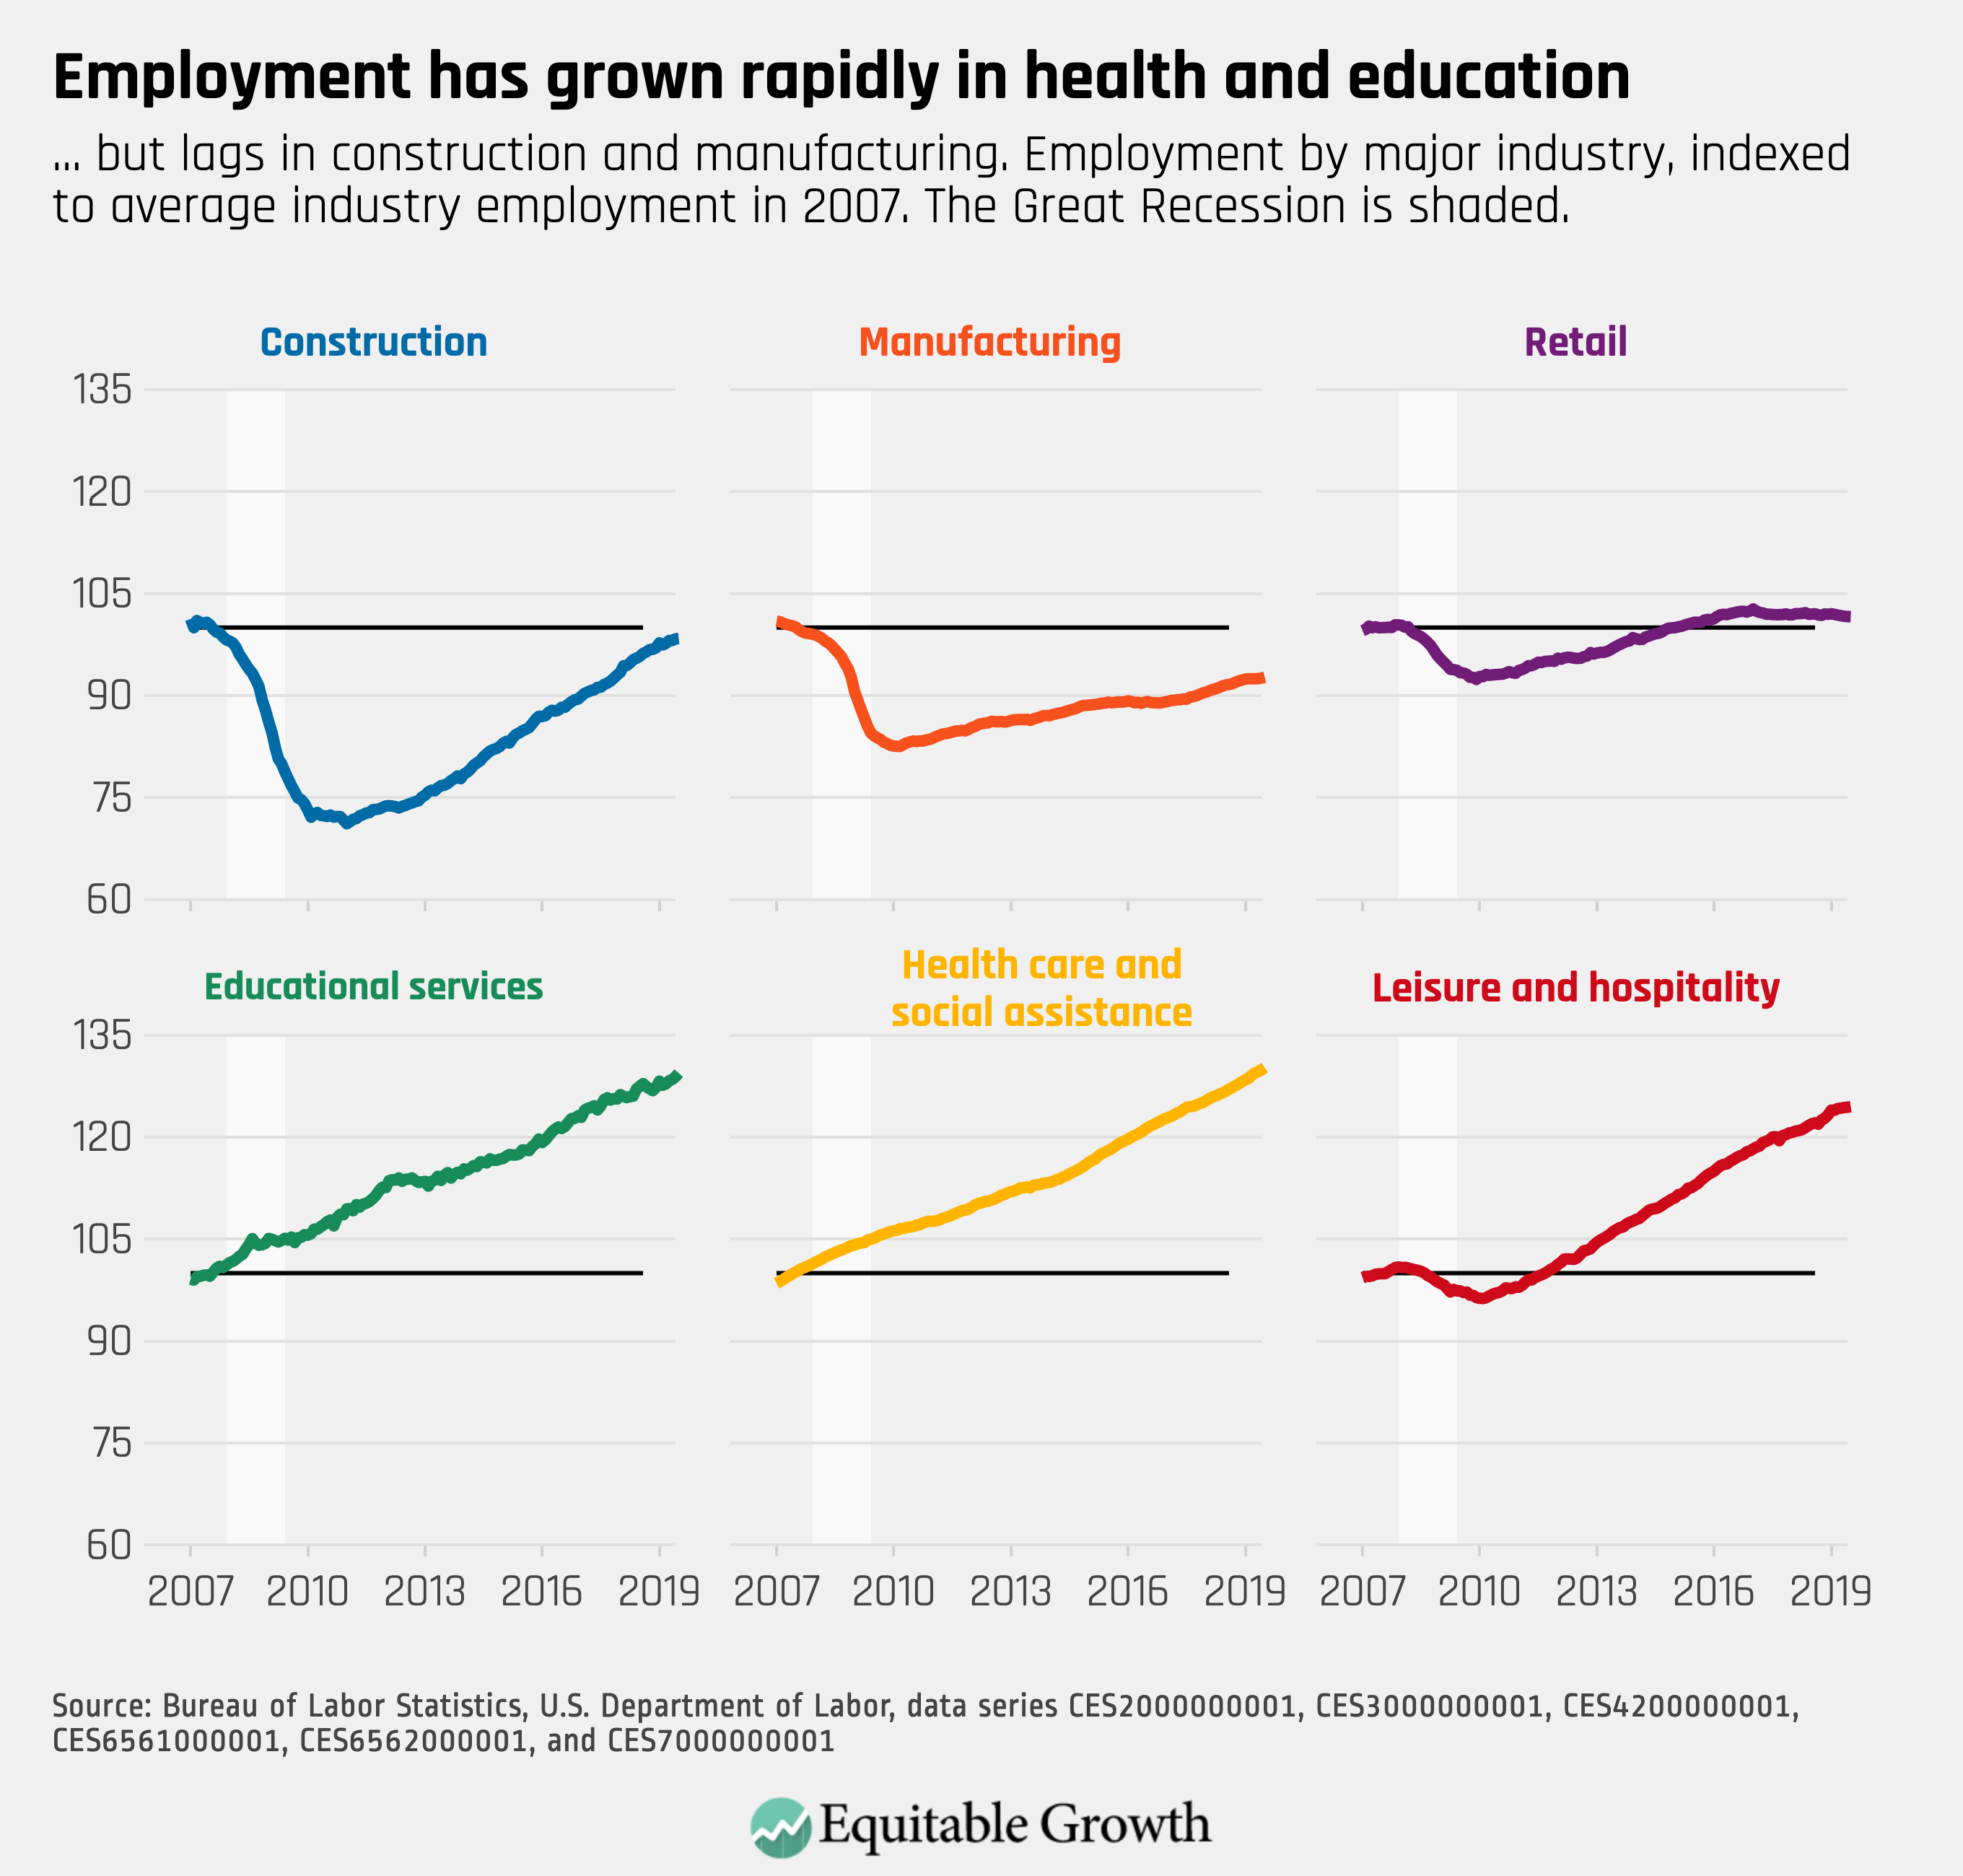
Employment in manufacturing and construction has recovered since the Recession, but remains lower than their levels prior to that.

3.

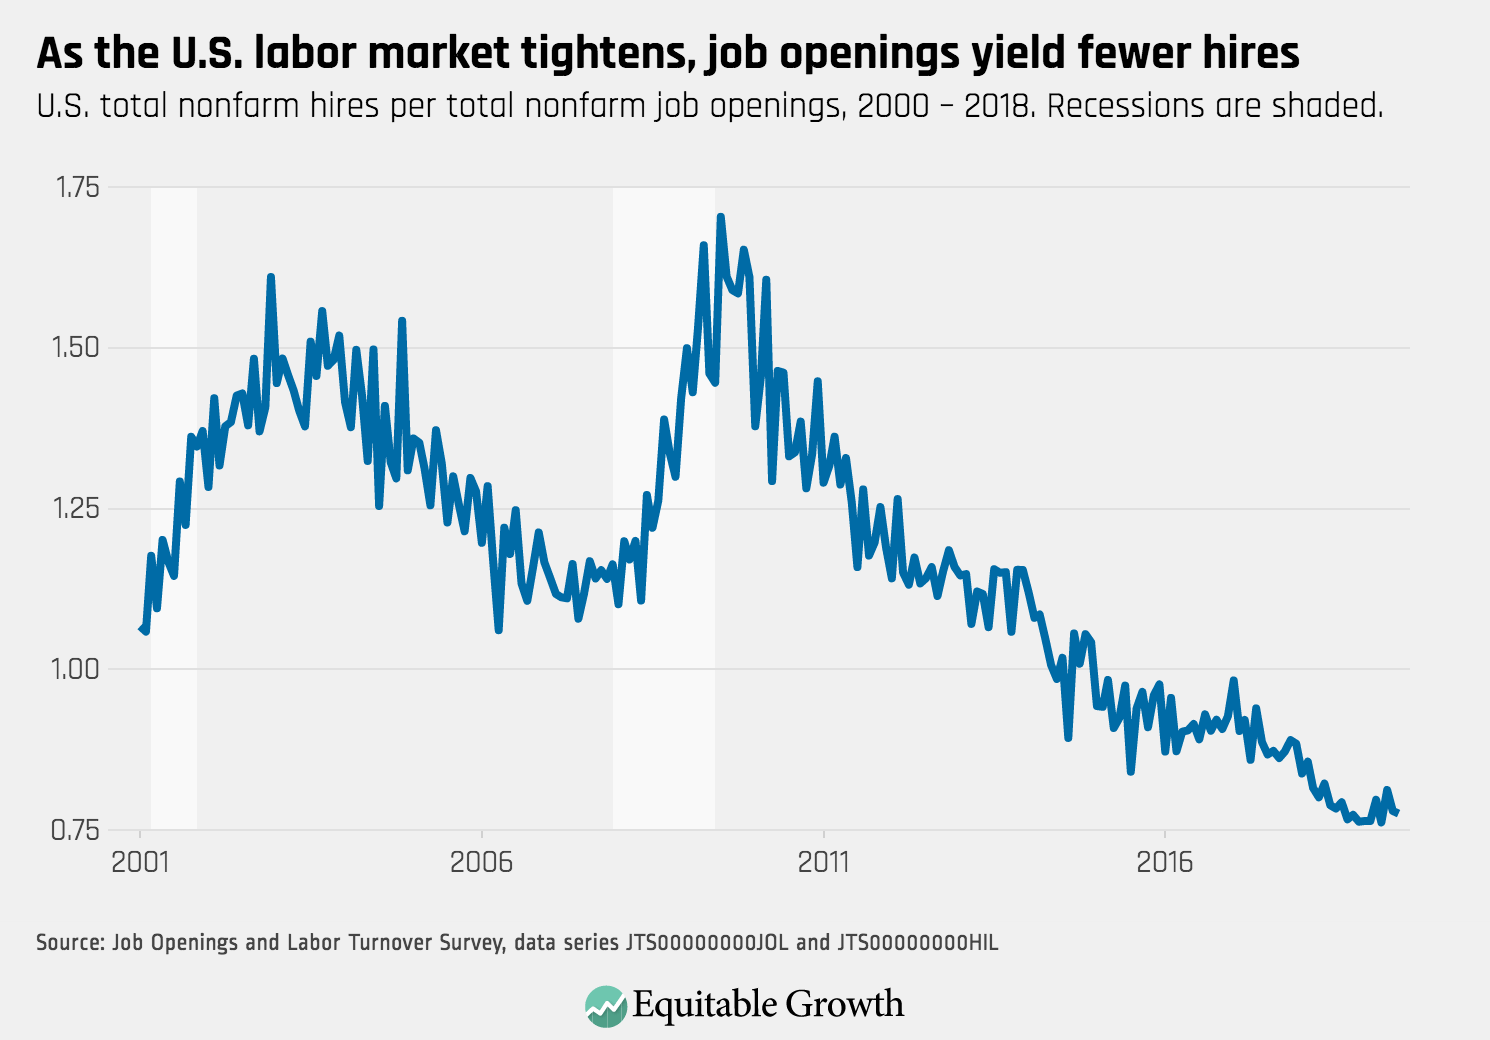
The unemployment rate for African Americans has trended downward since February, but remains nearly twice that of whites.

4.

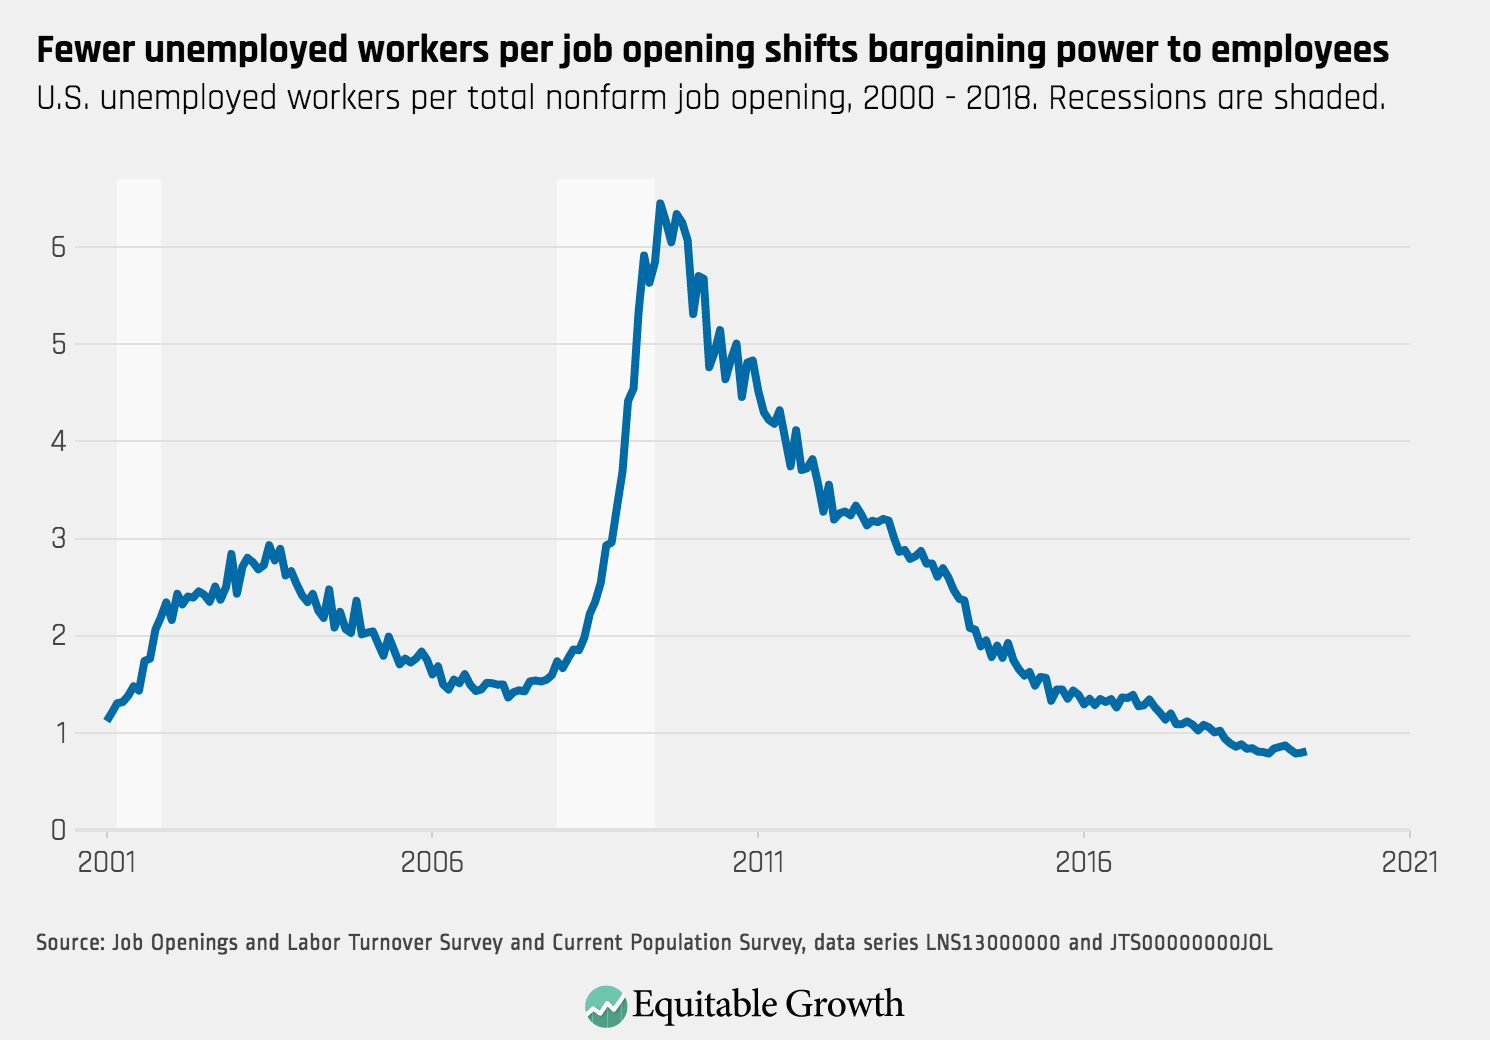
While the unemployment rate has changed little in recent months, increasing marginally to 3.7% in June, the broader U-6 measure, that includes marginally attached workers, continues to trend downwards.

5.

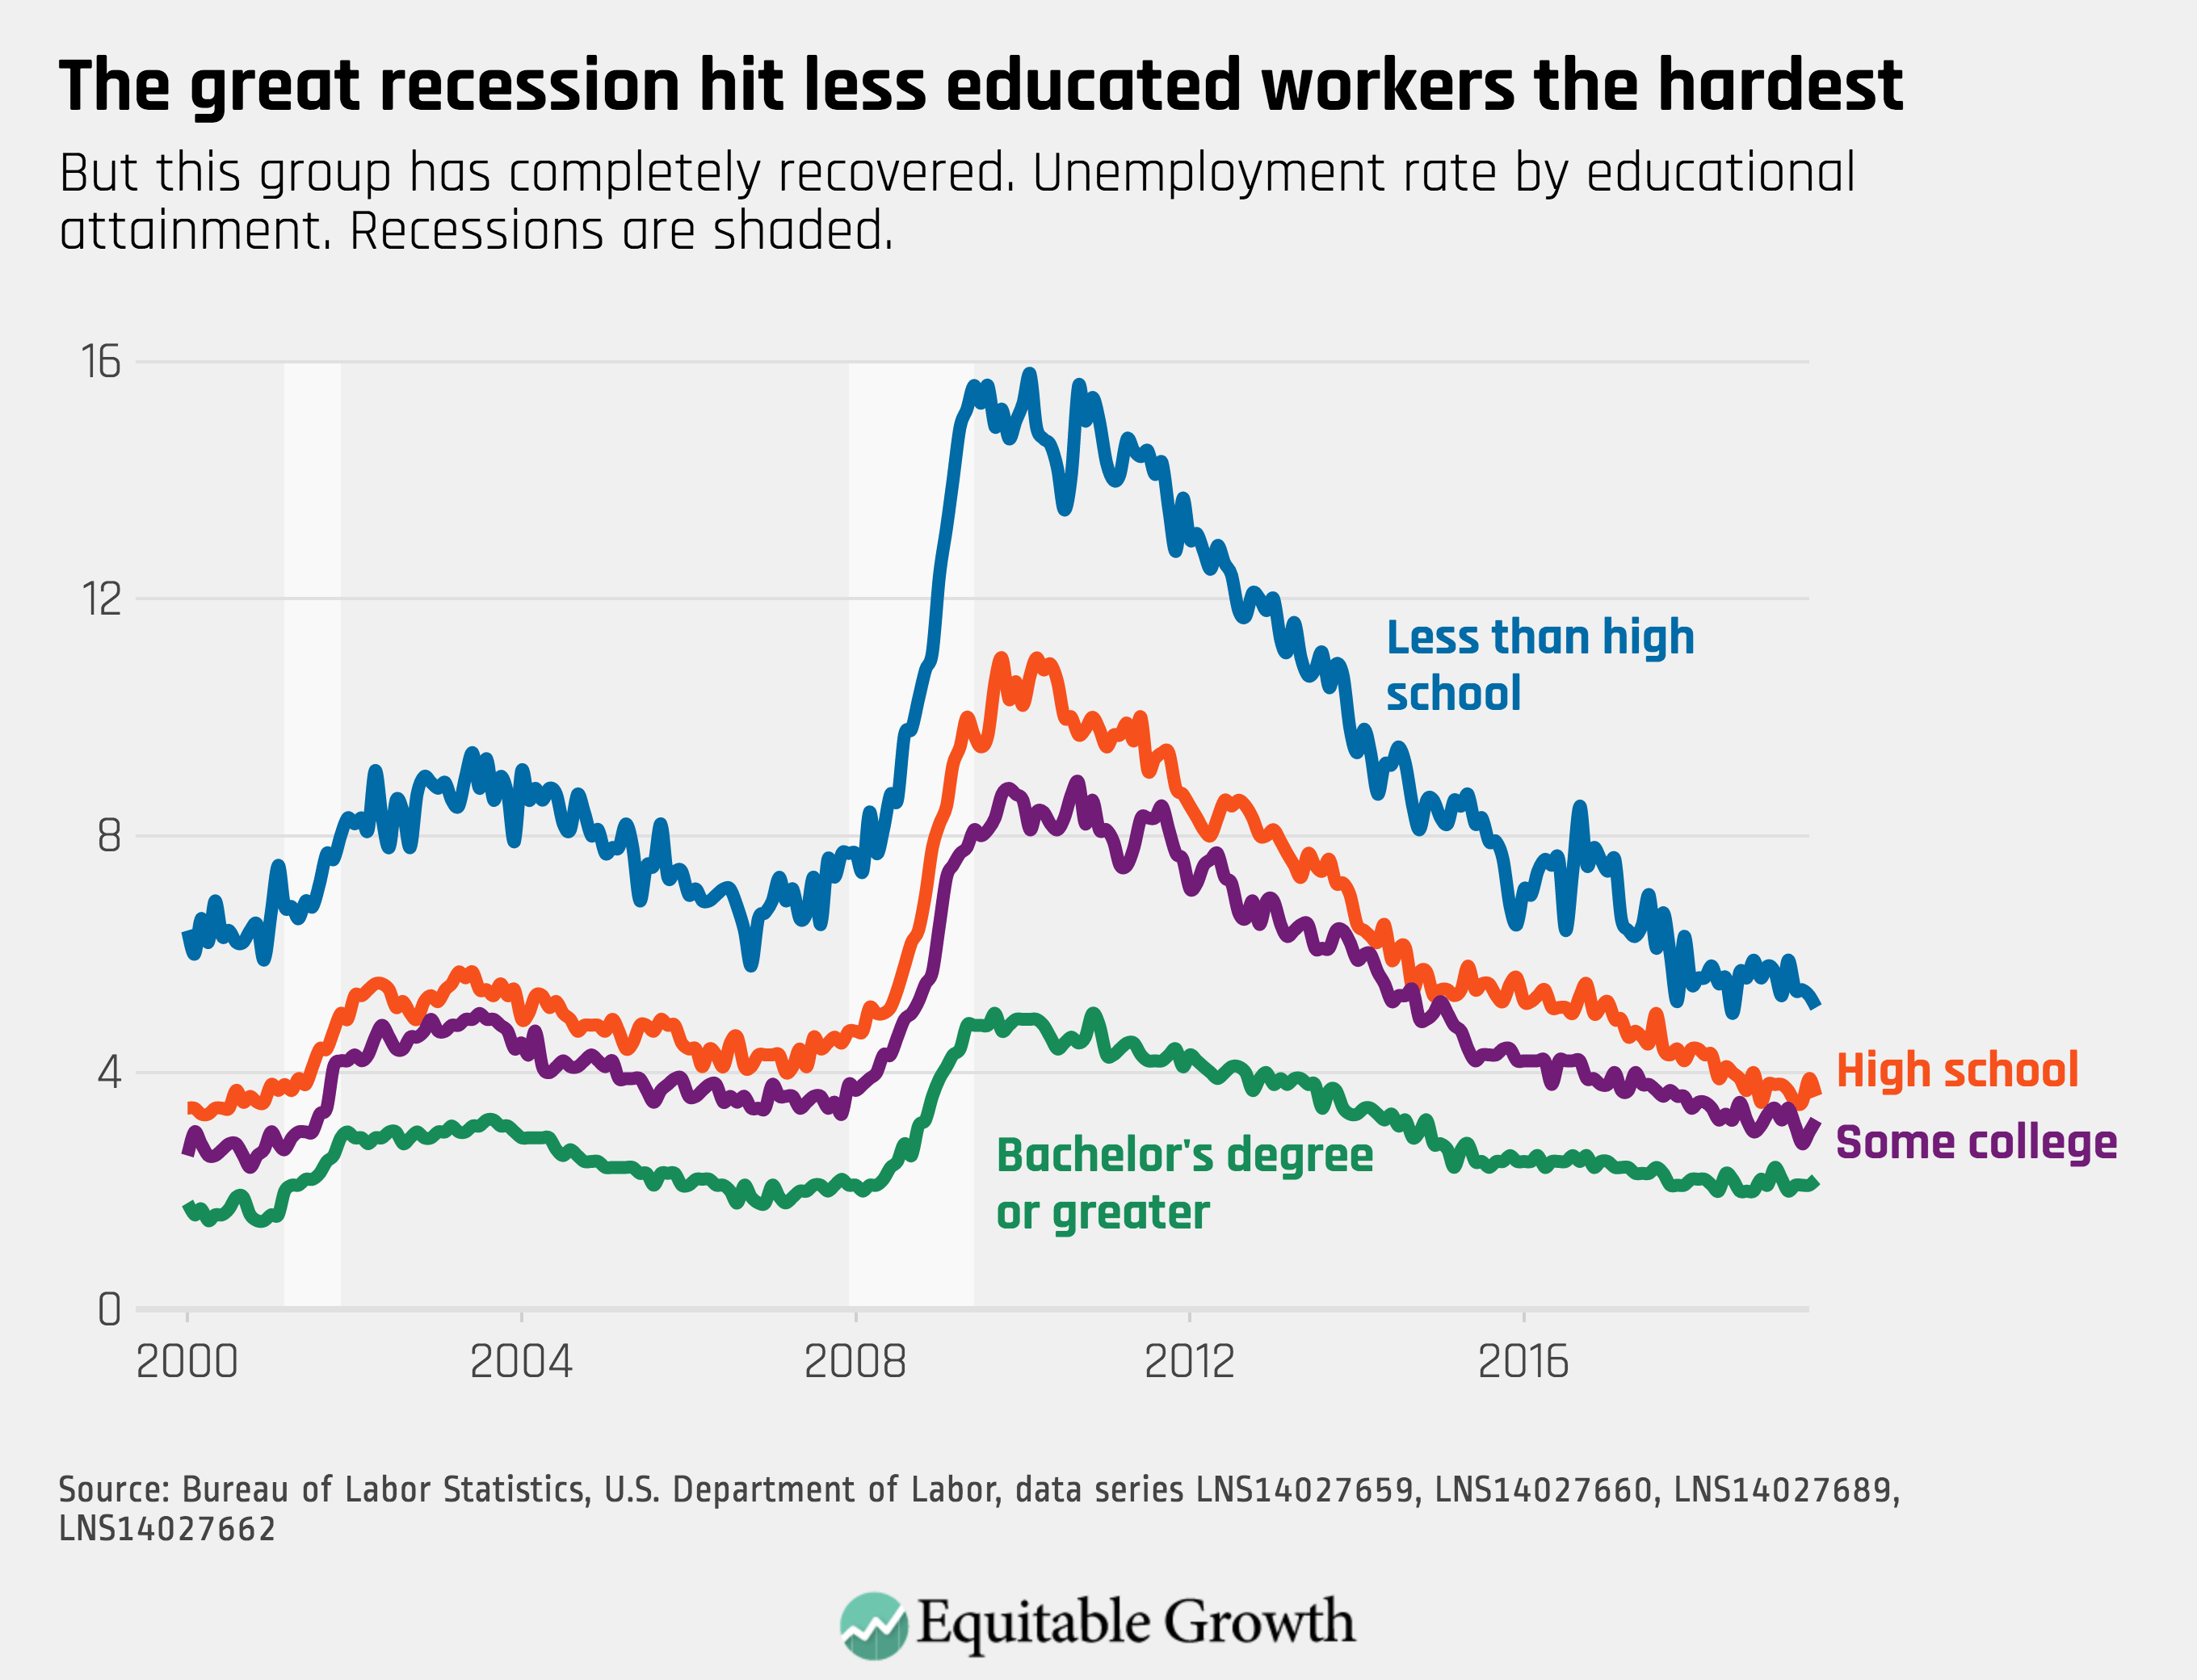
The unemployment rate for workers with a high school diploma increased in June from 3.5% to 3.9%, and remains nearly twice as high than that for workers with a Bachelor’s degree or higher.

Posted in Uncategorized

Factsheet: Minimum wage increases are good for U.S. workers and the U.S. economy

NEW YORK CITY – APRIL 15 2015: High school students, union activists, and fast food workers marched in Manhattan’s Upper West Side to demand a $15 per hour federal minimum wage.

Overview

The research is clear: Minimum wage increases are good for U.S. workers and the U.S. economy. This overarching fact is important to bear in mind when reading the recently released Congressional Budget Office analysis on the expected impacts of raising the minimum wage.

This factsheet contextualizes the CBO report in light of cutting-edge econometric research on minimum wage increases from economists and other scholars in Equitable Growth’s network. The research papers cited in this factsheet use sophisticated research techniques that show past assumptions about the minimum wage are not correct. These newer research techniques hone in on causality by drawing on improved empirical methodologies, computing power, and previously unavailable detailed administrative data.

Download File
Minimum wage increases are good for U.S. workers and the U.S. economy

Distribution and welfare

  • Minimum wage increases significantly lower the poverty rate, increase earnings for low-wage workers, and decrease public expenditures on welfare programs.1
  • The earnings boost for low-wage workers from higher minimum wages extends beyond the immediate effect of the legal change and instead grows in magnitude for several years thereafter.2
  • A 10 percent increase in the minimum wage increases wages by 1.3 percent to 2.5 percent for workers in the food and beverage industry, according to a study of six cities with especially high minimum wages.3
  • Minimum wage increases can have some of the largest benefits for disadvantaged ethnic groups. The expansion of the federal minimum wage to cover additional industries in the 1966 Federal Labor Standards Act explained 20 percent of the reduction in the black-white wage gap during the Civil Rights era.4 And the poverty rate for black and Hispanic families would be around 20 percent lower had the minimum wage remained at its 1968 inflation-adjusted level and not been allowed to languish and atrophy for years.5

Jobs and employment

The importance of the latest research methodology

The empirical revolution evident in the research papers cited in this factsheet allow policymakers and economists alike to move past guesses about how individuals or businesses might react to policy changes involving the minimum wage to observe how they actually behave. Three key studies by leading scholars on the minimum wage that exemplify this new data-driven analysis are:

  • An analysis that leverages data from 1979 to 2014 with several empirical strategies to confirm that minimum wage increases have minimal employment effects, while illustrating the key methodological flaws in economics papers alleging large employment losses11
  • A study showing that recent research on the supposed ill-effects of a recent minimum wage increase in Seattle is largely uninformative for policymaking, as it relies on many of the same methodological flaws as previous studies12
  • An expansive study that uses several cutting-edge econometric methods on the most comprehensive dataset in the minimum wage research literature to substantiate large income increases and negligible employment costs in more than 100 state-level minimum wage increases in recent decades13

Conclusion

While some states and cities have increased their minimum wages in recent years, the current federal minimum wage has been stuck at $7.25 since 2009. Recent breakthroughs in economic methodology and analysis prove that raising the federal minimum wage would decrease poverty and increase earnings for workers, especially for low-wage workers and people of color. Yet the recent analysis from the Congressional Budget Office unjustifiably discounts the new, more empirically rigorous research, leading it to underestimate the benefits and overestimate the harms of raising the minimum wage. As federal legislators consider the Raise the Wage Act, a bill that would gradually increase the federal minimum wage to $15 an hour over the next five years, it is critical that they have access to the most cutting-edge economic evidence on which to base their decision.

About the authors

Kate Bahn is the director of Labor Market Policy and an economist at the Washington Center for Equitable Growth. Will McGrew is a research assistant at the Washington Center for Equitable Growth.

Posted in Uncategorized

Where does your state’s minimum wage rank against the median wage?

This post originally published Nov. 5, 2014. It was updated July 8, 2019 to incorporate new data.

Minimum wages and labor markets vary tremendously across the 50 states and the District of Columbia. In light of the recent introduction of the “Raise the Wage Act,” the Washington Center for Equitable Growth has updated its analysis on the minimum-to-median wage ratios across states. While state-level differences are often used as a justification for lower minimum wages in certain regions, this interactive demonstrates that a $15 minimum wage would be beneficial in the vast majority of states.

The ratio of a state’s minimum wage to its median wage measures the strength of its minimum wage, after accounting for each state’s distribution of wages. As our interactive graphic below demonstrates, most states had much stronger minimum wages more than 30 years ago than they do today, pointing to the substantial room for increases in the minimum wage across the country.

The average minimum-to-median wage ratio for the United States was 51 percent in 1979, the first year of data included in our interactive. At that time, 29 states had ratios exceeding this mark, but by 2013 the minimum-to-median wage ratios were below 51 percent for all states (with the exception of Oregon and Arizona) as well as the District of Columbia.

Over the past 39 years, the overall minimum-to-median wage ratio in the United States fell to 43 percent in 2018. Indeed, the ratio has fallen even farther but rebounded in the past five years as a result of a recent round of state minimum wage increases.

The minimum-to-median wage ratio is a measure of how much a given minimum wage will affect a specific state’s labor market. Generally, the higher a state’s minimum-to-median wage ratio, the more workers will be affected by an increase in the minimum wage.

Methodology

The state-level minimum-to-median wage ratio is the ratio of the average of the state minimum wage to the state’s median wage in that year. The median wage is the median hourly wage in the Outgoing Rotation Group of the Current Population Survey of earners who work at least 35 hours per week and who are not self-employed. The national minimum-to-median wage ratio is the population-weighted mean of state minimum wages divided by the median national wage.

Resources


Brad DeLong: Worthy reads on equitable growth, June 28–July 3, 2019

Worthy reads from Equitable Growth:

  1. Watch Heather Boushey discuss “How can we better measure growth beyond GDP.”
  2. Equitable Growth’s recent tweet informs me that Oregon is leading on family and medical paid leave: “Congratulation to Oregon for passing one of the most comprehensive paid family and medical leave policies in the nation. To learn more about the implications of paid family leave on American families and employers, check out our factsheet.”
  3. Heather Boushey is walking the walk in her tweet about the new staff union at Equitable Growth: “We believe that having a staff union at Equitable Growth will make us a stronger organization and look forward to working with union members.”
  4. While there has been a lot of noise about the changing short-run U.S. economic outlook over the past year, in actuality very little has changed. The U.S. economy continues to grow slightly above its trend rate of 2 percent per year or so, with no outbreak of inflation and with a roughly 1-in-5 chance of seeing a recession begin within the year. Read my “Weekly Forecasting Update,” in which I write: “It is still the case that: [1] the Trump-McConnell-Ryan tax cut has been a complete failure at boosting the American economy through increased investment in America … [2] U.S. potential economic growth continues to be around 2 percent a year … [3] There are still no signs the United States has entered that phase of the recovery in which inflation is accelerating.”

Worthy reads not from Equitable Growth:

  1. To say that there are now trends for factories to locate close to demand is not an alternative source of regional comparative advantage and disadvantage but rather an amplifier of other sources. Ultimately, customers are located in regions that have regional exports. A region that does not have large regional exports—and the prospect of growing more—will not be attractive to firms making long-run decisions and attempting to locate where their customers will be. It is likely to be a very uphill climb. I do not see this as a “silver lining” at all. Read Rana Foroohar, “Silver Lining for Labour Markets” (subscription required), in which she writes: “Globalisation … bottom of … reasons that labour’s share of national income has declined … The biggest reason … supercycles in areas … which favour capital over labour. … Automation and the speeding up of capital substitution because of technological shifts have hurt traditional industrial areas disproportionately … A mere 25 cities and regions could account for 60 percent of U.S. job growth by 2030 … Tech hubs will benefit, of course, as will commodity-rich areas and tourism centres catering to the wealthy. But so will … regions … capitalis[ing] on a silver lining … being closer to customer demand … Companies such as Nike and Adidas have built highly automated ‘speed-factories’ … to roll out the latest styles faster and more cheaply.”
  2. I do not understand this alternative. Tapping into global markets is great—if you have something to sell. But if low-wage labor is no longer a powerful source of potential comparative advantage, what then do poor countries have to sell that could jump-start development? There is labor, there is capital, there is expertise, there is your natural resource base. Poor counties are poor because they lack capital and expertise. And, as for natural resources, well, the “resource curse” is a phrase often heard for good reason. Read Michael Spence, “The ‘Digital Revolution’ of Wellbeing,” in which he writes: “In the early stages of development … labor-intensive process-oriented manufacturing and assembly has played an indispensable role … Advances in robotics and automation are now eroding the developing world’s traditional source of comparative advantage … E-commerce platforms … [are] the real prize in the global marketplace. Only if digital platforms could be extended to tap into global demand would they suggest an alternative growth model (provided that tariffs and regulatory barriers do not get in the way).”
  3. That Martin Feldstein was certain that we could determine and then agree upon what good public policies were was always heartening and raised my confidence that we could make a better world. Read Larry Summers, “The Economist Who Helped Me Find My Calling,” in which he writes: “Working for [Feldstein], I saw what I had not seen in the classroom: that rigorous and close statistical analysis … can provide better answers to economic questions, and possibly better lives … Marty was a magnet for talent … Marty cared about people’s economic analysis, not their political affiliation. That is why he mentored stars like Jeffrey Sachs and Raj Chetty, who disagreed with him on many questions.”
Posted in Uncategorized

Washington Center for Equitable Growth Unionizes with Nonprofit Professional Employees Union

Equitable Growth team members, some of whom are pictured here, kicked off the start of union negotiations with a card check.

The Nonprofit Professional Employees Union issued the below press release on July 2, 2019, announcing the Washington Center for Equitable Growth joining the union.

Today, the employees at the Washington Center for Equitable Growth (Equitable Growth), a nonprofit research and grantmaking organization dedicated to advancing evidence-based ideas and policies to promote strong, stable, and broad-based economic growth, announced they have unionized with the Nonprofit Professional Employees Union (NPEU). Management at the organization has voluntarily recognized the union.

Equitable Growth employees believe that a staff union complements the organization’s mission, which seeds and elevates research and analysis on how inequality obstructs, distorts and subverts the pathways to economic growth in areas ranging from labor standards, social insurance, and taxation to competition, wages, economic mobility, and innovation.

“In the spirit of advancing evidence-backed ideas that promote strong, stable, and broad-based economic growth, the research shows that strengthening workers’ voice is a fundamental part of achieving a more prosperous economy,” said Equitable Growth President and CEO Heather Boushey. “We believe that having a staff union at Equitable Growth will make us a stronger organization and look forward to working with union members.”

“We at Equitable Growth are joining together in union to uphold and further improve the good conditions and workplace standards we currently enjoy,” said Equitable Growth employee and NPEU member Delaney Crampton. “From our organization’s work, we know the importance of having a voice in the workplace, and with our union we will be able to live the values we promote every day at Equitable Growth.”

“We are beyond excited that the employees of Equitable Growth have chosen to join our union,” said NPEU President Kayla Blado. “Nonprofit employees continue to join together and use their collective voice to strengthen their organizations. With a union, Equitable Growth employees will have a greater say in their workplace so it continues to thrive.

Equitable Growth management and staff will now work together to create a collective bargaining agreement—also known as a union contract—that sets forth conditions of employment.

About NPEU:

The Nonprofit Professional Employees Union (NPEU) represents professionals employed at over a dozen nonprofit organizations, including employees at Economic Policy Institute, the Center for American Progress, and Community Change. With about 250 members in the Washington, D.C.- area, NPEU gives nonprofit employees a voice to strengthen their workplaces and continue to do work that makes a difference in people’s lives.

Posted in Uncategorized

Neither history nor research supports supply-side economics

The Laffer curve shows a theoretical relationship between rates of taxation and the resulting levels of government revenue.

President Donald Trump last month awarded Arthur Laffer—father of the Laffer Curve and the godfather of supply-side economics—the nation’s highest civilian honor, the Medal of Freedom. Relatively few economists have received the Presidential Medal of Freedom. Most of them could also boast a Nobel Prize in economics, and all of them had deep records of distinguished academic work or public service, neither of which pertains to Laffer.

In its announcement, the White House called Laffer “one of the most influential economists in American history.” While it’s true multiple presidents have relied on his theories to defend significant, far-reaching tax legislation all in the name of economic growth, whether he increased public understanding of economics, helped strengthen the nation’s economy, or had a positive impact on the well-being of the American people are all highly dubious.

Laffer’s ideas do contain a grain of truth, in that cutting taxes can lead to more economic activity. He sold the country on the idea that tax cuts were magic. He contended tax cuts would lead to so much investment and economic growth that they would end up generating at least as much government revenue as they cost. In other words, he said tax cuts would pay for themselves.

The magical thinking sold to the American people was that giving tax cuts to the rich would improve the lives of the majority. Laffer’s theory provided a foundation for supply-side economics and was illustrated by the Laffer Curve, which he famously drew on a paper napkin for then-White House Chief of Staff Dick Cheney in the 1970s.

If the notion that cutting taxes increases revenue seems counterintuitive, there’s a good reason: It’s not supported by research. When that idea becomes the basis for government policy, it can have disastrous consequences.

We’ve seen those consequences play out over multiple administrations. President Ronald Reagan accepted the Laffer Curve hook, line, and sinker. He convinced Congress to enact deep tax cuts in 1981, and tax revenue plummeted. Despite the recovery following the recession of 1981–82, tax revenue didn’t recover and, as a result, Congress enacted deep, painful spending cuts, affecting people across the country. In order to avoid even deeper cuts to programs such as supplemental nutrition assistance and Medicaid, Congress (eventually) forced President Reagan to accept tax increases.

The Reagan tax cuts did not pay for themselves. Moreover, they ushered in a period of broad economic inequality that continues to this day.

If supply-side economics were valid, then a reasonable corollary would be that tax increases reduce revenues and increase deficits. Yet the tax policies enacted by President Bill Clinton and Congress in 1993—primarily increases in tax rates for the wealthy, along with modest spending cuts—not only raised revenues but also were followed by an economic boom that led revenues to rise so much that we saw the first federal budget surpluses in a quarter century. Tax increases, not cuts, raise revenues.

After the massive tax cuts proposed by President George W. Bush were enacted in 2001, revenue fell, with calls for spending cuts to address a self-created problem. Again, like the Reagan cuts, those tax cuts skewed heavily toward the wealthy, and, again, they didn’t pay for themselves.

Then, in 2012 and 2013, Kansas Gov. Sam Brownback, inspired by the Laffer Curve, signed tax cuts into law that were among the largest ever enacted by any state, along with significant spending cuts. Laffer was a paid consultant who lobbied hard for the plan. But the “experiment,” as Brownback called it, was an economic disaster. In 2017, the Republican legislature overrode the governor’s veto and rolled back the tax cuts.

It’s no wonder that in an editorial, The Kansas City Star said, “Recognizing Laffer’s scheme cheapens the prestigious presidential award.”

Even as Laffer’s experiment was rejected in Kansas, President Trump doubled-down on the idea. His tax-cut package, the Tax Cuts and Jobs Act, passed by Congress in 2017, perpetuates Laffer’s magical thinking. Again, the American people were asked to accept Laffer’s promise that deep tax cuts, which mostly go to the wealthy, spur growth and raise revenue so much so that the federal government will not have to make painful cuts. In reality, the legislation added $164 billion to the 2018 budget deficit and will end up adding more than $1 trillion to deficits, according to Congressional Budget Office estimates.

Why do these deficits matter? Two reasons. First, they show that the way to an economy with strong, stable, and broad-based growth does not start with tax cuts for the rich. Second, eventually the piper must be paid. The tax cuts Laffer’s followers put in place skewed to the wealthy, and in every instance, when revenues fell, the American people were told they needed to tighten their belts, cutting investments in people and places that undermine economic security, our nation’s infrastructure, and our efforts to grow our nation’s human capital.

To achieve prosperity for all Americans, and not just those at the top, policymakers need to look to the research. The evidence is not on the side of supply-side economics. A strong middle class with rising wages and the ability to purchase goods and services is the basis of sustainable and broad-based growth. To get there, we need policies that promote higher wages, competition, and the development of human capital, not an increasingly unequal distribution of the economic pie.

Last month’s Medal of Freedom ceremony should mark the end of the supply-side era, and usher in the beginning of a new one, where economic policies are rooted in evidence, not magic.

Posted in Uncategorized

New data reveal how U.S. economic growth is divided

New estimates of U.S. economic growth released this morning by Gabriel Zucman and Emmanuel Saez at the University of California, Berkeley tell us, for the first time, how growth was distributed between rich and lower-income Americans in 2015 and 2016. Notably, 2016 was an especially poor year for working-class Americans in the bottom 20 percent of income, who saw their incomes decline by more than 3 percent as a group.

These new estimates are now available. The research team’s Distributional National Accounts dataset is a new contribution to the economic debate that decomposes aggregate economic output so growth can be reported not just for the economy as a whole but also for Americans up and down the income spectrum.

Per capita Gross Domestic Product growth in 2016 was weak: just 0.85 percent. National Income growth per adult (National Income is another way of measuring total economic output equal to GDP minus depreciation plus net income from abroad) was even worse, at -0.5 percent.14 But that burden was not borne equally. Poor Americans, already the least able to buffer against economic decline, saw the worst of it. Those with the highest incomes also experienced declines, while the middle class saw only modest gains. (See Figure 1.)

Figure 1

This slow growth in 2016 follows a relatively robust 2015, where average growth in National Income was 1.5 percent and the average middle-class worker saw income growth topping 2.5 percent. Strong growth in the middle class also meant that 2015 bucked a decades-long trend of growth primarily benefitting those with the highest incomes. Incomes at the very top were up only modestly, compared to others, and were down slightly for the top 1 percent of earners. Since the early 1980s, broad-based growth such as this has been rare.

These new results underscore that the picture of the economy painted by the quarterly GDP growth report is increasingly misleading in an age of rising economic inequality. GDP growth is a one-number summary that was designed to represent the raw production power of the U.S. economy, but it is often understood as a measure of the well-being of the American worker, despite its inability to tell us about the lived experience of Americans at different levels of income. Addressing this problem requires a new approach to measuring and reporting national output. To measure who prospers when the economy grows, the United States should adopt a new version of GDP—call it GDP 2.0.

Members of Congress in both chambers have introduced legislation that would require the U.S. Bureau of Economic Analysis to report how growth is distributed among workers at different levels of income. The Measuring Real Income Growth Act is sponsored by Sens. Chuck Schumer (D-NY) and Martin Heinrich (D-NM) in the Senate and Rep. Carolyn Maloney (D-NY) in the House of Representatives.

Measuring who prospers when the economy grows and reporting on the fortunes of different income groups, as the researchers behind these new numbers do, yields important insights about the U.S. economy and suggests that more rigorous policy interventions are needed to bolster working-class incomes and fight income inequality. Figure 2 shows how National Income growth has been distributed in each year since 1963, with the poor and middle class represented by cool colors and the richest 10 percent of the population represented by warm colors.

Figure 2

As Figure 2 shows, the benefits from economic growth have disproportionately accrued to the top 10 percent since the early 1980s. Progress for the bottom 50 percent has almost completely collapsed over the same time period. Since 1980, the richest 10 percent of Americans have captured more than half of all growth in the economy. Meanwhile, working-class Americans with below-median incomes have received just 10 percent of all growth. Americans in this group are keeping up with inflation but have relatively stagnant incomes; they are essentially treading water.

The past three economic expansions have largely benefitted the top 10 percent. In each, the top decile received between 47 percent and 59 percent of all income growth in the expansion. The losses endured during contractions were similarly distributed. (See Figure 3.)

Figure 3

A significant tax cut passed during the George W. Bush administration that primarily benefitted those in higher brackets and the booming financial sector of the early 2000s probably contributed to the less equitable growth amid the 2003–2006 expansion. But the dismal growth seen by the bottom 50 percent in each of the past three expansions points to the persistence of inequitable growth in the U.S. economy and suggests that there is room for more aggressive policy to address inequality.

The share of total economic income held by the top 10 percent dropped slightly between 2014 and 2016, from 39.2 percent to 38.4 percent. Its high was 40 percent in 2012, a rise of more than 10 percentage points from lows of around 30 percent in the 1960s and 1970s. Figure 4 charts the steady rise of top 10 percent’s share of income.

Figure 4

Evidence shows that economic inequality is a threat to the overall strength and stability of our economy. Ensuring our economy works for all Americans—and not just for those at the top—starts with collecting the data that allow policymakers to accurately measure how the U.S. economy is performing at all income levels. Without that window into the lived experiences of households—rich and poor—policymakers will remain severely hampered in their ability to fight for equitable growth. Passing the legislation introduced by Sens. Schumer and Heinrich and Rep. Maloney is a necessary first step for governance that aims to achieve economic progress for all Americans.

In this video, Heather Boushey, executive director of the Washington Center for Equitable Growth, explains the importance of measuring who prospers when the economy grows. Historically, policymakers have relied on gross domestic product, or GDP, to measure the state of the U.S. economy. But in today’s era of increasing inequality, aggregate GDP statistics do not reflect the lived reality of most Americans, underscoring the need for new data on how the economy is performing for Americans at all income levels.

Posted in Uncategorized

Weekend Reading: “Debate season kick-off” edition

This is a weekly post we publish on Fridays with links to articles that touch on economic inequality and growth. The first section is a round-up of what Equitable Growth published this week and the second is the work we’re highlighting from elsewhere. We won’t be the first to share these articles, but we hope by taking a look back at the whole week, we can put them in context.

Equitable Growth round-up

Twenty of the 24 candidates for the Democratic nomination for president met in Miami this week for the first two debates of the primary season. If you found it hard to keep up with all the issues being discussed (especially amid all the interruptions, technical glitches, and Spanish interludes), Delaney Crampton breaks down which economic proposals got the most air time and which, according to Equitable Growth research, would best combat inequality.

Equitable Growth blogger Brad DeLong lists some of the most worthy reads from Equitable Growth and around the web this week.

The Washington Center for Equitable Growth this week said goodbye to one of its longest-tenured employees. Elisabeth Jacobs joined the team in 2014, only months after Equitable Growth was founded, and wore many hats for the organization, most recently spearheading our family economic security work. To honor her contributions, Weekend Reading is recommending a compilation of her “greatest hits”: her reports on intergenerational mobility (with Liz Hipple), paid family and medical leave, and innovation and entrepreneurship. Thankfully, Jacobs is not going far: She starts this summer as a senior fellow with the Urban Institute.

Links from around the web

The wealth tax continues to grow in popularity, even among the very lucky few who would be subject to it. Nineteen very wealthy individuals, including one “anonymous” signatory (intriguing!), wrote an open letter to the 2020 presidential candidates calling for a tax on those with fortunes in the top 0.1 percent of the wealth distribution, citing Equitable Growth’s work in this area. Patricia Cohen has the story for The New York Times.

Eric Levitz in New York magazine’s “Intelligencer” column offers a theory for why U.S. labor force participation remains below precrisis levels and wage growth hasn’t been more robust—and economists who swear by the U.S. Bureau of Labor Statistics’ official unemployment rate won’t like the answer. Levitz argues that flaws in the Current Population Survey, the research instrument underlying today’s historically low 3.6 percent unemployment rate, have masked a willingness among discouraged workers to jump back into the labor force. If he’s right, then the U.S. economy would have quite a bit more to grow before exhausting its supply of labor and triggering inflation, something with which the “policy establishment,” in Levitz’s view, has been overly concerned.

For all of our nation’s lip service paid to “family values,” the United States continues to be a very family-unfriendly place to live and work. Mary Beth Ferrante from Forbes reports on UNICEF’s latest study comparing member nations of the Organisation for Economic Co-operation and Development and European Union countries on family-friendly policies such as paid leave and childcare. Not surprisingly, the results were not good for the United States, losing out to the likes of Croatia on paid maternity leave (39 weeks versus zero) and Estonia on paid paternity leave (2 weeks versus zero). But as Equitable Growth’s Elisabeth Jacobs describes in the article, it is an exciting time for those hoping for progress on these issues, as the U.S. House of Representatives held a well-attended hearing on paid family and medical leave last month and a bold new proposal on universal family care was unveiled just this week.

ProPublica has recently been blowing open one scandalous tax story after another, and last week came out with another gem. It’s a cautionary tale for any policymaker—or cartographer—interested in using the tax code to spur place-based economic development. For another skeptical take on the 2017 Tax Cuts and Jobs Act’s “Opportunity Zones” incentive program—and the challenge of attracting mostly white investors to finance already-operating, minority-owned businesses, as opposed to new real estate development—see this piece from Oscar Perry Abello in Next City.

Speaking of place-based inequities, Jamiles Lartey at The Guardian has a heartbreaking piece about a 30-year gulf in average life expectancy between residents of two neighborhoods in Chicago just eight miles apart (Streeterville and Englewood). It’s the largest such divergence within any city in the United States, and, not surprisingly, race is at the heart of the problem.

Friday Figure

Figure is from Equitable Growth’s, “JOLTS Day Graphs: April 2019 Report Edition” Raksha Kopparam and Kate Bahn.

Posted in Uncategorized

Research and resources on the 2020 presidential debate issues and themes

The Democratic presidential debates kicked off this week in Miami.

This week kicked off the first of 12 Democratic debates ahead of the 2020 election. Economic inequality took center stage, with candidates weighing in on issues including paid leave, competition, early childhood education, and the racial pay gap. Equitable Growth has compiled extensive research outlining the effects of many of the proposals discussed. Below is a guide that includes some of the issues highlighted, with relevant resources detailing the impacts these proposals would have on tackling inequality.

Taxation of wealth

Nineteen multimillionaires and billionaires have penned a letter to the 2020 presidential candidates calling on them to advocate for a wealth tax on the richest Americans, in which Equitable Growth research was cited. Several candidates, including Sen. Elizabeth Warren (D-MA), Sen. Bernie Sanders (I-VT), and South Bend, Indiana Mayor Pete Buttigieg (D) have come out in support of some form of a taxation on wealth. Director of Tax Policy and chief economist Greg Leiserson has outlined an introduction to net worth taxes, how net worth taxes would work, and what the implications for a net worth tax would be.

Raising the minimum wage

Twenty presidential candidates have come out in favor of the Raise the Wage Act, which would increase the federal minimum wage from $7.25 to $15 an hour. Here, Director of Labor Market Policy and economist Kate Bahn explores studies on the effects of raising the minimum wage, which includes research from Equitable Growth grantees and University of California, Berkeley economists Sylvia Allegretto, Anna Godoey, Carl Nadler, and Michael Reich, examining cities that raised the minimum wage above $10 an hour, as well as funded research from Kevin Rinz and John Voorheis of the U.S. Census Bureau, who look at the effects of state-level increases to the minimum wage.

The right to organize

In the first round of debates, Washington Gov. Jay Inslee (D) spoke about the importance and power that unions have to protect workers and reduce inequality. In this piece, we explore the correlation between the decline in unions and increasing inequality.

Paid family and medical leave

With the introduction of the FAMILY Act this year by presidential hopeful Sen. Kirsten Gillibrand (D-NY), paid family and medical leave has been thrusted into the 2020 debate. In this report, paid leave expert and former Senior Director of Family Economic Security Elisabeth Jacobs calls paid family care leave a “missing piece” from the social insurance system in the United States.

Gender and racial pay gaps

During the debates, Sen. Amy Klobuchar (D-MN) spoke out about the racial pay gap and its drag on inequality in our country. To commemorate Juneteenth this year, Equitable Growth’s Liz Hipple and Maria Monroe wrote about the inequalities that exist between black and white Americans by laying out some of the research and analysis exploring the persistence of economic racial inequality and some of the reasons for it.

Early childhood education

Sen. Warren and New York City Mayor Bill de Blasio (D) have both proposed universal pre-Kindergarten initiatives. Here, Equitable Growth’s Will McGrew examines how investments in early childhood education improve outcomes of program participants. And in this piece, Somin Park assesses research from Equitable Growth Steering Committee member and Princeton University economist Janet Currie, which discusses the need for a national childcare policy.

Prescription drug pricing

Numerous candidates addressed the rising cost of prescription drug prices, and several have released detailed plans for how they would combat the issue if elected. Equitable Growth’s Director of Markets and Competition Policy Michael Kades discusses why competition is an important answer to combating rising drug prices and also reviews recent bipartisan movements in Congress taking aim at lowering costs.

Gross Domestic Product

Sen. Cory Booker (D-NJ) spoke out about the need to re-examine how our country uses Gross Domestic Product as a measurement of growth and questioned whether everyday people were feeling the effects of strong GDP numbers. To better understand who prospers when the economy grows, Equitable Growth’s Austin Clemens and Executive Director Heather Boushey wrote a report on disaggregating growth, which calls on policymakers to rethink how our country measures growth in order to look at who is actually benefiting from economic gains.

Competition, antitrust, and monopoly power

All of the presidential hopefuls have come out in full swing in favor of antitrust reform and raising awareness to an increase in the concentration of power held between a handful of corporations. Here, antitrust expert Fiona Scott Morton gives an overview of recent academic literature on antitrust enforcement.

To stay up to date on resources related to the candidates’ economic proposals, be sure to sign up for the Equitable Growth newsletter.

Check out our Democratic Debate Twitter Moment below for additional information:

Posted in Uncategorized

Brad DeLong: Worthy reads on equitable growth, June 21–27, 2019

Worthy reads from Equitable Growth:

  1. If you did not read this when it came out 5 years ago—or if it is not fresh in your brain—you need to read or reread it today. Emmanuel Saez and Gabriel Zucman, “Exploding Wealth Inequality in the United States,” in which they write: “Income inequality has been on the rise … [with a] large portion of this increase is due to an upsurge in the labor incomes earned by senior company executives and successful entrepreneurs. But is the rise in U.S. economic inequality purely a matter of rising labor compensation at the top, or did wealth inequality rise as well? … (Hint: the answer is a definitive yes, as we will demonstrate below) … Currently available measures of wealth inequality rely either on surveys (the Survey of Consumer Finances of the Federal Reserve Board), on estate tax return data, or on lists of wealthy individuals, such as the Forbes 400 list of wealthiest Americans.”
  2. If you did not read Austin Clemens and Heather Boushey a year ago on the need to track growth not just for the economy as a whole but for Americans at every point along the income curve, you should go do so. Read Austin Clemens and Heather Boushey, “Disaggregating Growth,” in which they write: “Measuring who prospers when the economy grows … The National Income and Product Accounts, or NIPA (also referred to as System of National Accounts, or SNA, outside of the United States), were a radical advance in economic measurement when they were instituted in the early 20th century. These accounts track aggregate output and income for the national economy. Most notably, they measure Gross Domestic Product and the quarterly fluctuations in GDP that tell us if the economy is growing or contracting. Before their advent, ascertaining the health of the economy was an inexact and patchwork procedure.”
  3. Great conversation between Heather Boushey and Emmanuel Saez. My favorite highlights from “In Conversation with Emmanuel Saez” are: “Kansas … illustrates beautifully from a research perspective even though it’s a disaster in terms of public policy … tax avoidance … pass-through businesses … huge incentives for high-income earners to reclassify … a big erosion of the wage income tax base in the state … a much bigger negative impact on tax revenue than would have been predicted mechanically …When governments have actually to balance their budgets, they realize that taxes are useful, and that brings the two pieces of the debate together … Certainly Kansas didn’t experience an economic boom.”

Worthy reads not from Equitable Growth:

  1. All signs are that when the next recession comes, the deficit hawks will reappear in full force. But the bust is not the time for austerity: Read Alan Taylor from 2013, “When Is the Time for Austerity?” in which he wrote: “Recent austerity policies have been guided by ideology rather than research … Matching methods based on propensity scores show how contractionary austerity really is, especially in economies operating below potential … Austerity has a … larger and more statistically significant negative effect in the slump. In booms, which one could view as the ‘full employment’ case, we find smaller (and mostly statistically insignificant) impacts of fiscal consolidation on output.”
  2. There are still no signs of any acceleration in measured productivity growth from the low “new normal” that emerged with the financial crisis of 2007–2009. Least of all are there signs of an acceleration in investment and productivity growth produced by the late-2017 McConnell-Ryan-Trump tax cut. Moreover, the growth rate of the labor force now falls off of a demographic cliff. If there were a moment over the past two and a half centuries when we would like, for the economy’s sake, for immigration to be higher than usual, it is now. Read John Fernald and Huiyu Li, “Is Slow Still the New Normal for GDP Growth?,” in which they write: “The new normal pace for U.S. [Gross Domestic Product] growth remains between 1.5 percent and 1.75 percent, noticeably slower than the typical pace … The slowdown stems mainly from demographic trends that have slowed labor force growth … A larger challenge is productivity. Achieving GDP growth consistently above 1.75 percent will require much faster productivity growth.”
  3. The top 0.01 percent of American workers—now some 15,000—this year have incomes, including capital gains, of about 500 times the average income of about $800 a day. Those 15,000 workers in the top 0.01 percent of income this year have an average income of $400,000 a day. How could one go about spending that? Suppose you decided this morning that you wanted to rent the 2,000 square-foot Ritz-Carlton suite at the Ritz-Carlton San Francisco hotel for the week of next Memorial Day, and did so. That would set you back $6,000 for seven nights. You would still have to spend $394,000 more today to avoid getting richer. In fact, to avoid getting richer, you would have to spend $16,667 an hour, awake and asleep, day in and day out. And then there are the rest of the top 0.1 percent—135,000 people, of whom each one, on average, is one-ninth as well-off as the top 0.01 percent and who must spend and reinvest not $400,000 but $45,000 a day. Read Paul Krugman, “Notes on Excessive Wealth Disorder,” in which he writes: “What’s really at issue here is the role of the 0.1 percent, or maybe the 0.01 percent—the truly wealthy, not the $400,000 a year working Wall Street stiff, memorably ridiculed in the movie Wall Street. This is a really tiny group of people, but one that exerts huge influence over policy … Raw corruption … Soft corruption … Campaign contributions … Defining the agenda … For me and others … [this is] a kind of radicalizing moment, a demonstration that extreme wealth really has degraded the ability of our political system to deal with real problems … [and] the [result of the] extraordinary shift in conventional wisdom and policy priorities that took place in 2010–2011, away from placing priority on reducing the huge suffering still taking place in the aftermath of the 2008 financial crisis, and toward action to avert the supposed risk of a debt crisis.”
Posted in Uncategorized