Heather Boushey
Washington Center for Equitable Growth
Testimony before the House Budget Committee,
Hearing on “Solutions to Rising Economic Inequality”
September 19, 2019
Thank you, Chairman Yarmuth and Ranking Member Womack, for inviting me to speak today. It’s an honor to be here.
My name is Heather Boushey and I am President and CEO of the Washington Center for Equitable Growth. We seek to advance evidence-backed ideas and policies that promote strong, stable, and broad-based economic growth.
The United States is experiencing the longest economic expansion in our history. The economy continues to add jobs month after month and the unemployment rate remains historically low. But unlike in past expansions, the strong headline jobs numbers have not translated into strong wage gains for workers. Instead, the benefits of the economic recovery are disproportionately accumulating to the already wealthy. The well-being of working- and middle-class families has become detached from economic growth as those at the top of the income and wealth ladders capture more and more of those gains. Over the past four decades, earnings for low- and middle-income Americans have grown slowly—or not at all—while incomes and wealth have surged at the top.
The latest economic research from across the disciplines shows the many ways that high economic inequality—in incomes, wealth, and across firms—serves to obstruct, subvert, and distort the processes that lead to widespread improved economic well-being. In short, the evidence increasingly points to the conclusion that today’s high concentrations of economic resources are constricting economic growth. Yet, our nation has spent decades systemically undermining the capacity of institutions that were set up to contain and constrain economic inequality. This has made it impossible for the market to work as advertised. The current situation cannot provide a path forward for strong, stable, and broadly-shared income gains across the income distribution.
Policymakers can preserve the best of our economic and political traditions, and improve on them, by pursing policies that can both reduce economic inequality and boost growth. The most critical steps are those that limit inequality’s ability to constrict our economy and tackle the ways that the concentration of economic resources translate into political and social power. Core to this agenda is the need to rebalance the power between those who have access to resources and those who do not. I encourage you to think about the structural effects by focusing specifically on:
- Building inclusive, broad-based, and diverse institutions representing the voices of working- and middle-class families
- Policies that directly boost incomes at the bottom
- Market structure and competition
- Promoting fairness in who pays taxes
- What policymakers both do with the revenue they have and what they must do to cope with too-little revenue.
As a first step, I encourage you to redefine the goal—to focus not on the stock market, headline jobs numbers or just Gross Domestic Product, but on ensuring that economic growth reaches Americans across the income spectrum.
In my testimony, I will first review the longer-term economic challenges facing the U.S. economy, including rising inequality and falling mobility. I will then turn to the ways in which economic inequality hurts growth and productivity and offer a series of solutions to combat the problem of systemic and growing inequality.
The rise in income and wealth inequality
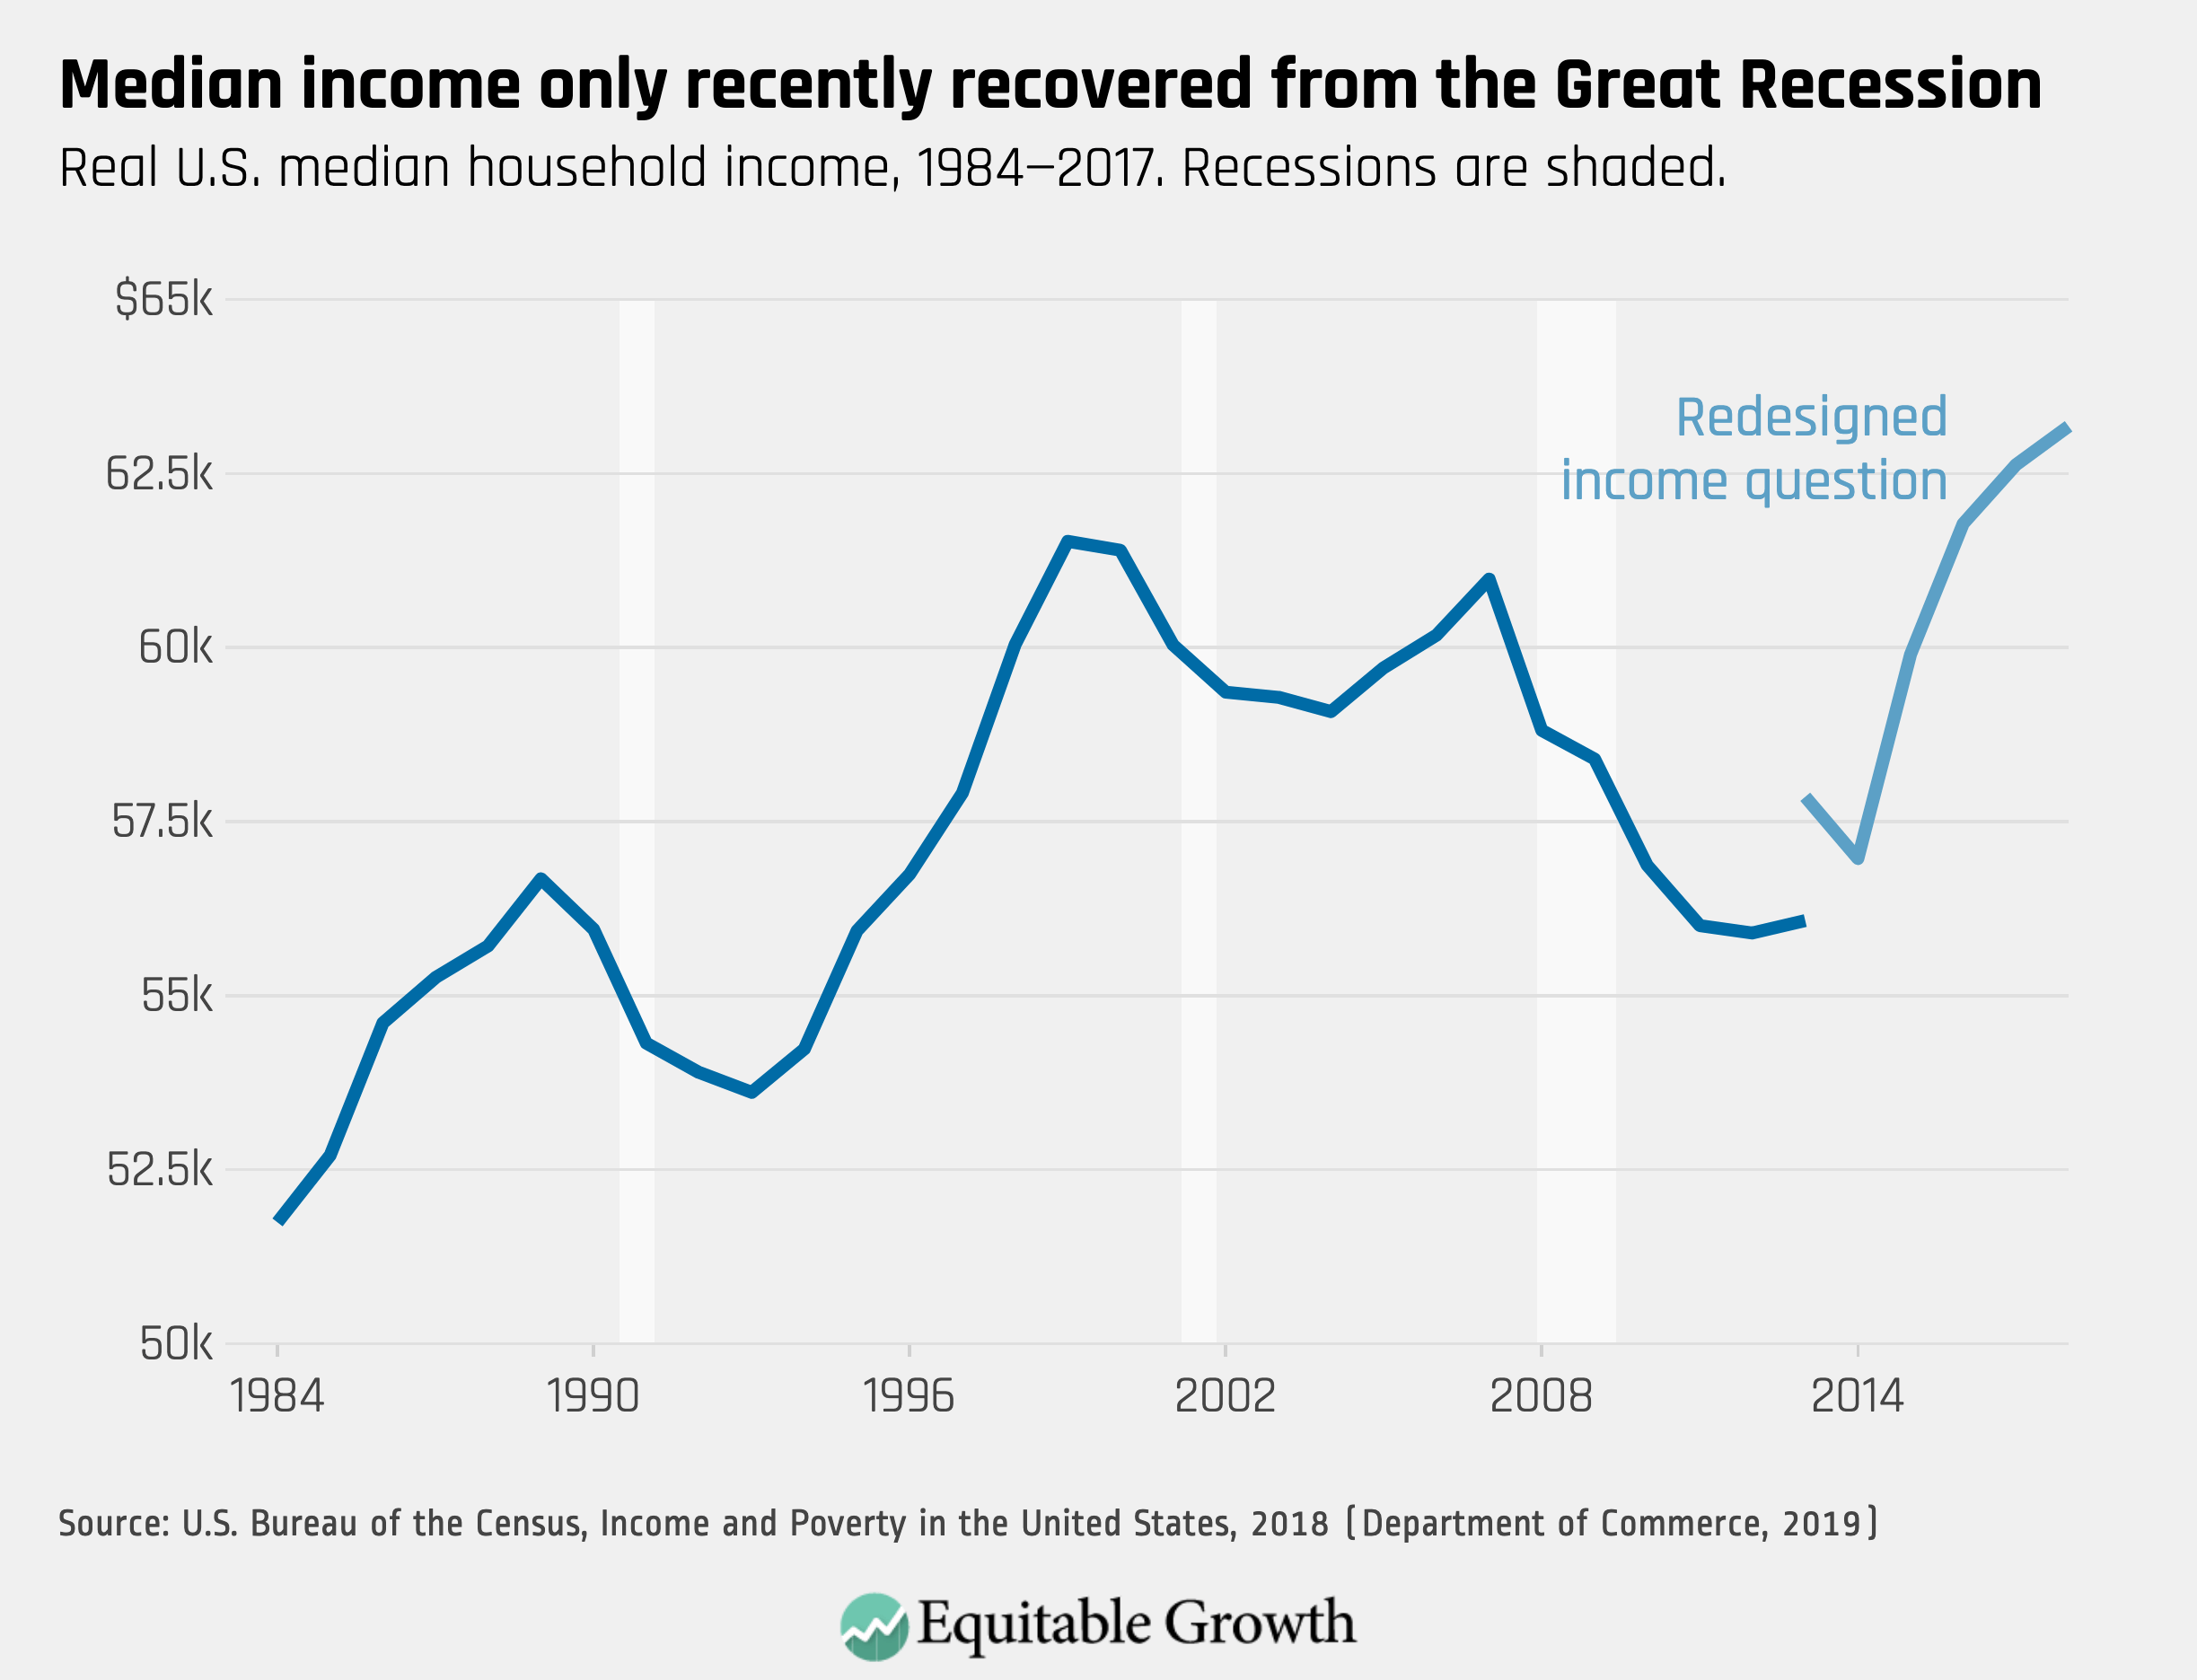
Families across our nation aren’t feeling the benefits of growth in their daily lives and many national economic statistics are becoming less representative of the experience of most Americans. The implication for how policymakers and economists alike evaluate the economy is that average economic progress is pulling away from median economic progress. We see these same divergent trends across multiple measures of economic wellbeing: wages, income, and wealth.
Prior to the 1980s, economic growth was equitably shared between most Americans. But we are now in a new economy, which is both growing slower than in the past and where growth mostly accrues to those at the top of the economic ladder. Incomes for the working-class and the middle-class families have grown slowly for decades while incomes at the very top have exploded.
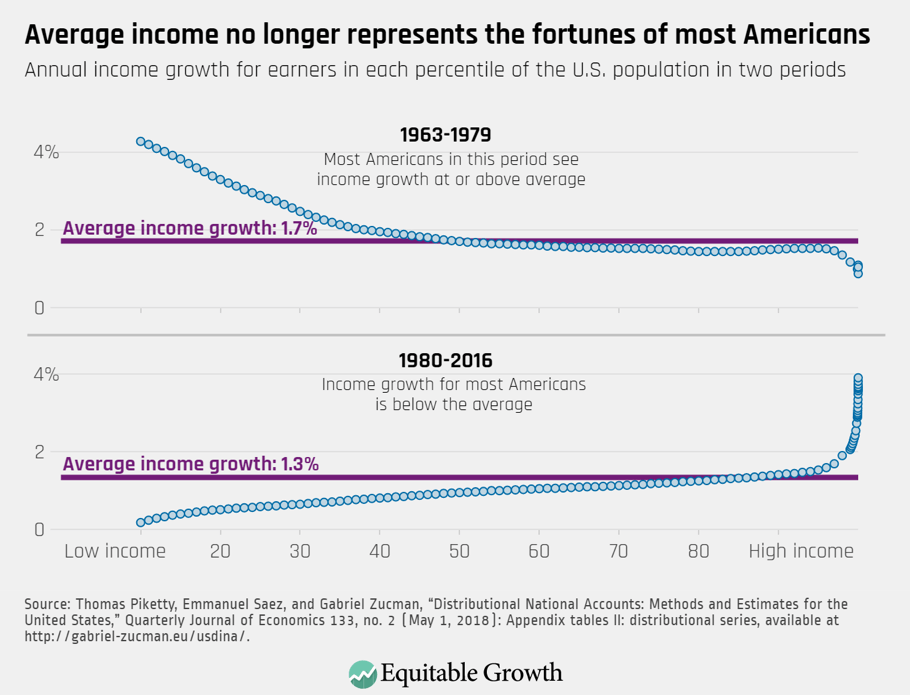
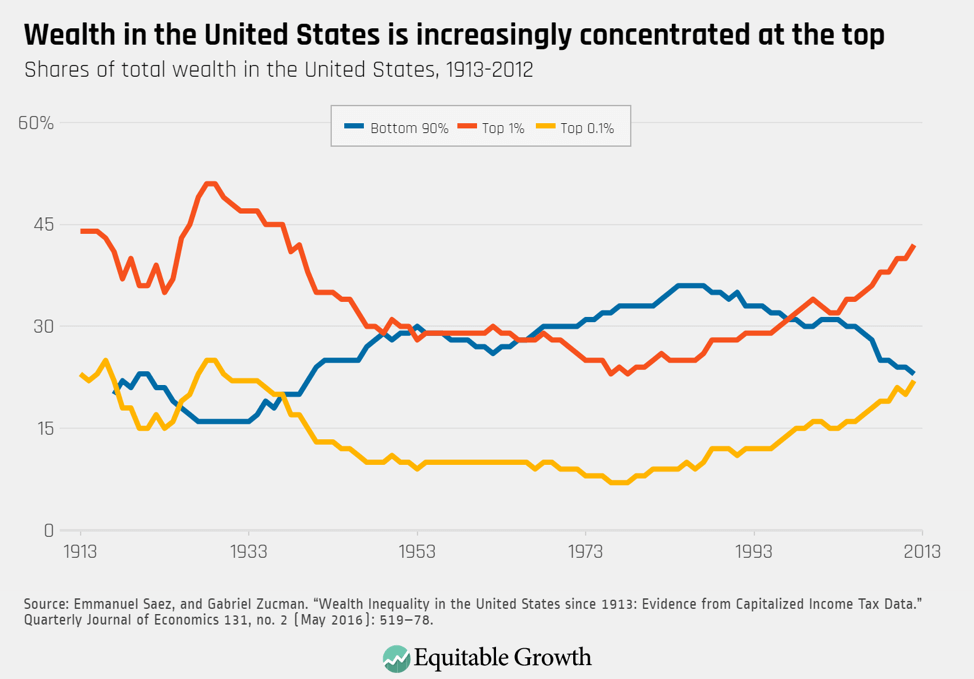
Since 1980, GDP growth (an incomplete measure, as I discuss below) has been slower overall—growing at an annual pace of 1.3 percent compared to 1.7 percent in the three decades before. From 1980 to 2016, those in the top one percent saw their incomes after taxes and transfers rise by more than 180 percent, and those in the top 0.001 percent saw their incomes grow by more than 600 percent. Meanwhile, those in the bottom half saw only a 25 percent rise, find economists Thomas Piketty, Emmanuel Saez, and Gabriel Zucman. To be very clear, this data show that only those at the very tippy top have had truly sizeable gains during this period. (See Figure 1, on page 3.)
Other research confirms the large growth in inequality since 1980. Last week, the U.S. Census Bureau released estimates showing that in 2018 the top 5 percent of income earners took home almost as much of our national income as the bottom 60 percent (23.1 percent compared to 25.5 percent). They also show that U.S. inequality, as measured by the Gini Coefficient, remains near record highs, having grown steadily since 1980.
Prior to this period, there was little need to separate out or “disaggregate” national growth because the headline GDP growth statistic was broadly representative of most Americans. Unfortunately, that is no longer the case.
GDP growth has been treated for decades by pundits and policymakers alike as synonymous with prosperity. President John. F. Kennedy famously alluded to it when he said that “a rising tide lifts all boats.” In the decades since, economists and commentators have used the metaphor of “growing the pie” to indicate that we should first and foremost be concerned with growing the economy rather than concerning ourselves with who gets a slice. But as Figure 1 demonstrates, overall growth of the economic pie is no longer correlated with prosperity for many Americans. Representative Carolyn Maloney has a proposal to make GDP growth representative of all Americans again, which I discuss later in my testimony.
The unequal distribution of income exhibits inequalities by gender and race as well. Those that occupy the highest rungs on the income ladder are much more likely to be male and white, which means that women and people of color are less likely to have access to the economic and political power that higher incomes confer. The U.S. Census Bureau reports that 32 percent of white households earn $100,000 or more—about double the 16.7 percent for black households. Conversely, more than one in 8.7 black households earns less than $15,000, compared to fewer than one in 19 white households.
Figure 1
Inequality of Wealth
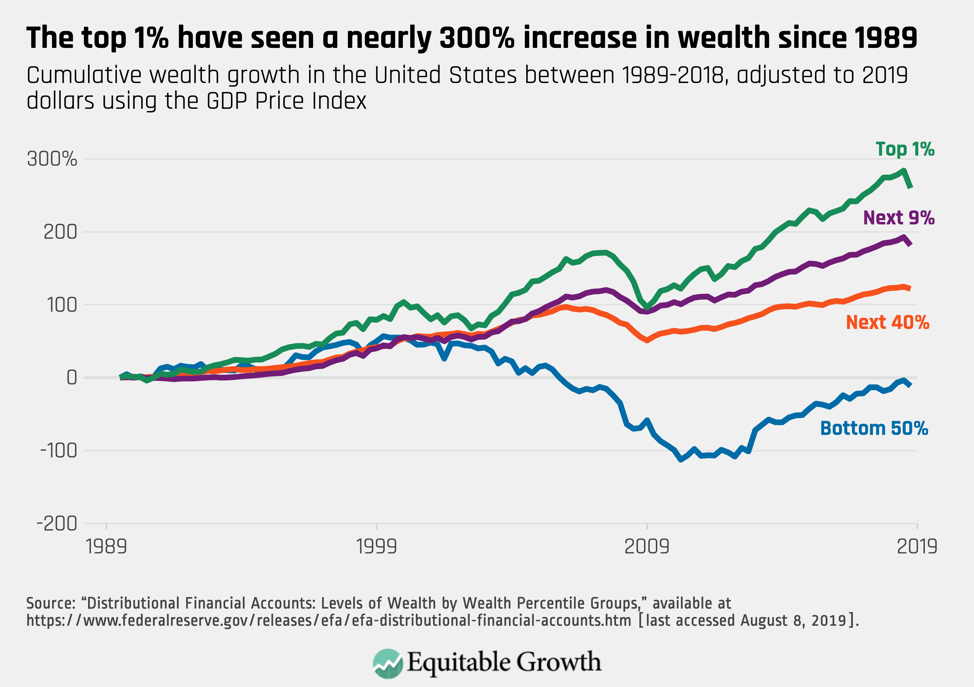
Income is the flow of money while wealth is the stock of accumulating assets—money, but also property, stocks, bonds, and other kinds of capital. The distribution of wealth across U.S. households is even more severely unequal than income. Research by Saez and Zucman documents that in the 1920s, the share of wealth owned by the top 1 percent of households by wealth was 51 percent. As with the share of income owned by the top 1 percent, this fell during the middle of the 20th century by more than half, hitting a low of 23 percent in 1978. Since then, however, wealth gains at the top have grown even faster than income—those in the top 1 percent now control 42 percent of all wealth and the top 0.1 percent control more than 22 percent of all wealth in the U.S. economy, three times as much as a generation ago. This amounts to 160,000 families owning a collective $11.7 trillion. In 2018, this group’s share of wealth was equal to that of the bottom 90 percent of Americans. (See Figure 2.)
Figure 2
The Federal Reserve Board’s new Distributional Financial Accounts also show that wealth is strongly concentrated, with 10 percent of the population holding 70 percent of all wealth in the United States in 2018. The bottom 50 percent of wealth owners experienced no growth in net wealth since 1989. Meanwhile, the top 1 percent saw their wealth grow by almost 300 percent since 1989. Although cumulative growth of wealth was relatively similar among all wealth groups through the 1990s, the top 1 percent and bottom 50 percent diverged around 2000. (See Figure 3.)
Figure 3
Economic inequality and the fall in economic mobility
Moving up the economic ladder and earning more than the previous generation is at the heart of “the American Dream,” still an ideal that many Americans cherish. But groundbreaking research now shows that inequality is hindering upward absolute mobility, obstructing people from moving up as the rungs of the ladder grow further apart.
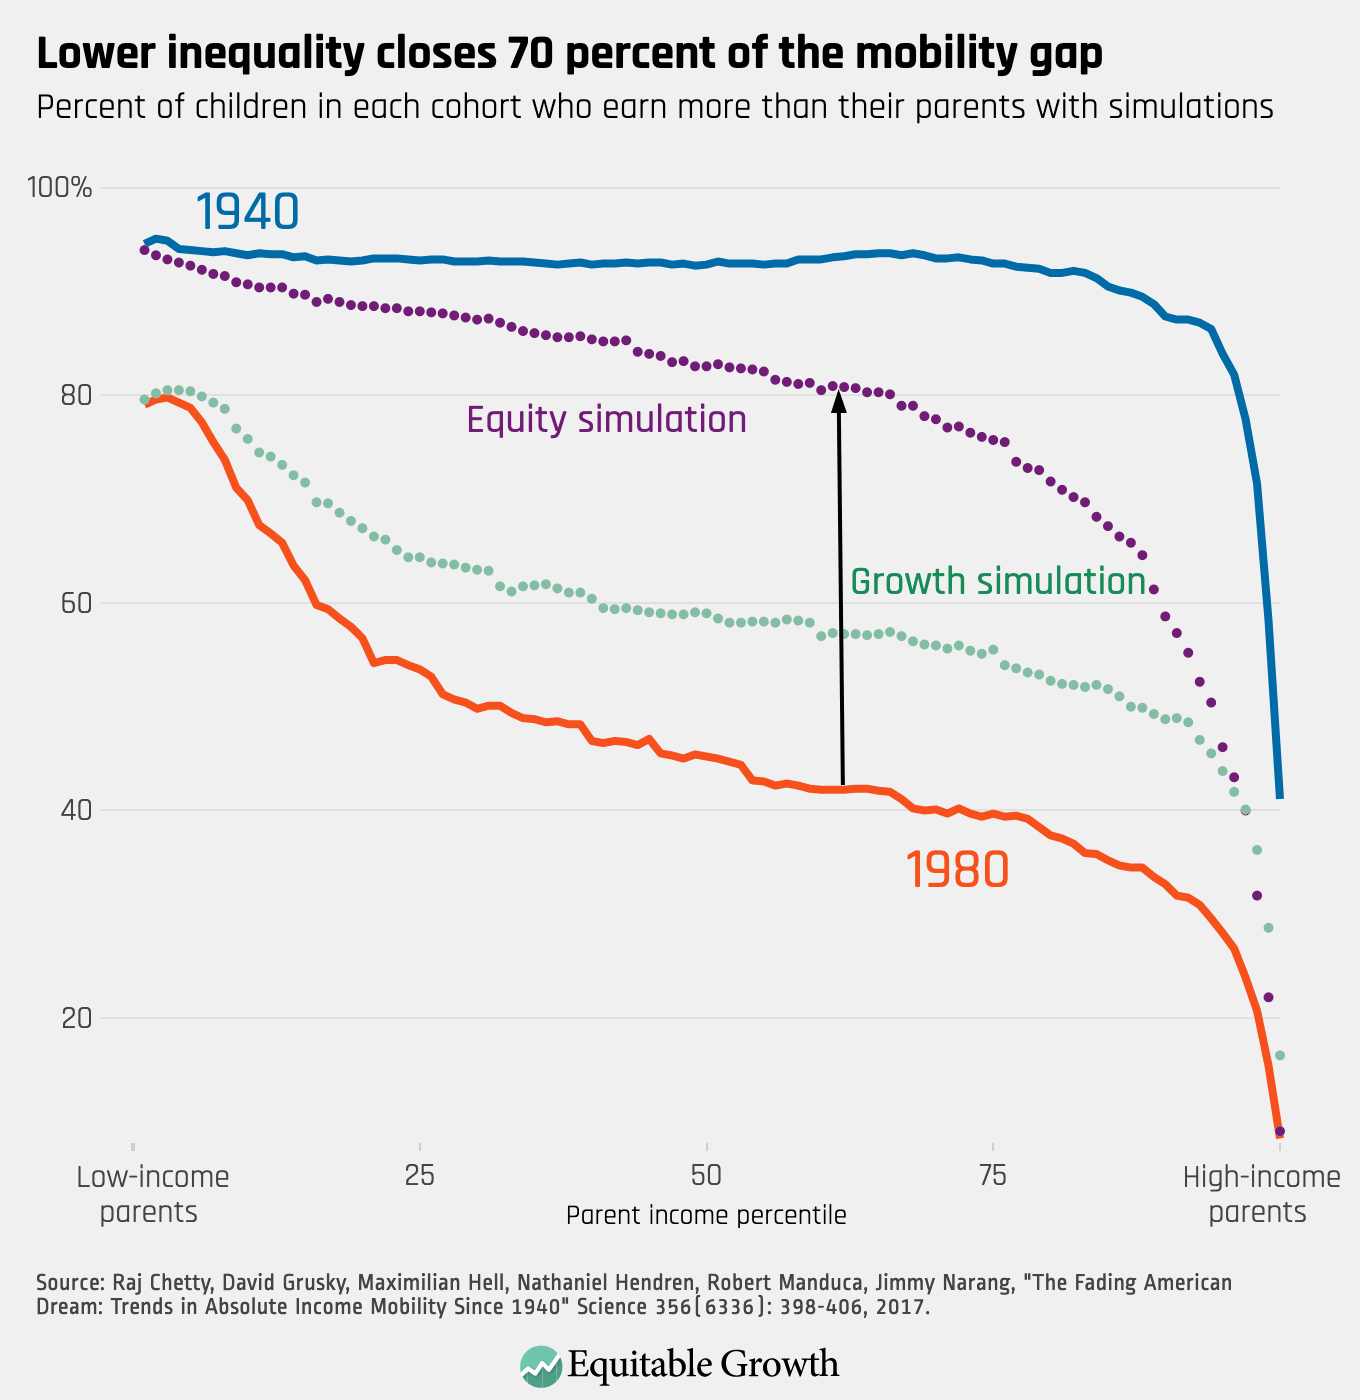
Harvard University economist Raj Chetty and his co-authors looked across generations and found that when people born in 1940 were in their prime work-age years, nearly all—92 percent—had an income that was higher than their parents had at the same age. But when those born in 1980—the Reagan-era children—hit their 30s, only half had an income higher than their parents had at the same age. Middle-income Americans have experienced the largest decline in economic mobility. Looking across the income spectrum, the researchers found that 70 percent of the decline can be explained by the rise in inequality. We could only close 30 percent of this “mobility gap” by raising growth alone. (See Figure 4.)
Figure 4
Inequality limits opportunity for those not already at the top. Everyone needs some measure of capital to start up a business, to give a child a college education, or to take care of sudden medical emergencies. Yet increasingly only the very wealthy have the means to do so without risking their future livelihoods by going into serious debt. In this way we can see that inequities in income and wealth can replicate themselves across generations. Solving falling economic mobility will require tackling economic inequality and all the ways it harms our economy.
Economic inequality is bad for the economy
Inequality constricts growth by:
- Obstructing the supply of people and ideas into our economy and limiting opportunity for those not already at the top, which slows productivity growth over time
- Subverting the institutions that manage the market, making our political system ineffective and our labor markets dysfunctional
- Distorting demand through its effects on consumption and investment, which both drags down and destabilizes short- and long-term growth in economic output
Inequality obstructs the supply of talent, ideas, and capital
The economic circumstances that children are born into affect children’s development in everything from their health to their ability to focus at school to their educational opportunities, and these, in turn, affect their economic outcomes as adults. Research by economists shows the links between factors such as children’s varying birth weights and their different levels of school performance, job-holding, and earnings as adults relative to others with similar skill sets.
Even when children have access to skills, inequality obstructs their contributing to the economy to the best of their abilities, and these obstructions hinder productivity and growth. Research led by Harvard’s Chetty measured what is more important to earning a patent later in life: scoring high on childhood aptitude tests or parental income. Disturbingly, the richer the family, the more likely the child will be to earn a patent—far outweighing demonstrated intelligence. If a child who shows aptitude early on cannot climb the income and wealth ladder, then there’s something broken in the way our economy works. Inequality has blocked the process and, as result, drags down national productivity by making our workforce less capable than it could be and our economy less innovative.
Inequality subverts the institutions that manage the market
Growing inequality is subverting the public institutions and the policymaking process we need to support our economy. It discourages a focus on the public interest and promotes the efforts of firms to accrue larger profits than truly competitive markets would allow.
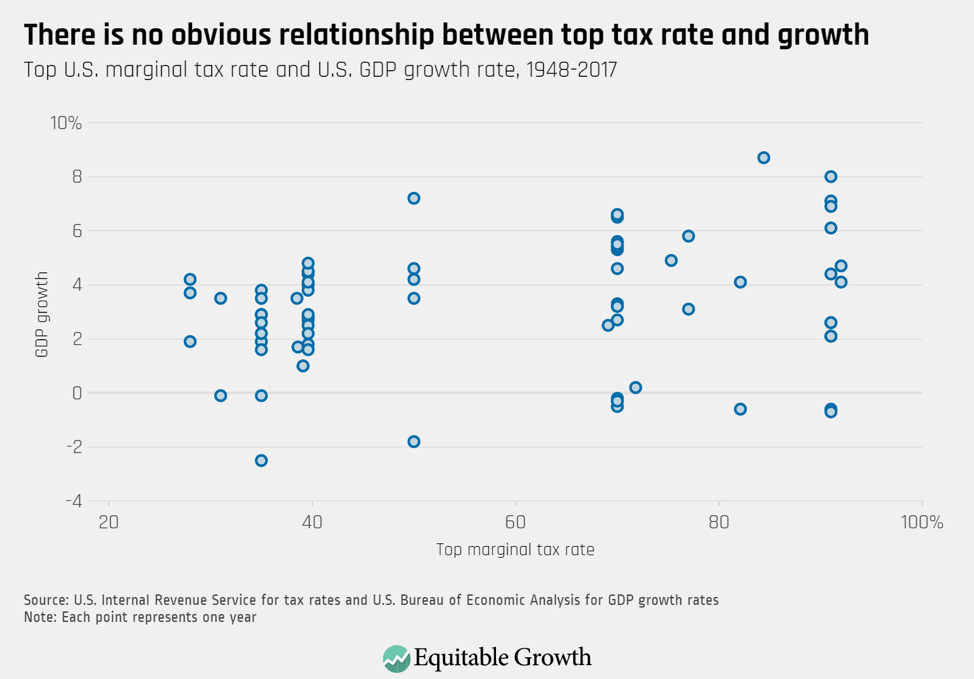
Today, firms are able to manipulate the functioning of the marketplace because economic inequality gives their owners the financial wherewithal to wield political influence. By exerting pressure on political processes, they can minimize the taxes on firms, owners of capital, and top-salaried workers. And they can rewrite laws and regulations in their favor. Research shows that lower taxes on those at the top of the income ladder do not lead to the kinds of beneficial outcomes some economists and policymakers suggest. The evidence is that when the rich pay less in taxes it encourages them to act in unproductive ways. (See Figure 5.)
Figure 5
When a firm has too much power in its product or services market, it has monopoly power, which means it can raise prices with impunity and stymie competition. Indeed, our economy is increasingly dominated by a few firms in many industries. In healthcare markets, the biggest healthcare companies are increasing their stronghold by merging and then charging higher prices, which in turn leads to higher profits for managers and shareholders alongside less affordable—and sometimes lower quality—healthcare for everyone else. It also means lower wages for those working increasingly in what economists call “monopsony labor markets,” where there’s only one or a handful of employers in a given market, giving these firms outsized wage-setting power. What’s happening in health care is emblematic of changes across our economy.
By subverting our economy in various ways, inequality undermines confidence that institutions of governance can deliver for the majority. But for the economy to function, the public sector needs to function, and function well. In the 19th and 20th centuries, the U.S. government implemented policies that launched many families with a solid financial foundation, including the Homestead Act, the estate tax, universal primary and secondary schools and land grant colleges across the nation, and the GI Bill. These policies weren’t perfect and were discriminatory in multiple ways, but they showed that the federal government could embark on big agendas to reduce inequality. Today, however, inequality in wealth and power is thwarting the government from taking on collective endeavors that provide the foundation for broad-based economic growth while promoting the interests of monopolists and oligopolists over others.
Inequality distorts both consumption and investment
Inequality distorts everyday decision-making by consumers and businesses. These outcomes are evident at the macroeconomic level. People’s spending drives business investment as consumers account for nearly 70 cents of every dollar spent in the United States. But for the past several decades, U.S. families in the bottom half of the income distribution have seen no income gains, and the gains for those families not among the top 10 percent of income earners have been meager. This means that if firms were to invest more, they may not be able to sell additional goods and services because consumers might not be in positions to buy them.
Many businesses, eyeing demand, have understandably not invested much over this period. U.S. firms are sitting on record-high piles of cash, which have been steadily accumulating since the 1980s. Others have found customers willing to purchase their wares, but only because of the financially unstable expansion of household debt—as seen especially in the run-up to the Great Recession in the middle of the last decade, and as is occurring again today. Growing economic inequality thus destabilizes spending because everyday consumers either don’t have enough money to spend or are borrowing beyond their means to buy what they need.
Inequality is even driving changes in what firms are producing, with a number of economic implications for innovation and even inflation. Xavier Jaravel at the London School of Economics finds that businesses are investing in new products targeted at high-end consumers while developing fewer products for those in the lower end of the market. For those at the low end, there’s less competition for their business, which means lower productivity, lower innovation, and higher prices and inflation. This shows up in the data: Jaravel found that between 2004 and 2013, families with incomes greater than $100,000 per year saw yearly prices rise by 0.65 percent less than for families earning below $30,000 in the respective bundles of goods that those families bought.
With consumption dragged down by flagging middle-class incomes, too much money in the hands of those at the top, and investors sitting on the sidelines, conditions are ripe for an increase in the supply of credit. The deregulation of the financial sector over the past 40 years has made it easier to lend to U.S. households—in no small part due to the influence of the financial services industry. Empirical research and the U.S. experience over the past several decades show the consequences of these distortions and how credit-driven economic growth both increases economic instability and leads to lost economic opportunity.
Solutions for economic inequality
Policymakers can preserve the best of our economic and political traditions, and improve on them, by pursing policies that can both reduce economic inequality and boost growth. The most critical steps are those that limit inequality’s ability to constrict our economy and tackle the ways that the concentration of economic resources translate into political and social power. The solutions start with addressing the subversions caused by inequality, which then creates the opportunity to remove obstructions and limit distortions in the broader economy. The market cannot function to benefit most Americans if it’s being subverted by the economic power of a small group at the top of the economic ladder.
Measure what matters
To properly design policy, lawmakers need the right measurement tools, otherwise they might be tempted to pass laws that raise average outcomes without actually helping families across the income spectrum. Yet many of the statistics we rely on to inform us about the state of our economy are measures of the mean and, in an era of rising inequality, are becoming less informative about the experience of the majority of people you represent.
To address this, Congress should require the U.S. Bureau of Economic Analysis to release growth data that is broken down by income group each quarter alongside Gross Domestic Product. By focusing less on an unrepresentative average for the U.S. economy and instead on how income gains are distributed, policymakers can ensure that no one is left behind, regardless of their zip code or demographics.
H.R 707, The Measuring Real Income Growth Act, introduced by Representative Carolyn Maloney, would disaggregate quarterly or annual GDP growth numbers, telling us how much of that growth accrued to low-, middle-, and high-income Americans. This would provide policymakers with a new tool to track the progress of the economy, evaluate how past policy is changing our economic fortunes, and guide future economic decision-making.
Increase bargaining power for workers
Policymakers must ensure there’s a bulwark against concentrated economic power by improving workers’ ability to bargain with employers over pay and working conditions. Civic institutions, especially unions, that once served as voices for everyday wage-earning workers have suffered a long decline. Unions were traditionally the most vocal and ardent advocates for the middle class, but now only 1 out of every 15 private-sector workers belongs to a union. In the early 1950s, a third of private-sector workers did.
New ideas for how to revitalize the U.S. labor movement and strengthen worker bargaining power abound. These include:
- Making it easier for workers to organize a union, including through reforms to the collective-bargaining process and stiffer enforcement and penalties for employers who violate the law
- Extending union contracts to non-union workers, a process that is widely used in similar countries and called sectoral bargaining
- Structurally incorporating unions into the policymaking process
- Making union membership the default status for many workers
- Allowing unions to manage public benefits, such as unemployment insurance
- Privileging firms that cooperate well with unions in government contracting and other arenas
- Launching a global agreement modeled on the Paris Climate Accord that explicitly targets higher unionization rates
Any of these policy proposals could improve U.S. workers’ ability to bargain with employers over pay and working conditions.
It’s no accident that, back when unions were strong, the fruits of U.S. economic growth were more broadly distributed to unionized and non-unionized workers alike. Solutions will require not only reinvigorating civic institutions—be they in formal unions or other kinds of worker solidarity organizations—but also addressing how the legal landscape has become increasingly hostile to non-corporate civic engagement. Business associations and their allies in politics pushed through so called “right-to-work” laws that restrict collective bargaining, and have filed serial successful lawsuits designed to cripple unions’ ability to fund their activities. Restoring balance will require rethinking these policies.
Increase the minimum wage
Increasing the minimum wage is vital to raising living standards at the bottom of the income spectrum and for the most disadvantaged workers. Research indicates that higher minimum wages helps workers in a multitude of ways, by lowering the poverty rate, increasing earnings for low-wage workers, and decreasing public expenditures on welfare programs.
The minimum wage also plays an important role in decreasing earnings disparities for disadvantaged groups. The expansion of the federal minimum wage to cover additional industries in the 1966 Federal Labor Standards Act explained 20 percent of the reduction in the black-white wage gap during the Civil Rights era. And the poverty rate for black and Hispanic families would be around 20 percent lower had the minimum wage remained at its 1968 inflation-adjusted level and not been allowed to languish and atrophy for years.
Previous generations of economists were concerned that minimum wage increases could harm employment, but there is ambiguous or no evidence for this conjecture. New, high-quality research concludes that raising the minimum wage increases incomes at the bottom without costing jobs—whether that research examined administrative data sources that follow workers over several years, conducted meta-analysis of 138 different minimum wage increases, or examined the U.S. cities that have pushed their minimum wages higher than any others.
Address monopoly power
The U.S. economy is increasingly dominated by a fewer firms, meaning higher profits for shareholders but higher prices and lower wages for typical U.S. families—especially as workers face monopsony labor markets in which firms have the power to set low wages. There must be rules that ensure that those with the most economic power cannot subvert the market to benefit themselves at the expense of workers and consumers. Congress needs to clarify that antitrust laws protect competition—in all of its forms, not simply where it affects consumer prices. In cases of uncertainty, the laws should favor competition over concentration.
Attending to the issue of monopsony would be a new and crucial step for antitrust regulators. As a way to start, policymakers should consider how mergers affect labor markets. A merger between two companies that are ostensibly in different markets (and thus would be swiftly approved) might in fact be anticompetitive because they compete for the same employees.
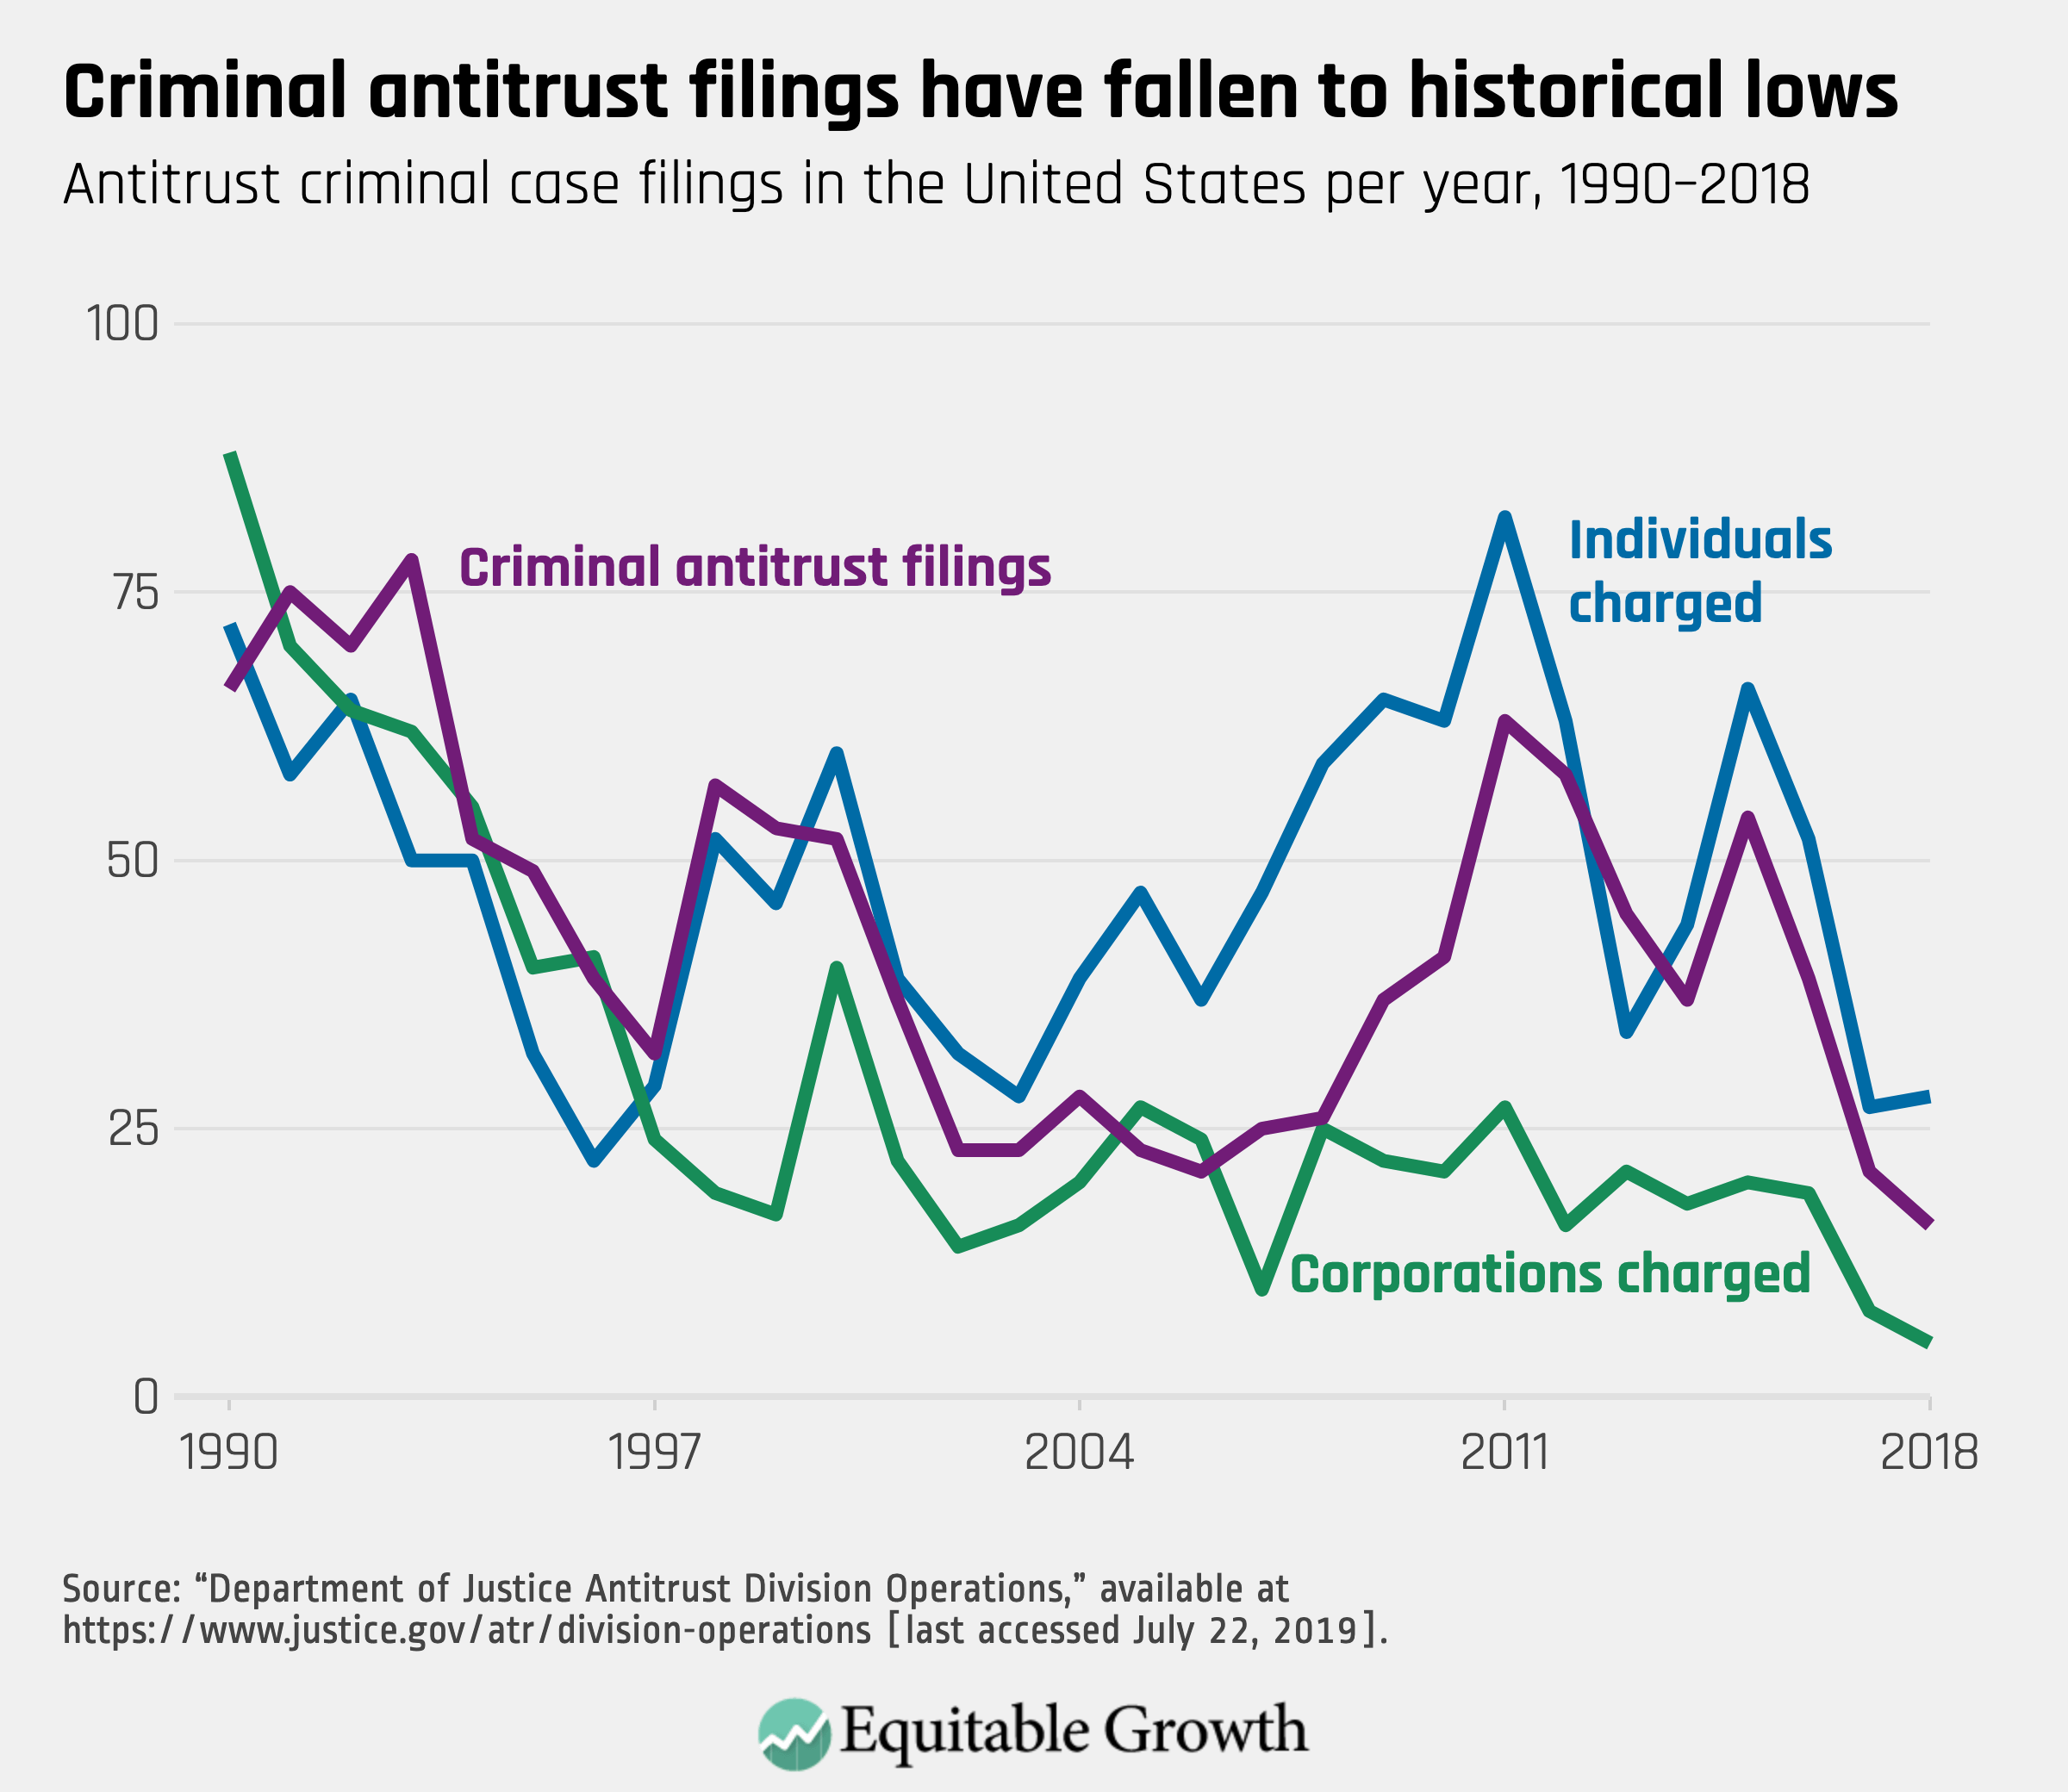
On top of everything else, in recent decades federal antitrust enforcers have not had the resources they need to do their job of preventing anticompetitive consolidation. Since 2010, the number of requests for merger reviews filed at the two federal antitrust agencies has increased by more than 50 percent, but appropriations to the agencies that enforce the antitrust laws have fallen precipitously in real terms. (See Figure 6.)
Figure 6
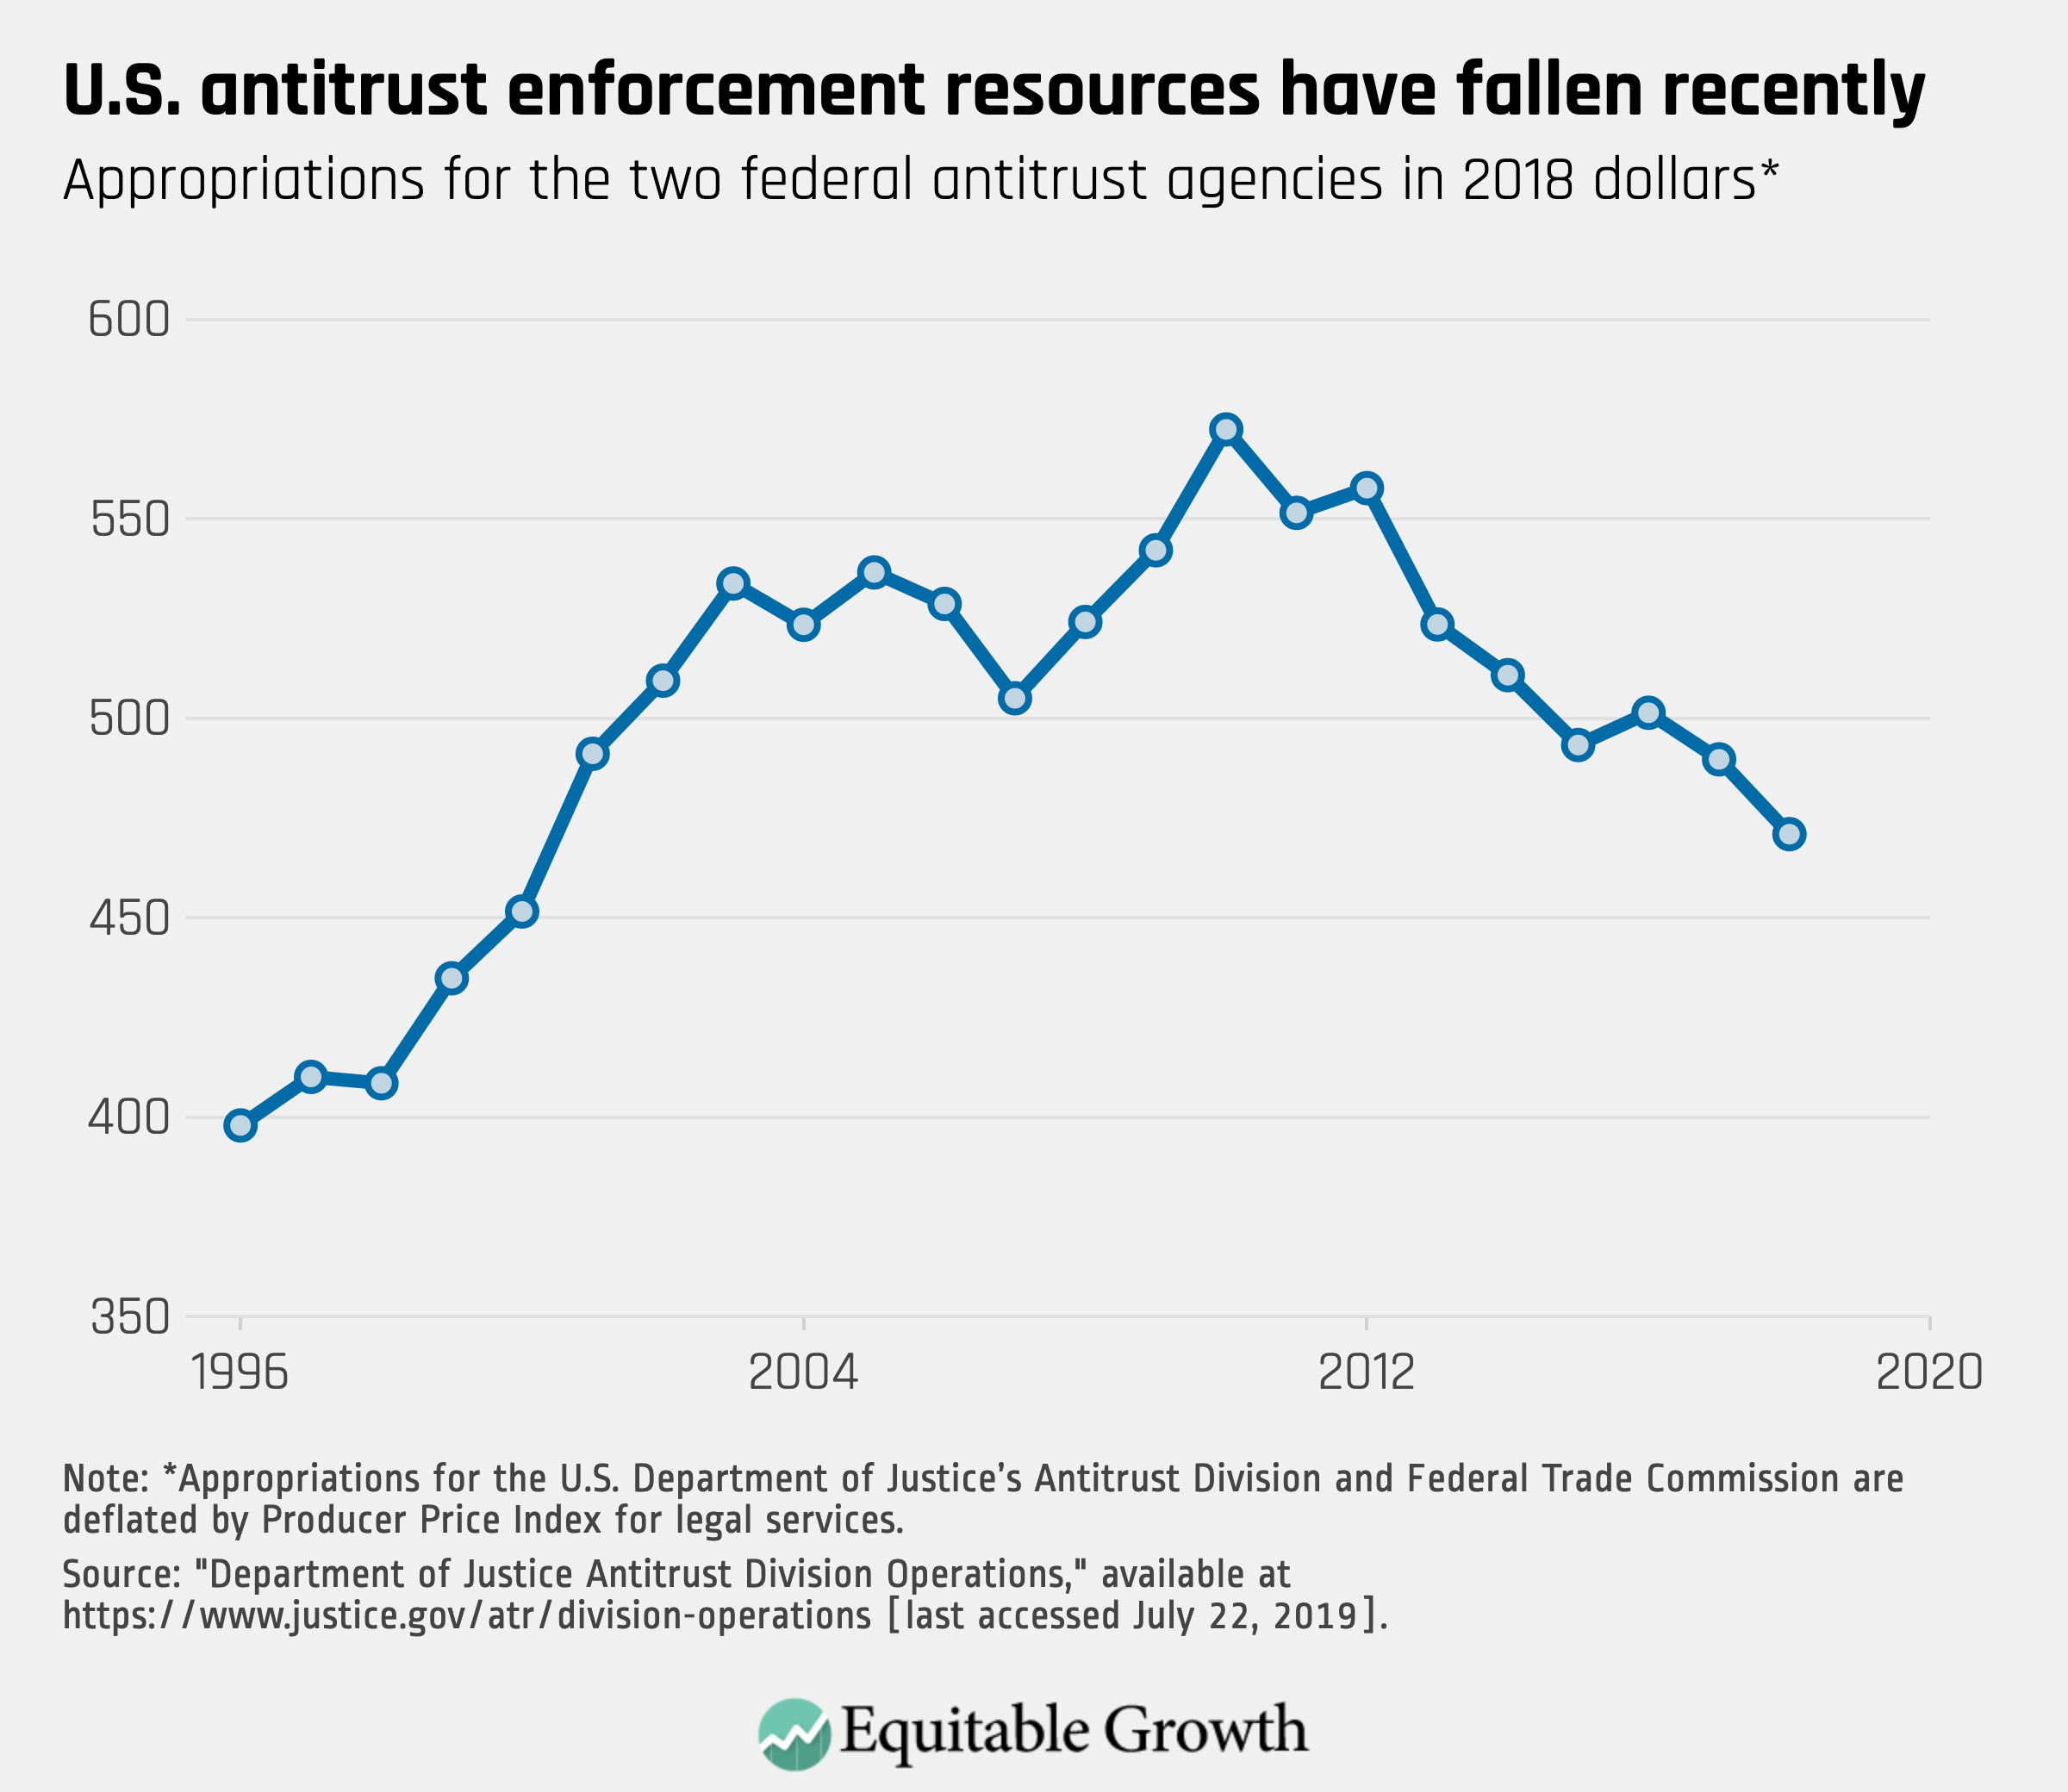
Not surprisingly, despite the wave in mergers, there has been no increase in merger enforcement. Research shows that merger enforcement has narrowed its focus to mergers at the highest levels of concentration and permitted more consolidation. Between 2008 and 2011, there were exactly zero enforcement actions taken for mergers that would result in more than four significant competitors in the industry. Congress should ensure that enforcers have the resources they need to do their jobs.
Tax wealth
It is clear what kinds of policies will worsen all the trends discussed here. The Tax Cuts and Jobs Act of 2017 was sharply regressive, with high-income families enjoying larger tax windfalls in both the short- and long-term than low- and middle-income families.
Proponents claimed the new tax law would boost wages by $4,000 per year. But there is no evidence to suggest such an increase is coming. Despite the already strong economy, inflation-adjusted wage growth has been moderate at best in the nearly two years since the law was passed. Proponents claimed that the law would lead to a boom in business investment in things such as factories and technology, but the modest increase in investment in 2018 relative to trend was primarily the result of fluctuations in oil prices. Investment has already declined from that modest level in 2019. Instead, it is clear that corporations have used their tax windfall to give out a record $1 trillion-plus in stock buybacks in 2018.
Policymakers have room to raise taxes at the top of the income ladder and, indeed, empirical analysis indicates that this will likely have economic benefits above and beyond raising revenue. The top marginal income tax rate is now less than half what it was in the mid-20th century, which has allowed individuals at the top to accumulate wealth and power far beyond what previous generations of wealthy Americans could amass. Nobel Prize winning economist Peter Diamond and Saez found that the United States could have approximately doubled the tax burden on the top 1 percent of income earners in 2007, and that “would still leave the after-tax income share of the top percentile more than twice as high as in 1970.”
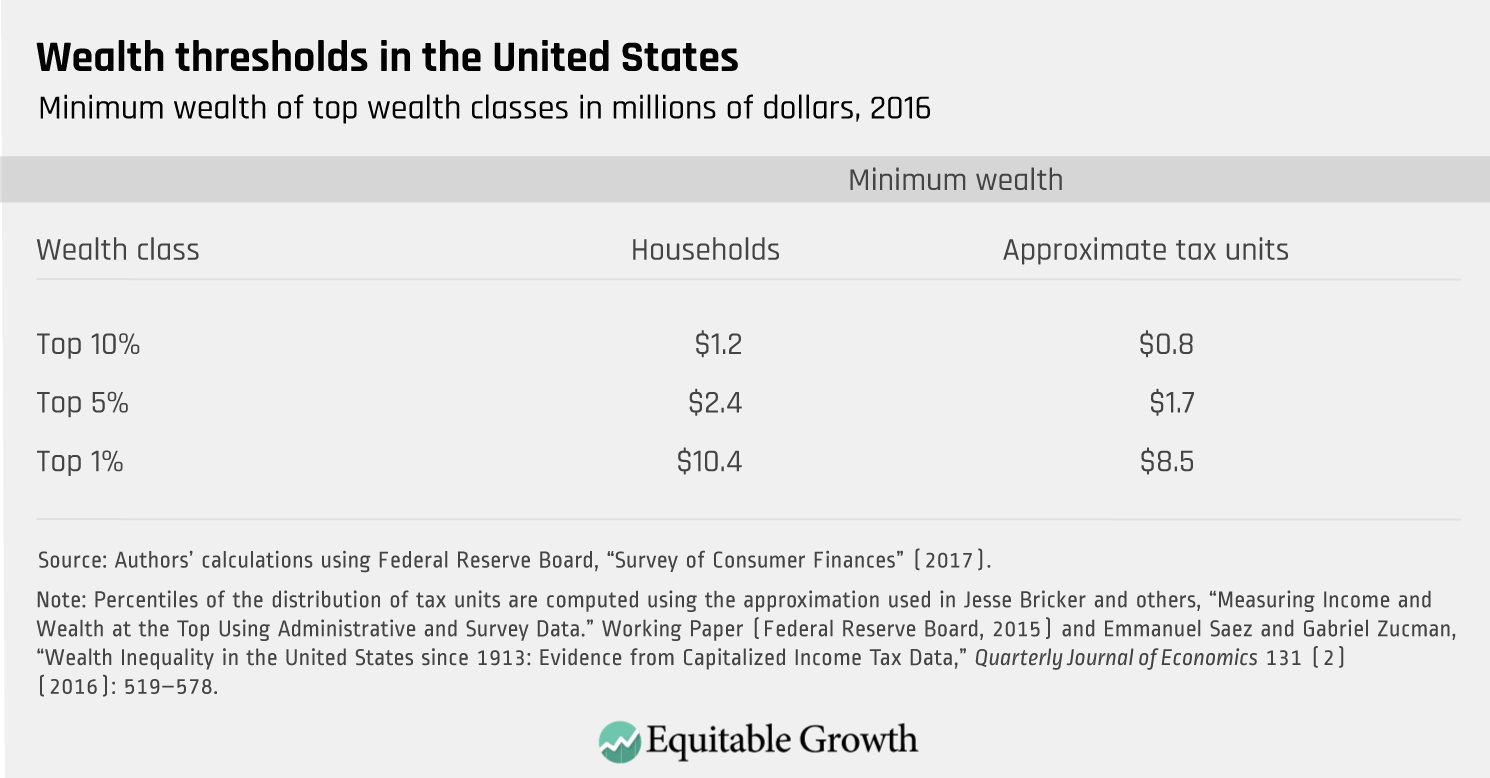
Given that the top one percent controls more than 40 percent of U.S. wealth, and these fortunes have been amassed in part by utilizing tax shelters and preferential rates only available to the truly well-off, one avenue to focus on is how to tax wealth more and better. (See Table 1.)
First, capital gains taxes are too easy to avoid. Under current law, capital gains and losses are taxed only when the gain or loss is realized, generally when the underlying asset is sold. Some assets are passed on to heirs at death and are never taxed. Instead, lawmakers could implement a system of mark-to-market taxation where investors would pay tax on the increase in the value of their investments each year. Switching to a system such as this would equalize the tax treatment of income from labor and income from capital, making the tax system more progressive, efficient, and fair. It could even include a high exemption so that it only applies to the truly well-off.
Second, policymakers could make it harder for corporations to avoid taxation by shifting income across international borders by moving to either a destination-based tax system or imposing a global minimum tax (higher than the one imposed in the Tax Cuts and Jobs Act of 2017).
Third, federal lawmakers could impose a new net worth tax on very wealthy individuals, which could function similar to net worth taxes in other countries and be a more comprehensive version of the property taxes levied on the state and local level. Because wealth is so unequally distributed, a tax with a very high exemption could still raise hundreds of billions of dollars for needed investments.
Table 1
Enable all children to thrive at an early age
Investments in people—through education, training, and care—are as important to the economy as physical capital, something that economists have recognized since the 1960s. Today, we need a national commitment not only to ensure equal access to primary and secondary school but also to end unequal access to early childhood education and care. Early childhood education must be paired with a sensible policy on childcare. The primary source of federal funding for childcare subsidies for low-income working families is the Child Care Development Fund, but this reaches only about one in six eligible children. Ideas for improving access to childcare include expanding subsidies to ensure that no family pays more than a reasonable share of its income—perhaps seven percent. Reforms should also be paired with measures to improve the wages of childcare workers, and in doing so boost the quality of that care.
Congress can address some of the well-documented inequities in child health, mortality, and basic resources by making sure that programs such as SNAP, Medicaid, WIC are protected from cuts and work requirements. Work requirements have been shown by research to lower the effectiveness of these programs by, among other things, burying participants in red tape and confusing eligibility requirements.
Allow workers to manage their lives
Over the course of their careers, most workers will experience a life event—whether it is a serious personal medical issue, the birth of a child, or the need to care for a loved one who is ill—that they will need to address outside of work. But currently, the Family and Medical Leave Act of 1993 falls far too short, providing unpaid leave to only 60 percent of workers. Paid leave provides the right to time off with pay so that workers can continue to cover the electricity bill and put food on the table while they focus their attention on addressing their needs or the needs of their family members. Six states have put in place statewide paid-family-leave programs (and soon the District of Columbia), which ensure that any parent, not just one at a high-income level, can spend time with a new baby or a seriously ill child and have income support. These existing models are replicable on the federal level.
Further, most low-income parents do not have access to the work-life scheduling policies and support they need to address conflicts between work and caring for young children. Modern retail and warehousing scheduling practices are not the inevitable consequence of technological change or market necessities. Rather, employers are using new scheduling technology as a tool when they engage in a well-documented phenomenon in the labor market called “risk shifting.” As worker bargaining power has weakened and American ideas about individual responsibility have changed since the 1970s, employers have increasingly shifted economic risk from business owners and shareholders to workers. This “risk” is often thought of as changes to worker compensation and job security, but changes in scheduling practices also are a key dimension of risk shifting.
Today, employees’ schedules are highly responsive to employers’ perceptions of the ebbs and flows of consumer demand. As a result, their schedules are irregular and unpredictable. When employers treat workers as widgets to be used or discarded erratically, what are the consequences for worker well-being? Economists Danny Schneider at the University of Cailfornia, Berkeley and Kristen Harknett at UC-San Francisco show that just-in-time schedules are associated with psychological distress and poor sleep, while other research points to unpredictable scheduling harming workers’ children’s outcomes.
Sustainable and productive investment
Policymakers should make greater investments in large-scale projects, such as upgrading the nation’s failing transportation infrastructure, addressing climate change, and investing in people and families. These projects encompass traditional investments in water and transportation as well as developing the technology to limit the emission of greenhouse gases and to address the consequences of climate change. There’s a comprehensive agenda to be enacted to make investments in the development and deployment of green energy, in mitigating the adverse effects of climate change on our food supplies, and to assist communities upended by the rising prevalence of climate change-induced natural disasters.
Without additional revenue, government cannot make these critical investments and the public knows that public investments are important and lacking. A majority of Americans say that poorly maintained schools are a threat to our children, and a majority think that all Americans are endangered by the poor quality of our drinking water infrastructure. A Harvard-Harris Poll in 2017 found, more emphatically, that 84 percent of Americans want to invest more in infrastructure, and 76 percent agree that government should be at least partially responsible for that investment. Governments, within reason, need to spend and regulate to encourage growth, not simply cut and run. The long-term decline in revenue has starved resources that can be directed to critical public investments.
Conclusion
When we start from a focus on who gains from rising economic prosperity, we see that rising economic concentration in income, wealth, and firms constricts growth and productivity by obstructing access to those not already at the top, subverting the institutions that manage the market, and destabilizing the macroeconomy through distorting both consumption and investment. This Committee has a vital role in resetting our national policies and making sure that our economy is not longer bound by inequality. Thank you for again allowing me to testify on this topic today.