Brad DeLong: Worthy reads on equitable growth, June 21–27, 2019
Worthy reads from Equitable Growth:
- If you did not read this when it came out 5 years ago—or if it is not fresh in your brain—you need to read or reread it today. Emmanuel Saez and Gabriel Zucman, “Exploding Wealth Inequality in the United States,” in which they write: “Income inequality has been on the rise … [with a] large portion of this increase is due to an upsurge in the labor incomes earned by senior company executives and successful entrepreneurs. But is the rise in U.S. economic inequality purely a matter of rising labor compensation at the top, or did wealth inequality rise as well? … (Hint: the answer is a definitive yes, as we will demonstrate below) … Currently available measures of wealth inequality rely either on surveys (the Survey of Consumer Finances of the Federal Reserve Board), on estate tax return data, or on lists of wealthy individuals, such as the Forbes 400 list of wealthiest Americans.”
- If you did not read Austin Clemens and Heather Boushey a year ago on the need to track growth not just for the economy as a whole but for Americans at every point along the income curve, you should go do so. Read Austin Clemens and Heather Boushey, “Disaggregating Growth,” in which they write: “Measuring who prospers when the economy grows … The National Income and Product Accounts, or NIPA (also referred to as System of National Accounts, or SNA, outside of the United States), were a radical advance in economic measurement when they were instituted in the early 20th century. These accounts track aggregate output and income for the national economy. Most notably, they measure Gross Domestic Product and the quarterly fluctuations in GDP that tell us if the economy is growing or contracting. Before their advent, ascertaining the health of the economy was an inexact and patchwork procedure.”
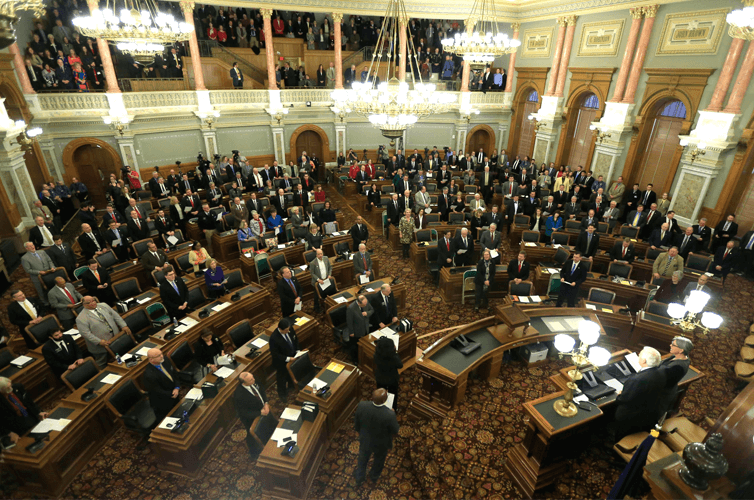
- Great conversation between Heather Boushey and Emmanuel Saez. My favorite highlights from “In Conversation with Emmanuel Saez” are: “Kansas … illustrates beautifully from a research perspective even though it’s a disaster in terms of public policy … tax avoidance … pass-through businesses … huge incentives for high-income earners to reclassify … a big erosion of the wage income tax base in the state … a much bigger negative impact on tax revenue than would have been predicted mechanically …When governments have actually to balance their budgets, they realize that taxes are useful, and that brings the two pieces of the debate together … Certainly Kansas didn’t experience an economic boom.”
Worthy reads not from Equitable Growth:
- All signs are that when the next recession comes, the deficit hawks will reappear in full force. But the bust is not the time for austerity: Read Alan Taylor from 2013, “When Is the Time for Austerity?” in which he wrote: “Recent austerity policies have been guided by ideology rather than research … Matching methods based on propensity scores show how contractionary austerity really is, especially in economies operating below potential … Austerity has a … larger and more statistically significant negative effect in the slump. In booms, which one could view as the ‘full employment’ case, we find smaller (and mostly statistically insignificant) impacts of fiscal consolidation on output.”
- There are still no signs of any acceleration in measured productivity growth from the low “new normal” that emerged with the financial crisis of 2007–2009. Least of all are there signs of an acceleration in investment and productivity growth produced by the late-2017 McConnell-Ryan-Trump tax cut. Moreover, the growth rate of the labor force now falls off of a demographic cliff. If there were a moment over the past two and a half centuries when we would like, for the economy’s sake, for immigration to be higher than usual, it is now. Read John Fernald and Huiyu Li, “Is Slow Still the New Normal for GDP Growth?,” in which they write: “The new normal pace for U.S. [Gross Domestic Product] growth remains between 1.5 percent and 1.75 percent, noticeably slower than the typical pace … The slowdown stems mainly from demographic trends that have slowed labor force growth … A larger challenge is productivity. Achieving GDP growth consistently above 1.75 percent will require much faster productivity growth.”
- The top 0.01 percent of American workers—now some 15,000—this year have incomes, including capital gains, of about 500 times the average income of about $800 a day. Those 15,000 workers in the top 0.01 percent of income this year have an average income of $400,000 a day. How could one go about spending that? Suppose you decided this morning that you wanted to rent the 2,000 square-foot Ritz-Carlton suite at the Ritz-Carlton San Francisco hotel for the week of next Memorial Day, and did so. That would set you back $6,000 for seven nights. You would still have to spend $394,000 more today to avoid getting richer. In fact, to avoid getting richer, you would have to spend $16,667 an hour, awake and asleep, day in and day out. And then there are the rest of the top 0.1 percent—135,000 people, of whom each one, on average, is one-ninth as well-off as the top 0.01 percent and who must spend and reinvest not $400,000 but $45,000 a day. Read Paul Krugman, “Notes on Excessive Wealth Disorder,” in which he writes: “What’s really at issue here is the role of the 0.1 percent, or maybe the 0.01 percent—the truly wealthy, not the $400,000 a year working Wall Street stiff, memorably ridiculed in the movie Wall Street. This is a really tiny group of people, but one that exerts huge influence over policy … Raw corruption … Soft corruption … Campaign contributions … Defining the agenda … For me and others … [this is] a kind of radicalizing moment, a demonstration that extreme wealth really has degraded the ability of our political system to deal with real problems … [and] the [result of the] extraordinary shift in conventional wisdom and policy priorities that took place in 2010–2011, away from placing priority on reducing the huge suffering still taking place in the aftermath of the 2008 financial crisis, and toward action to avert the supposed risk of a debt crisis.”