JOLTS Day Graphs: April 2019 Report Edition
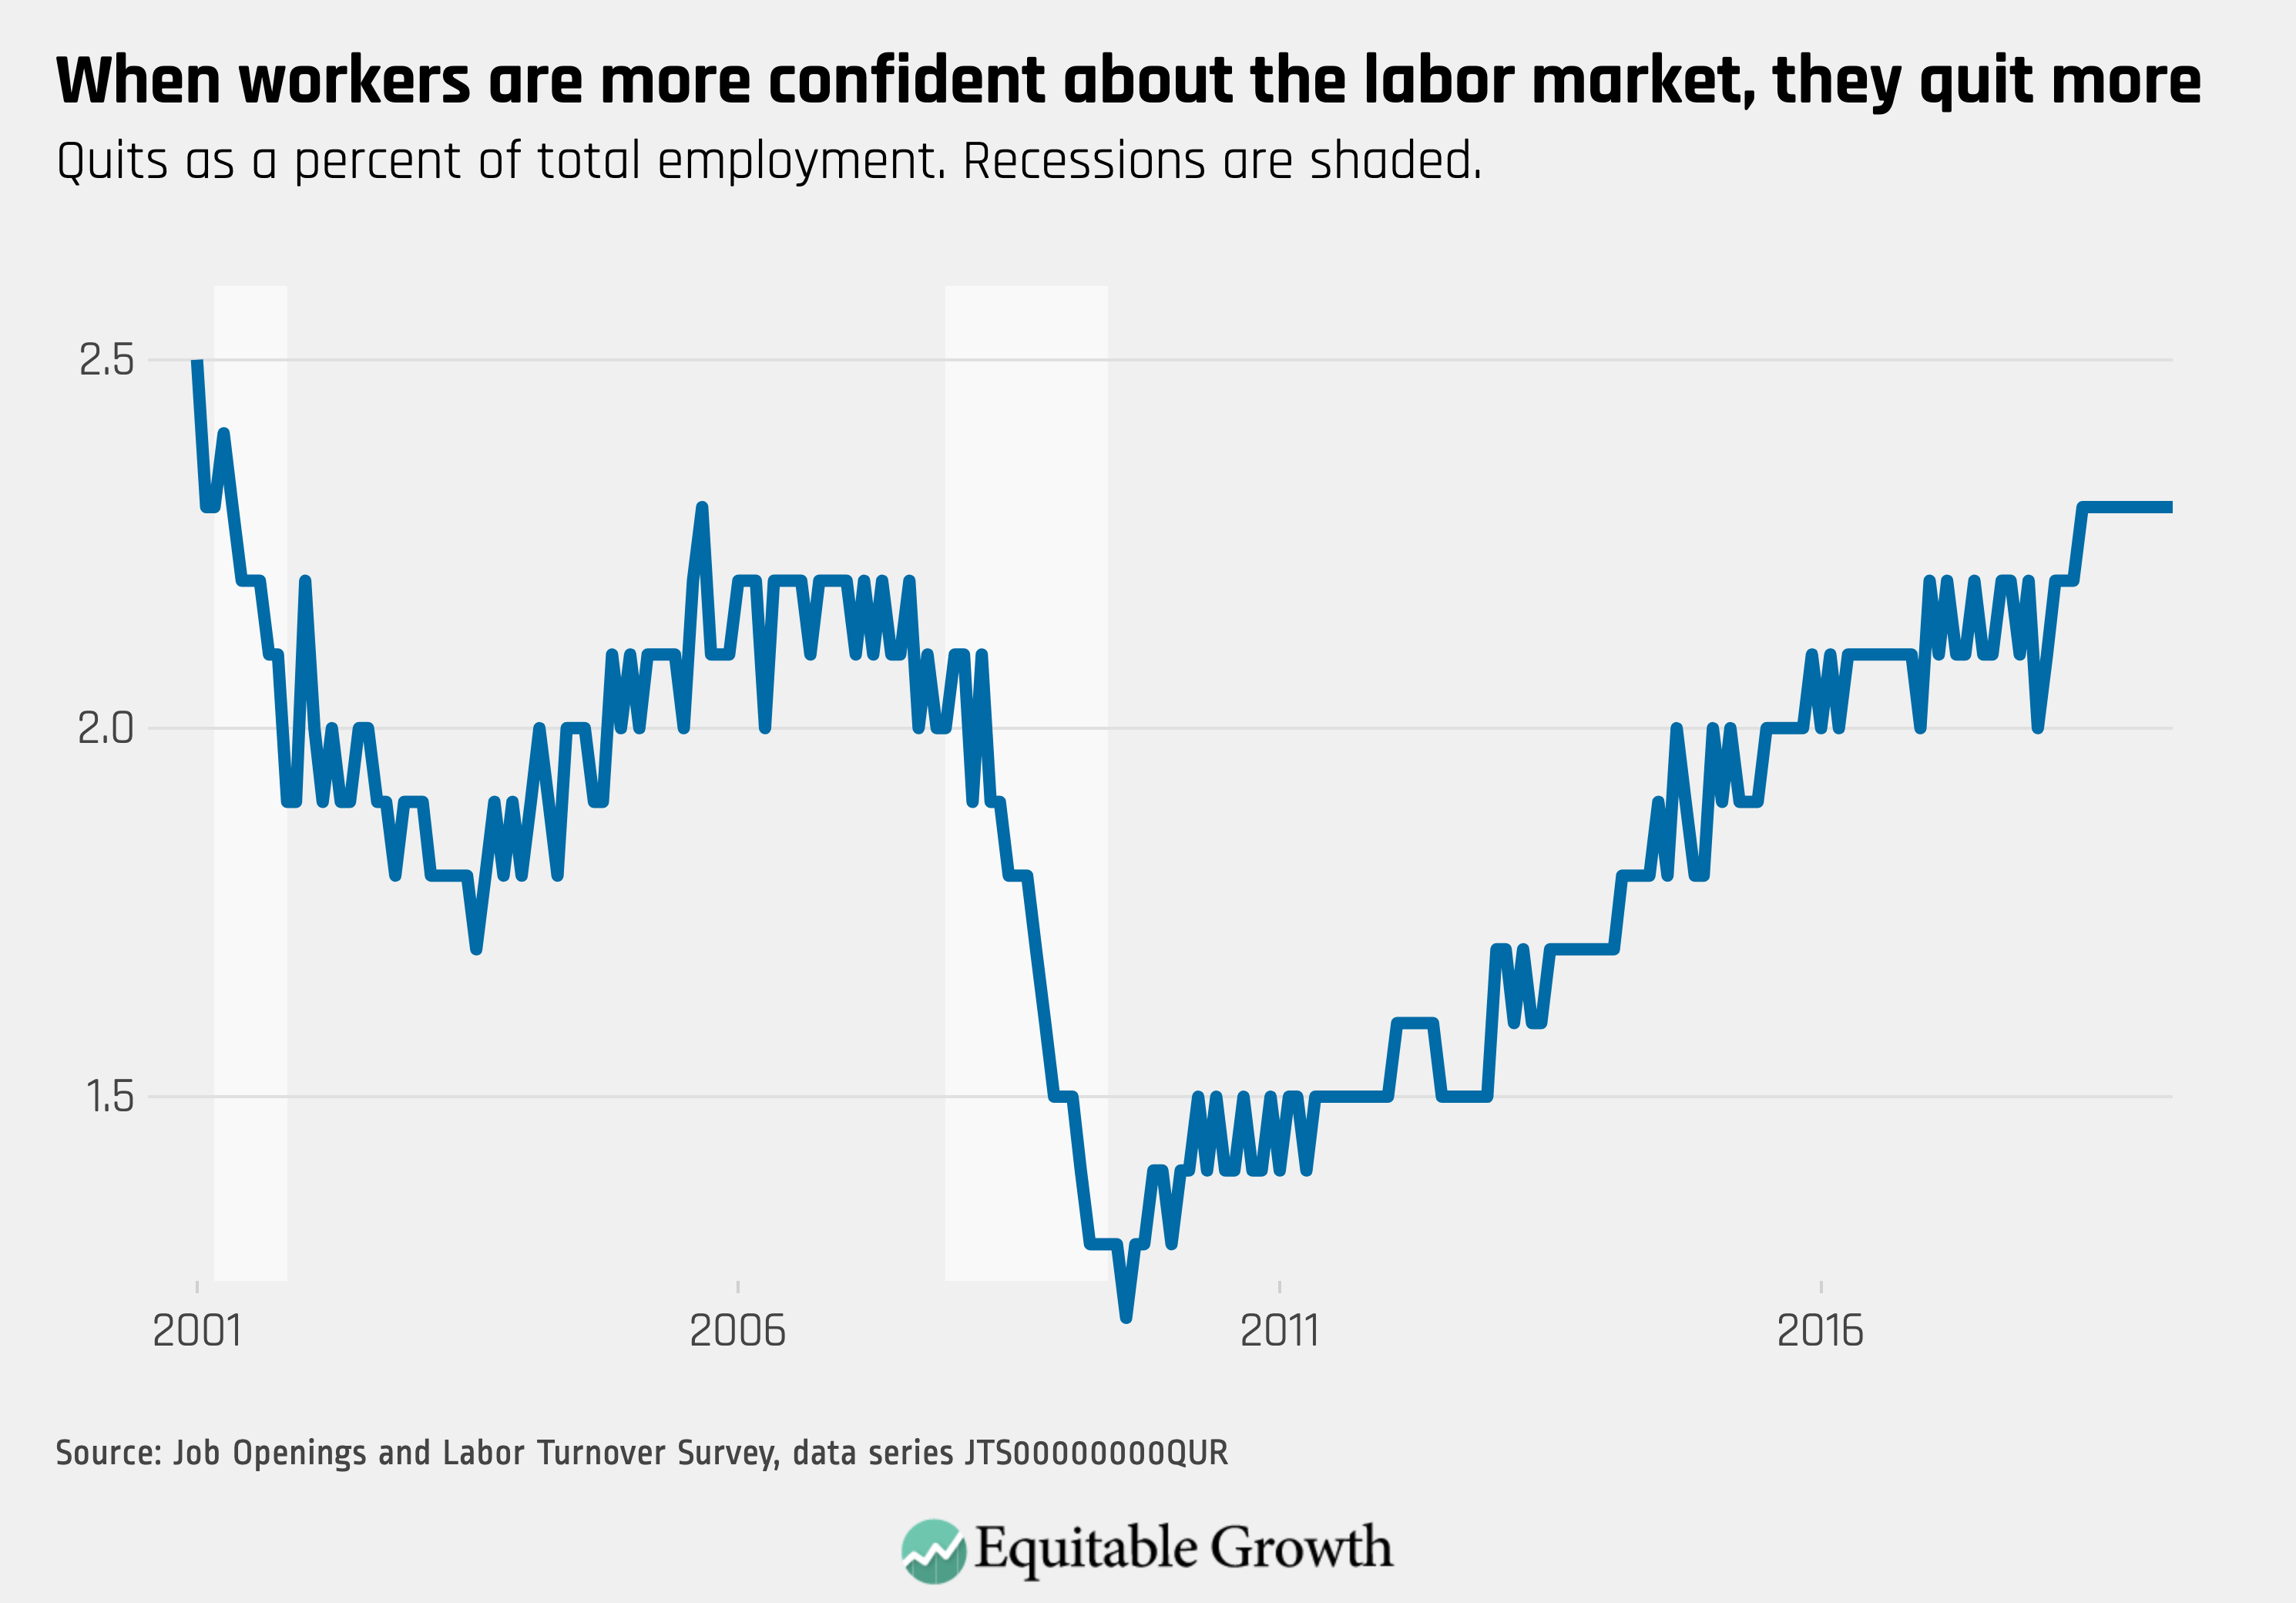
Every month the U.S. Bureau of Labor Statistics releases data on hiring, firing, and other labor market flows from the Job Openings and Labor Turnover Survey, better known as JOLTS. Today, the BLS released the latest data for April 2019. This report doesn’t get as much attention as the monthly Employment Situation Report, but it contains useful information about the state of the U.S. labor market. Below are a few key graphs using data from the report.

1.

The quit rate has held steady at 2.3% for 11 months, signaling worker confidence in the labor market.
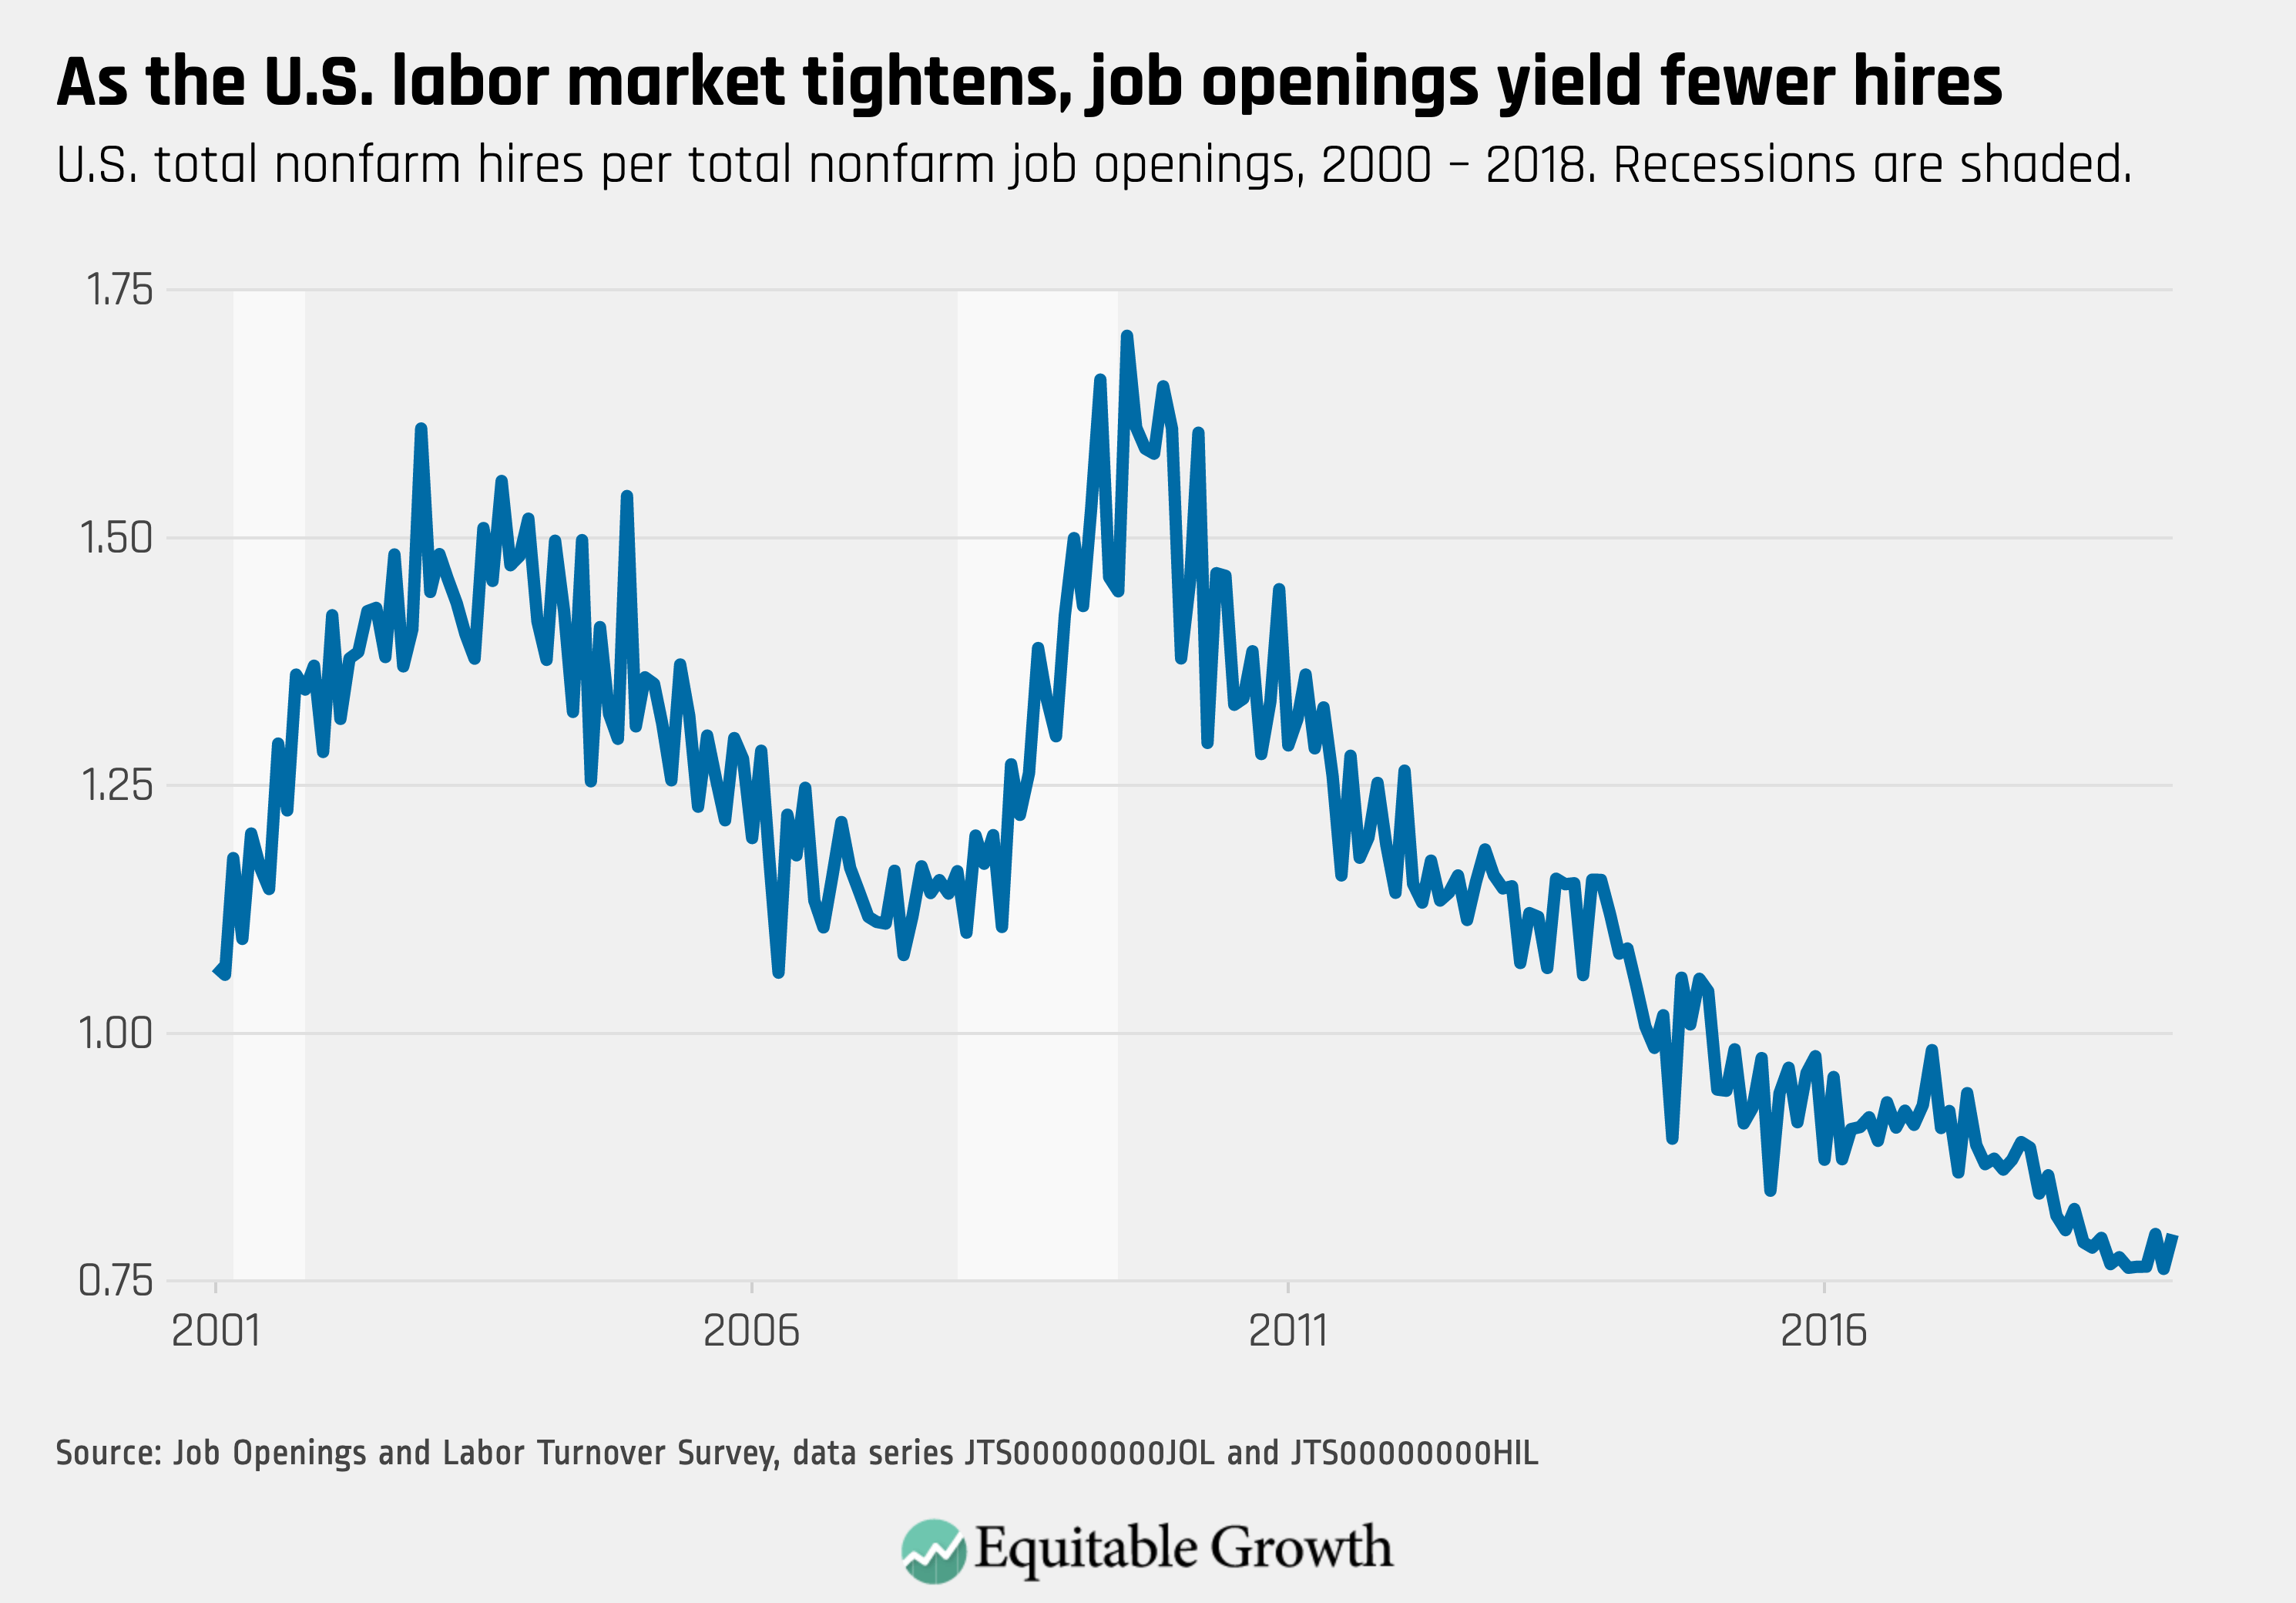
2.

The ratio of hires to job openings increased slightly in April, as hires reached a series high of 5.9 million.
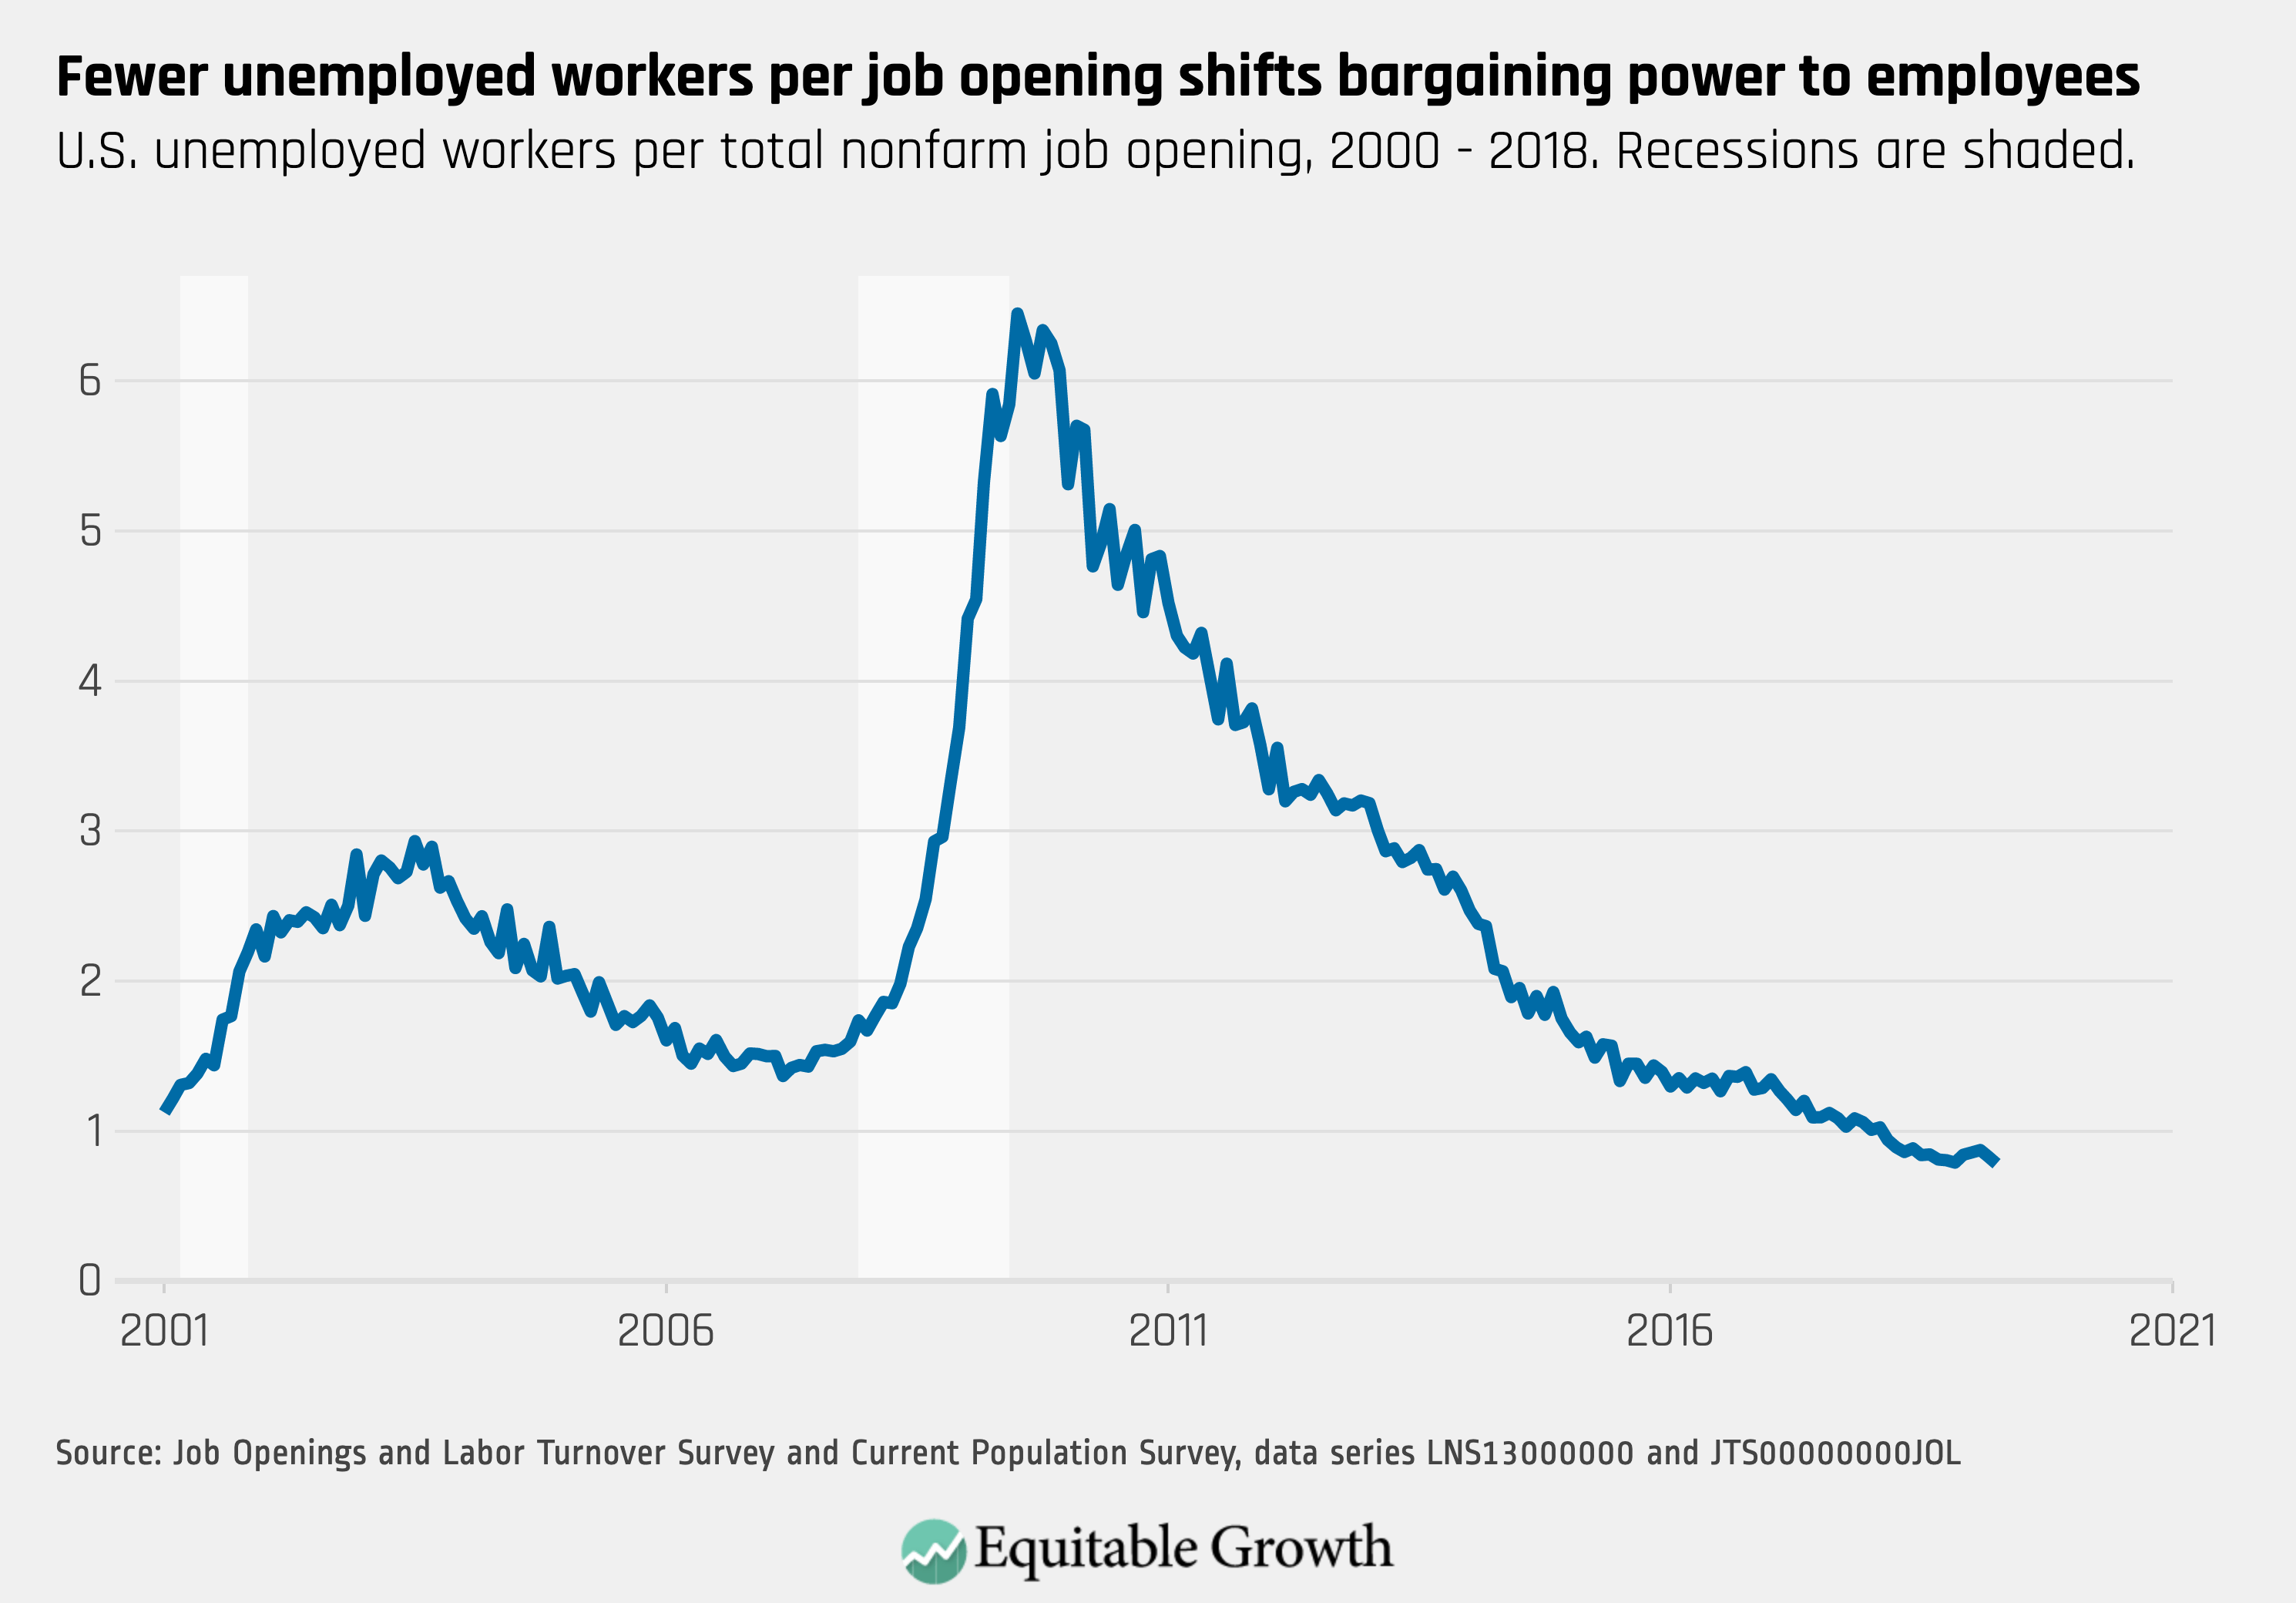
3.

The ratio of unemployed workers to job openings hit a new low of 0.78, with fewer than one person looking for a job for each open position.
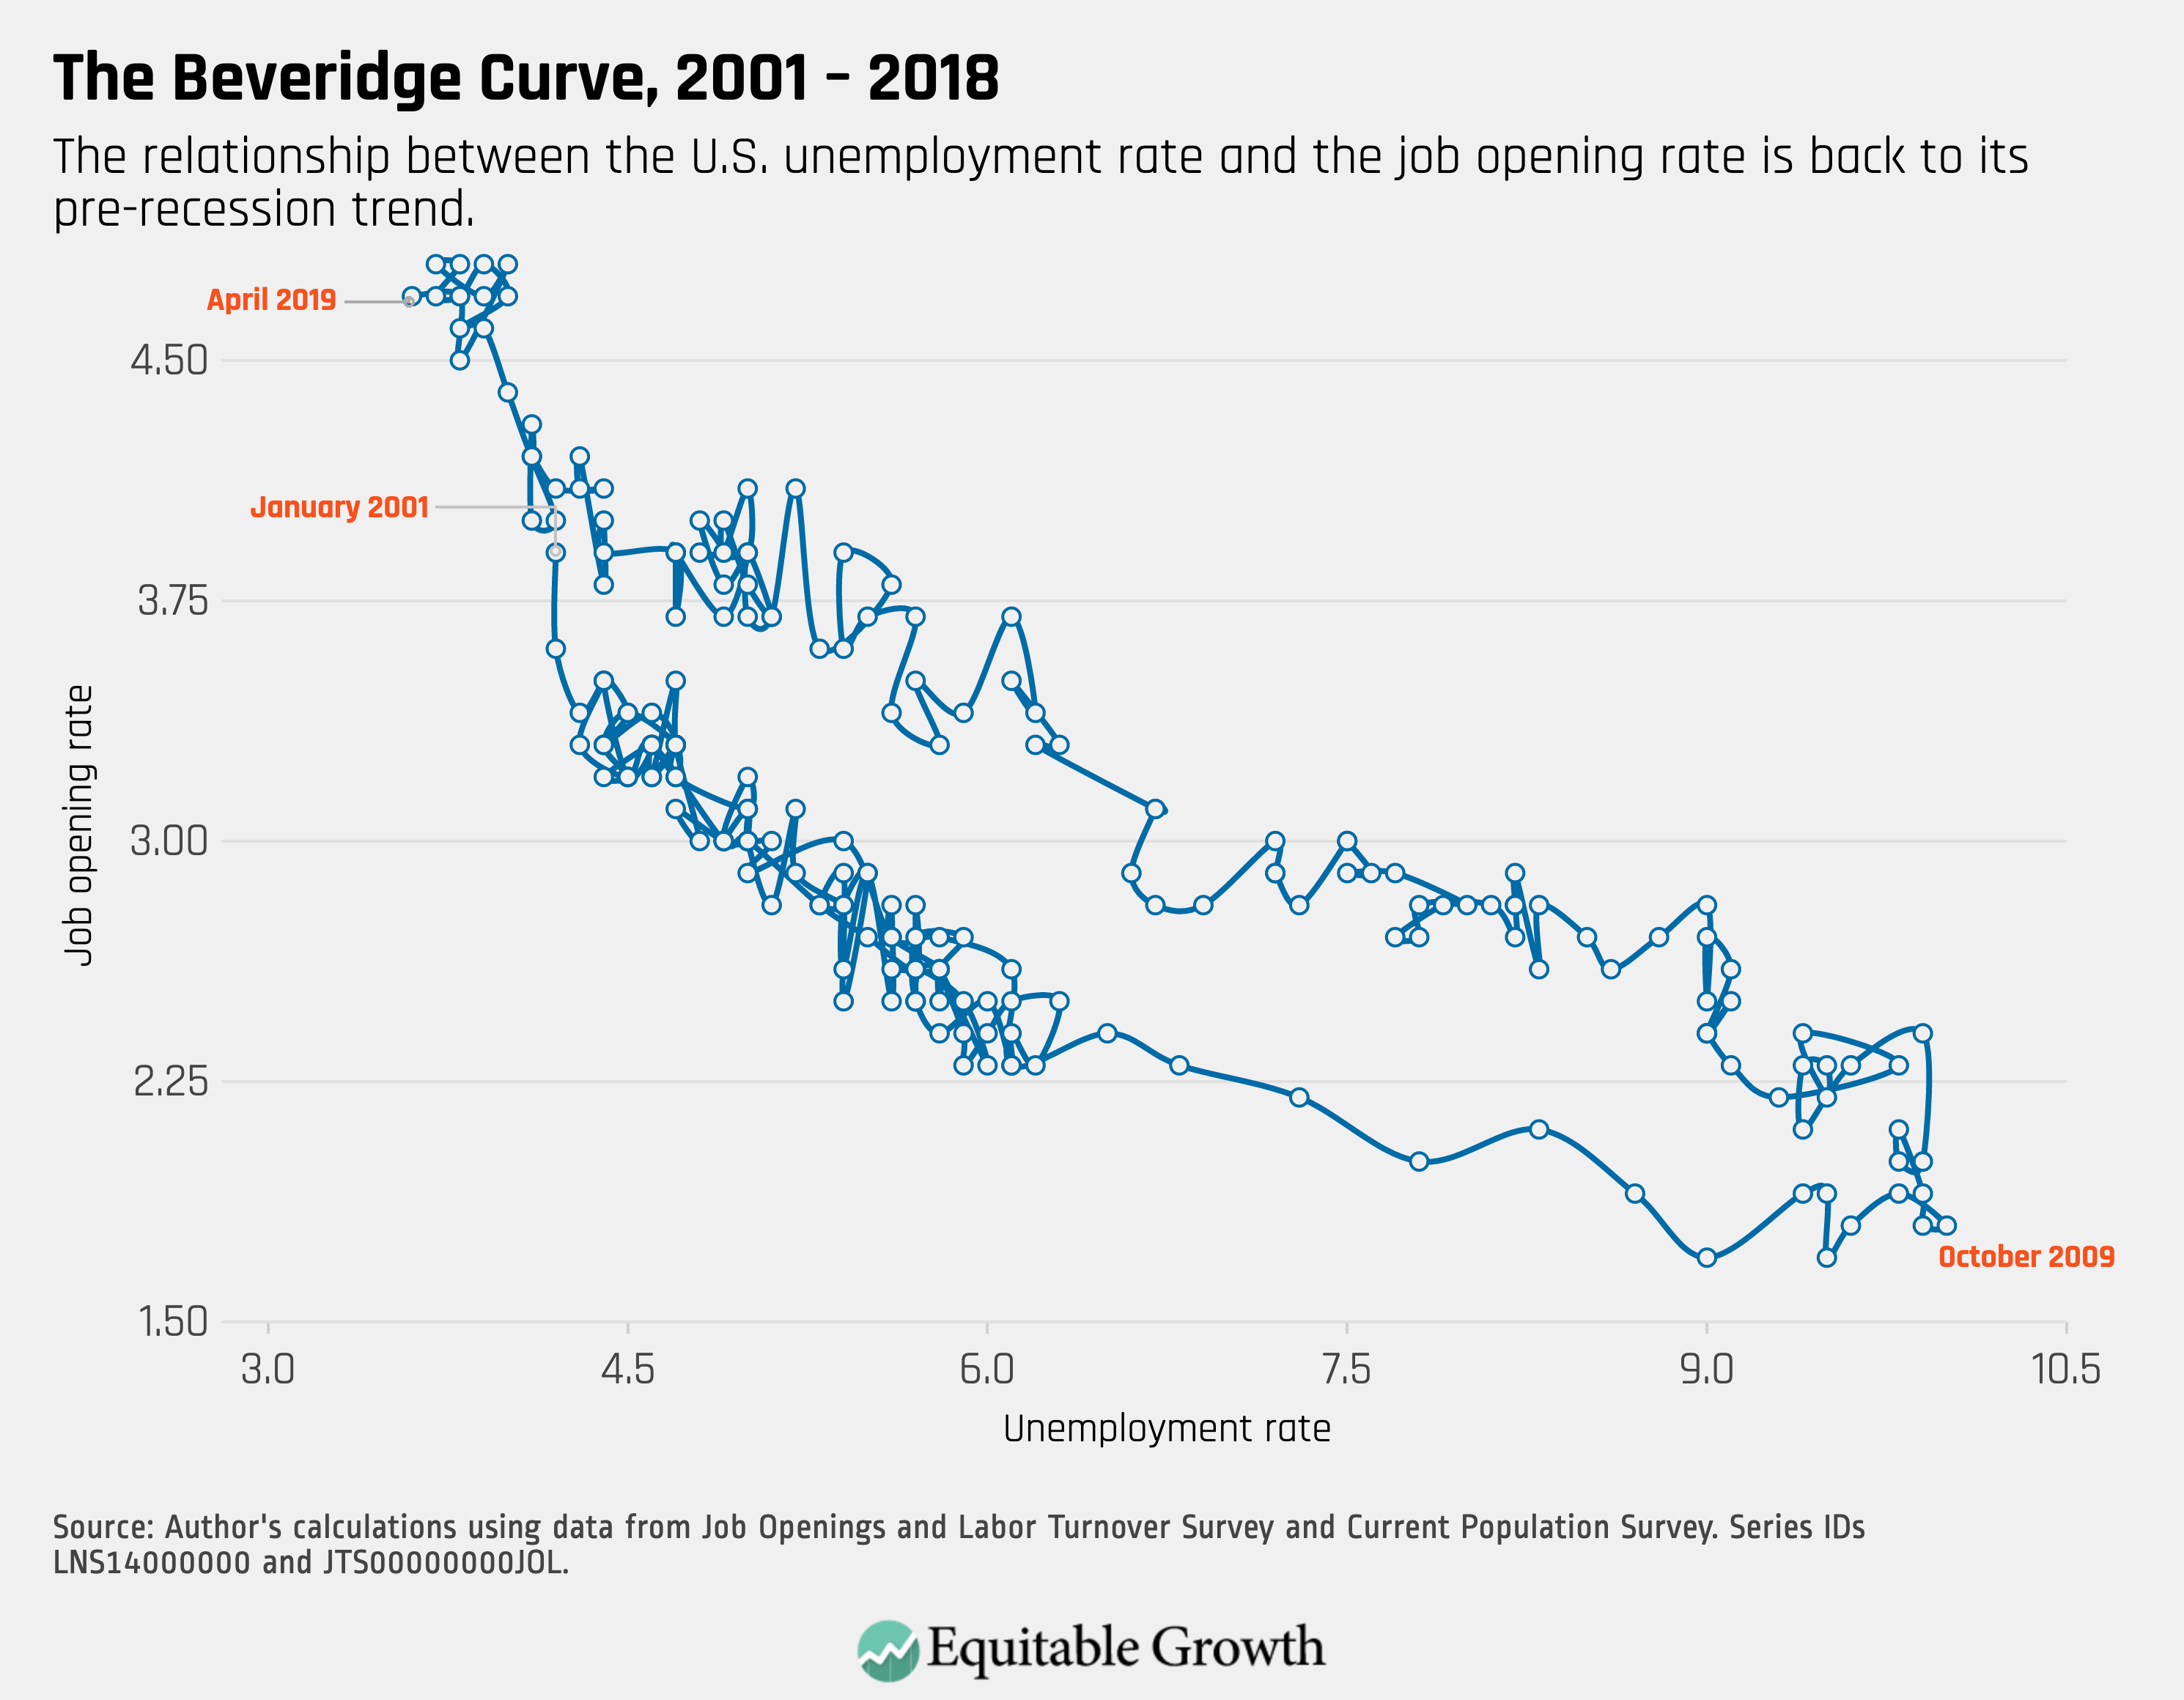
4.

The Beveridge Curve continues its expansion, hovering around the same level for the past year.

Connect with us!

Explore the Equitable Growth network of experts around the country and get answers to today's most pressing questions!

Get in Touch