Congress adopts historic prescription drug pricing reform

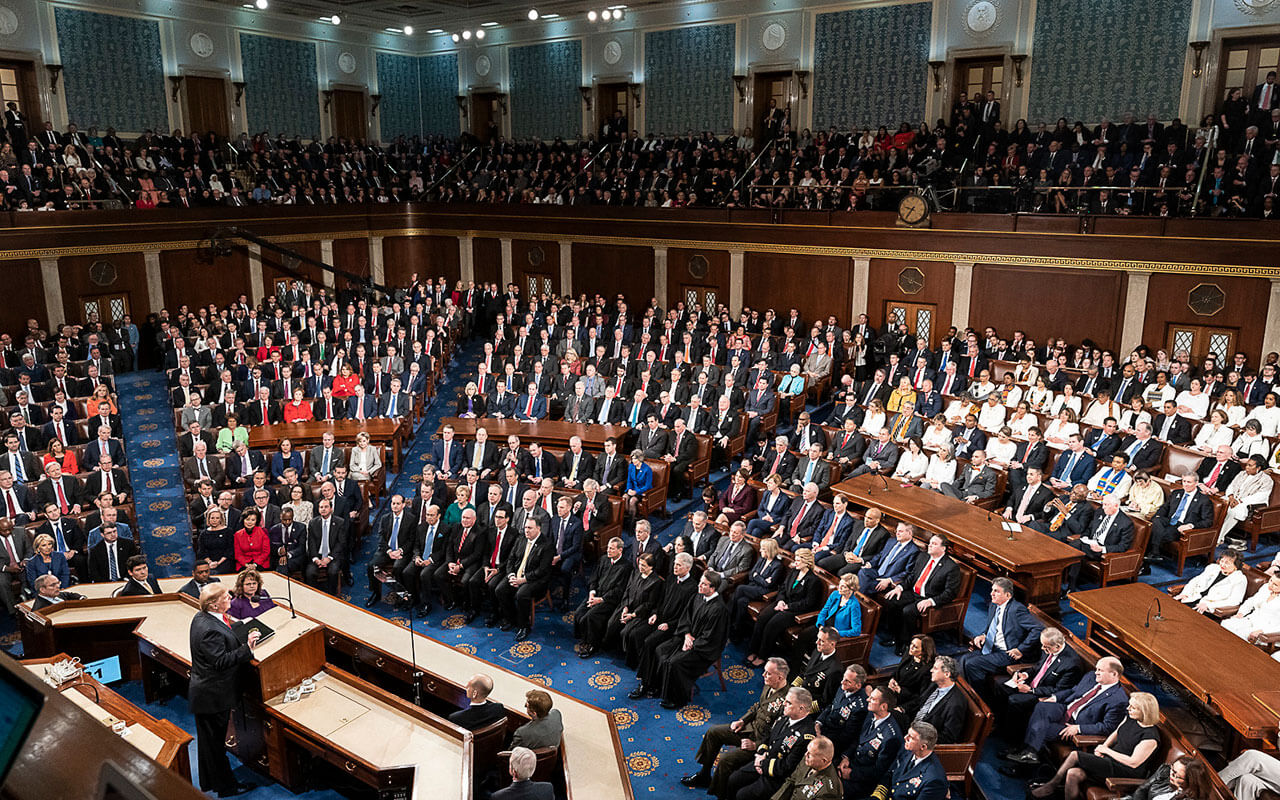
Here’s a sentence that might seem impossible, given our current political circumstances, but it’s true: The U.S. Congress just passed, and President Donald Trump signed, significant bipartisan legislation to curb prescription drug prices.

The year-end omnibus spending bill enacted last week contains the Creating and Restoring Equal Access to Equivalent Samples, or CREATES Act, a measure that strengthens market competition in the pharmaceutical industry by barring or limiting tactics that some drug companies use to prevent far less expensive generic versions of their products from coming to market.

The original Senate sponsors of the CREATES Act were Sens. Patrick Leahy (D-VT), Chuck Grassley (R-IA), Amy Klobuchar (D-MN), and Mike Lee (R-UT). The original sponsors in the House were Reps. David N. Cicilline (D-RI), Jim Sensenbrenner (R-WI), Jerry Nadler (D-NY), Doug Collins (R-GA), Peter Welch (D-VT), and David McKinley (R-WV).

As an attorney for the U.S. Federal Trade Commission, I saw drug companies use tactics time and time again to delay and prevent generic competition. These tactics enabled the firms to reap unfair profits at the expense of consumers, potential competitors, and ultimately the nation’s healthcare system, which thrives on innovation but struggles under the weight of excessive costs, especially for prescription drugs. Sadly, excessive prices can also cost lives.

The Washington Center for Equitable Growth supports research to understand the causes and consequences of increasing market power and to develop policy proposals that will strengthen competition. Earlier this year, as Equitable Growth’s director of markets and competition policy, I was asked by the House Judiciary Committee’s Subcommittee on Antitrust, Commercial, and Administrative Law to testify at a hearing on competition in the prescription drug market. I noted the unique aspects of the industry but emphasized that competition can have a significant impact on drug prices and innovation, as it does in other industries, when those markets work properly.

As I said then, “Competition plays a unique and fragile role in determining prescription drug costs: Unique because competition from generic alternatives is the only competition that dramatically reduces costs, and fragile because this competitive dynamic can be circumvented in many ways … It has become far too easy for companies to manipulate the system to delay competition and increase prescription drug costs.”

In addition to my time at the FTC, I spent 2.5 years as Sen. Klobuchar’s antitrust counsel. I was there when Sens. Klobuchar, Leahy, Grassley, and Lee came together to address two common and pernicious practices: sample blockades and safety protocol filibusters. And I was privileged to work on their solution, the CREATES Act.

To gain approval for a generic drug from the U.S. Food and Drug Administration, the manufacturer of the drug must test its product against the branded version to prove that the two are the same. Branded companies, however, frequently delay or even deny these samples to a manufacturer of generics, which postpones or potentially prevents FDA approval of the generic. No samples means no testing of the generic product, no testing means no approval, and no approval means no competition and thus higher prices for consumers.

I saw such sample blockades at the FTC, as companies sought redress, too often unsuccessfully. According to the FDA, there are currently 55 products for which companies are unable to obtain the needed samples.

The CREATES Act ends these blockades by establishing a process for ensuring that needed samples are available to generics manufacturers. It is carefully designed to ensure that the generics company can get what it needs to complete the required testing and obtain approval, but no more. At the same time, the new law makes it difficult for branded companies to delay or deny those requests with excessive claims or slow responses. In other words, it creates an efficient process that is difficult for either party to abuse.

The second tactic addressed by the CREATES Act, the safety protocol filibuster, exploits the need for certain drugs approved by the FDA to have a safety protocol designed to ensure the product’s safe use by consumers, as part of a Risk Evaluation and Mitigation Strategy, or REMS. This is another problem that made it to our desks at the Federal Trade Commission.

The law required generic manufacturers to use the same protocol system, which gave branded manufacturers an opportunity to filibuster. They could nitpick, create impossible conditions, and simply delay. Because the manufacturer already had approved protocols for its drug, the branded company could continue to sell its product while filibustering negotiations over a shared system with the generic. When this happened, the generic company could move forward only if it received permission from the FDA to develop a different but equally safe system.

The CREATES Act ends the assumption under previous law that a generic company and a branded company must agree to use the same safety protocol system as long as the generic’s protocols are safe. This effectively takes away companies’ filibuster power while continuing to ensure consumer safety.

Enactment of the CREATES Act is an important bipartisan accomplishment. Using the Congressional Budget Office’s projection of how much the CREATES Act will reduce federal spending on prescription drugs and estimating, based on Centers for Medicare and Medicaid Services data, that the federal government pays about 45 percent of total prescription drug costs in the United States, the CREATES Act will reduce prescription drug costs nationally by more than $7 billion dollars over the next 10 years.

But more can be done to control prescription drug prices through greater competition. There has been progress made on additional bills that address other behaviors by drug companies that make it difficult to introduce new generics. The House and Senate Judiciary Committees have approved the Stop STALLING Act, a bill introduced by Sens. Klobuchar and Grassley and by Reps. Sensenbrenner and Hakeem Jeffries (D-NY) aimed at preventing abuses of the Food and Drug Administration’s petition process that slow down regulatory approval of generics and biosimilars.

The House Judiciary Committee also has approved a bill introduced by Reps. Nadler and Doug Collins (R-GA) calling for a study of possible anticompetitive practices by pharmacy benefit managers. And that committee and the House Energy and Commerce Committee have approved different bills, introduced by Reps. Nadler and Collins, and by Rep. Bobby Rush (D-IL), that would address pay-for-delay agreements under which manufacturers of brandname drugs pay a competitor not to produce a generic or biosimilar version of the drug.

Competition prevents companies from charging excessive prices for needed goods. The market for pharmaceuticals has been distorted for a very long time, and it is a struggle for Congress to overcome lobbying by the major drug companies to bring prices under control. But there is bipartisan support for using competition to help make drugs affordable to the consumers who need them. This Congress has another year during which it can follow up on the CREATES Act and the progress it has already made on other legislation to spur further competition in the drug industry.

Posted in Uncategorized

Weekend reading: New measures of GDP edition

This is a post we publish each Friday with links to articles that touch on economic inequality and growth. The first section is a round-up of what Equitable Growth published this week and the second is relevant and interesting articles we’re highlighting from elsewhere. We won’t be the first to share these articles, but we hope by taking a look back at the whole week, we can put them in context.

Equitable Growth round-up

A new measure of county-level Gross Domestic Product called Local Area Gross Domestic Product helps make GDP a more useful metric in tracking economic growth, writes Raksha Kopparam. LAGDP numbers were released late last week by the U.S. Department of Commerce’s Bureau of Economic Analysis and estimate local GDP between 2001–2018, allowing policymakers and economists to study economic conditions and responses to shocks and recoveries on a county level. The data reveal a number of interesting takeaways about how parts of the country have been faring differently since the Great Recession, which Kopparam summarizes in four graphics, highlighting just how valuable it would be to further break down GDP numbers by income decile—something we have long proposed as part of our GDP 2.0 project.

Speaking of, Equitable Growth organized 58 leading economists and social scientists in endorsing the Measuring Real Income Growth Act of 2019, which would add a distributional component to the National Income and Product Accounts, breaking out income growth into deciles and allowing policymakers and the public to see who really prospers when the economy grows. The bill was reintroduced this week in the Senate by Sens. Chuck Schumer (D-NY) and Martin Heinrich (D-NM), after previously being introduced in the House of Representatives by Rep. Carolyn Maloney (D-NY).

How can Green New Deal proponents learn from the original New Deal of the 1930s to grow public support for their policy proposals combatting climate change? Harvard University’s Lizabeth Cohen looks at how Americans came to support the New Deal, lessons learned from that era, and how to apply these lessons to the Green New Deal climate policies today, arguing that the original New Deal’s support from a radial flank of idealists inspiring action, combined with their willingness to accept a more gradual path to change, was key to their success.

Equitable Growth’s 2020 Requests for Proposals will allow scholars to look more deeply at how U.S. economic inequality and intergenerational mobility are connected, writes Liz Hipple, continuing that “we hope to invest in research that pushes beyond individual-level factors such as education and skills and explores the structural barriers that people face in realizing their full human potential, particularly racism and public policies that create and perpetuate those structural barriers.” Be sure to check out more details about our 2020 RFP, as well as the 2020 RFP on paid family and medical leave.

Over the past two weeks, Equitable Growth’s Director of Tax Policy and chief economist Greg Leiserson held two “Economics of Taxation” courses, covering both tax basics and understanding and evaluating the trade-offs of U.S. tax policy. Corey Husak summarizes what Leiserson covered in the courses, including using revenue estimates and distribution analyses to see how much revenue a new tax law will collect or lose and who is affected by tax cuts or increases, respectively, and how economic growth plays a role in tax policy.

Links from around the web

While many policies have been floated lately to address the growing racial wealth gap in the United States, it would likely make more of a difference if we addressed the broader systemic issues driving this gap, argues Anne Kim in Washington Monthly. The problem is not just that black Americans are having a harder time finding a job, she writes, but also that the jobs they do get don’t pay well and tend to be low-level service jobs, making it near impossible for them to catch up to their white counterparts’ wealth accumulation. “All in all, the confluence of systemic disadvantages black workers face—from lower earnings and lesser-quality jobs—has led to fewer opportunities to save and accumulate wealth. That, in turn, has translated to lower rates of homeownership, higher levels of debt, and insecure retirement,” she says, concluding that “black workers need policy solutions that not only boost their earning power but protect their upward mobility in a changing economy.”

New evidence shows that workers are increasingly taking on side jobs in addition to their traditional employment, reflecting how a rise in U.S. economic inequality has caused a surge in the gig economy. About one-third of those workers with multiple jobs say they do them out of financial necessity, explains Jonathan Rothwell for The New York Times’ The Upshot—and at least two comparable countries, Canada and France, are not experiencing the same trends. This is probably due to those nations’ stronger social safety nets and lower rates of inequality.

Now that paid parental leave for federal workers has passed through Congress, Courtenay Brown writes for Axios that corporate America is facing pressure to boost paid leave benefits as well. After the law passed, the Business Roundtable—a group of CEOs whose companies employ more than 15 million workers—urged Congress and President Donald Trump to expand paid leave to as many American workers as possible, saying that its member companies’ sole purpose was no longer just profits but also investing in employees. Since the United States is the only industrialized nation in the world that does not mandate paid leave for new parents, the trend toward expanding these benefits for more and more workers is encouraging.

Earlier this year, it seemed as though a U.S. recession was imminent. Though it appears we’ve dodged that bullet (for now), Ben Casselman of The New York Times has put together a handy list of five indicators that could help warn us when a recession is about to hit or even is already underway. He explains each indicator in turn, and shows why it’s important to keep an eye on each of them to see what they’re saying about the economy.

Friday Figure

Figure is from Equitable Growth’s “New measure of county-level GDP gives insight into local-level U.S. economic growth” by Raksha Kopparam.

Posted in Uncategorized

Brad DeLong: Worthy reads on equitable growth, December 14–20, 2019

Worthy reads from Equitable Growth:

  1. Come to our reception at the ASSA Annual Meeting in San Diego on January 3!
  2. Read my “Was the Great Recession More Damaging Than the Great Depression?,” in which I write: “Your parents’—more likely your grandparents’—Great Depression opened with the then-biggest-ever stock market crash, continued with the largest-ever sustained decline in GDP, and ended with a near-decade of subnormal production and employment. Yet 11 years after the 1929 crash, national income per worker was 10 percent above its 1929 level. The next year, 12 years after, it was 28 percent above its 1929 level. The economy had fully recovered. And then came the boom of World War II, followed by the “thirty glorious years” of post-World War II prosperity. The Great Depression was a nightmare. But the economy then woke up—and it was not haunted thereafter. Our “Great Recession” opened in 2007 with what appeared to be a containable financial crisis. The economy subsequently danced on a knife-edge of instability for a year. Then came the crash — in stock market values, employment and GDP. The experience of the Great Depression, however, gave policymakers the knowledge and running room to keep our depression-in-the-making an order of magnitude less severe than the Great Depression. That’s all true. But it’s not the whole story. The Great Recession has cast a very large shadow on America’s future prosperity. We are still haunted by it.”


Worthy reads not from Equitable Growth:

  1. Michael Boskin wrote this two years ago. To my knowledge, not once in the past two years has he acknowledged that his “professional judgment” about the effects of the Trump-McConnell-Ryan tax bill were wrong. There has been no jump in the equipment investment share of national income. And those of us whose judgment is better than Michael Boskin’s were damned certain back in late 20127 that there would not be. Read Michael Boskin, “Another Look at Tax Reform and Economic Growth,” I which he wrote: “With the Republican tax package now finalized and coming to a vote in both houses of Congress, a debate has been raging over the bill’s possible growth effects. In that debate, those who oppose the package seem to be underestimating the outsize impact of equipment investments … I agree that the current tax bill could, in principle, have been better … Barro and I have clearly come to a different conclusion than Summers and Furman have about the bill, based on our own judgments about the links between corporate-tax reform and economic growth. While I certainly respect Summers and Furman’s right to their views, I am not about to cede my professional judgment to others, in or out of government.”
  2. This is a very, very nice example of the genre of microfoundations tuned to give a desired macroeconomic result. Lots of people find this kind of thing very useful, or at least comforting. So I am probably wrong in my lack of enthusiasm here. Read Daniel Murphy, “Excess Capacity in a Fixed Cost Economy,” in which he writes: “[When] firms … face only fixed costs over a range of output … equilibrium output and income depend on consumer demand rather than available supply, even when prices are flexible and there are no other frictions. The theory matches the procyclicality of capacity utilization, firm entry, and markups. A heterogeneous household version of the model demonstrates how an economy can enter a capacity trap in response to a temporary negative demand shock: When demand by some consumers falls temporarily, other consumers’ permanent income (and hence their desired consumption) falls. Since output is demand-determined, the permanent fall in desired consumption causes a permanent state of excess capacity.”
Posted in Uncategorized

Understanding the economic effects of federal tax changes

Overview

The primary purpose of taxation is to fund public spending in a fair manner. When analyzing proposed tax changes, tax economists must make complex assumptions about how people would respond to those changes and what that means for the incidence of the tax changes, meaning who would ultimately receive a tax cut or pay for a tax increase. Luckily, the economic effects of a federal tax change are summarized succinctly and intuitively by rigorous, nonpartisan groups such as the Joint Committee on Taxation and the Tax Policy Center in the form of a revenue analysis and a distribution table.

As Greg Leiserson, Equitable Growth’s director of Tax Policy and chief economist, notes, “If U.S. tax reform delivers equitable growth, a distribution table will show it.” Numerous complex calculations and assumptions underlie the production of revenue and distribution tables, but when done well, they provide the key information that policymakers need to know about how tax changes will impact the populations they care about. This may seem like a simple point, but all too often, arguments about tax policy ignore these fundamental sources of information, instead focusing on narrow, misleading claims about economic growth and job creation.

On December 6 and December 13, Equitable Growth hosted our “Economics of Taxation” courses in the U.S. Capitol building to help congressional staffers understand these tools of tax analysis and the trade-offs in designing tax policy. Our first day, “Tax Basics,” was an introduction to the federal tax system. The second day, “Taxes and Consequences,” covered most of the topics presented below in this column and how to understand and evaluate taxes in an intellectually rigorous and coherent manner.

Revenue estimates

Revenue estimates show how much revenue a tax law will collect or lose. U.S. policymakers ultimately face choices between revenues and spending, and the revenue impacts of federal tax legislation determine how much public spending and investment a tax increase can finance or, in the case of tax cuts, how much spending will need to be cut. In general, there are two different types of revenue estimates produced by groups that “score” legislation:

  • Conventional revenue estimates score every provision of a bill (or sometimes, closely related groups of provisions) and include behavioral responses, but assume that total national income remains unchanged by the legislation. Conventional revenue estimates are more detailed than dynamic estimates and are the default form of analysis produced by the Joint Committee on Taxation.
  • Dynamic estimates produce a modified revenue estimate that considers how tax legislation may cause total national income to change. Dynamic estimates are typically produced only for large pieces of legislation and only for the legislation as a whole, not for individual provisions. Tax bills can cause national income to change, for example, by increasing productive investments in the economy, inducing people to work fewer or more hours, or causing people to move activity from the nonmarket sector (as with home childcare) to the market economy (as with center-based childcare).

Both types of scores fulfill different purposes and are only useful insofar as the assumptions underlying them. Dynamic scores also are vulnerable to timing gimmicks. For instance, bills can generally increase growth within the standard 10-year scoring window simply by borrowing money from the future.

Distribution analyses

Distribution analyses assign the taxes cut or raised to the people ultimately responsible for paying the taxes, a concept called “incidence.” For instance, cuts in corporate taxes may be partially assigned to shareholders and partially to workers in different percentages, if the economist believe that is where the incidence lies.

Generally, the most useful way to present tax changes is using the percent change in after-tax income, which normalizes a tax cut by the recipient’s own income. This normalization is important because $10 is worth more to a poorer person than to a richer person, so this metric allows us to compare quantities in a way that is meaningful to individuals and families. Using this metric, the tax cuts in the 2017 Tax Cuts and Jobs Act were about 10 times as large for people in the top 5 percent as for those in the bottom 20 percent in 2018, as a share of each family’s income. (See Table 1.)

Table 1

The share of the federal tax change and the average federal tax change also can be instructive. In Table 1, two of the columns detail that 20.5 percent of the value of the tax cut in 2018 went just to 1 percent of the population, and this is more than went to the entire bottom 60 percent of the population (17.4 percent). Table 1 also shows that the average tax cut in the top 1 percent was $51,000, which is 852 times the average tax cut in the bottom 20 percent of the income spectrum.

Although it is most common to see examples of distribution analyses by income group, it is also possible to do distribution analyses by geography, race, and gender, or other groupings of people. These kinds of distributional analyses are important to do because they can give U.S. policymakers a more nuanced understanding of where the incidences of tax changes fall.

What about economic growth?

Economic growth is not as simple a concept as it often seems to be in the popular parlance. While the term may conjure up an image of broadly rising living standards and personal well-being, that is generally not what tax analysts are measuring when they talk about growth from tax changes. As we alluded to with our discussion of “dynamic scores,” economic analyses of growth typically focus on changes in U.S. Gross Domestic Product, or the market value of goods and services produced in the United States in a year.

Thus, U.S. tax laws that cause people to work longer hours, pay more in childcare expenses, or even induce more corporate payouts to foreign investors, can be said to increase growth, even when U.S. families would not consider themselves materially better off as a result of those changes.

In addition, presenting one aggregate growth number can obscure disparate affects across the income distribution. Unfortunately, the gains from growth have gone to the richest Americans in recent decades. The bottom 50 percent of Americans have seen their incomes after taxes rise by only 21 percent since 1980, compared to a 194 percent increase for the top 1 percent. So, even in the abstract, tax changes that affect “economic growth” may not actually affect the living standards of average Americans.

Thankfully, policymakers seeking to understand how a tax change will affect their constituents’ economic well-being can simply look to a distribution table, which captures both the benefits and costs to actual households.

To learn more about these topics, see the presentation slides from both courses here and here. And be sure to keep your eyes peeled for more courses such as these coming from Equitable Growth in the future.

Posted in Uncategorized

Equitable Growth’s 2020 Request for Proposals is an opportunity to better understand the structural barriers to intergenerational mobility

Two years ago, the Washington Center for Equitable Growth launched a new initiative to connect the dots between poverty, inequality, and mobility. Harvard economist—and founding Equitable Growth Steering Committee member—Raj Chetty had reinvigorated the conversation about intergenerational mobility with his dramatic findings that absolute mobility had declined from 90 percent for the generation born in 1940 to only 50 percent for those born in 1980. But what are the actual channels connecting inequality and mobility?

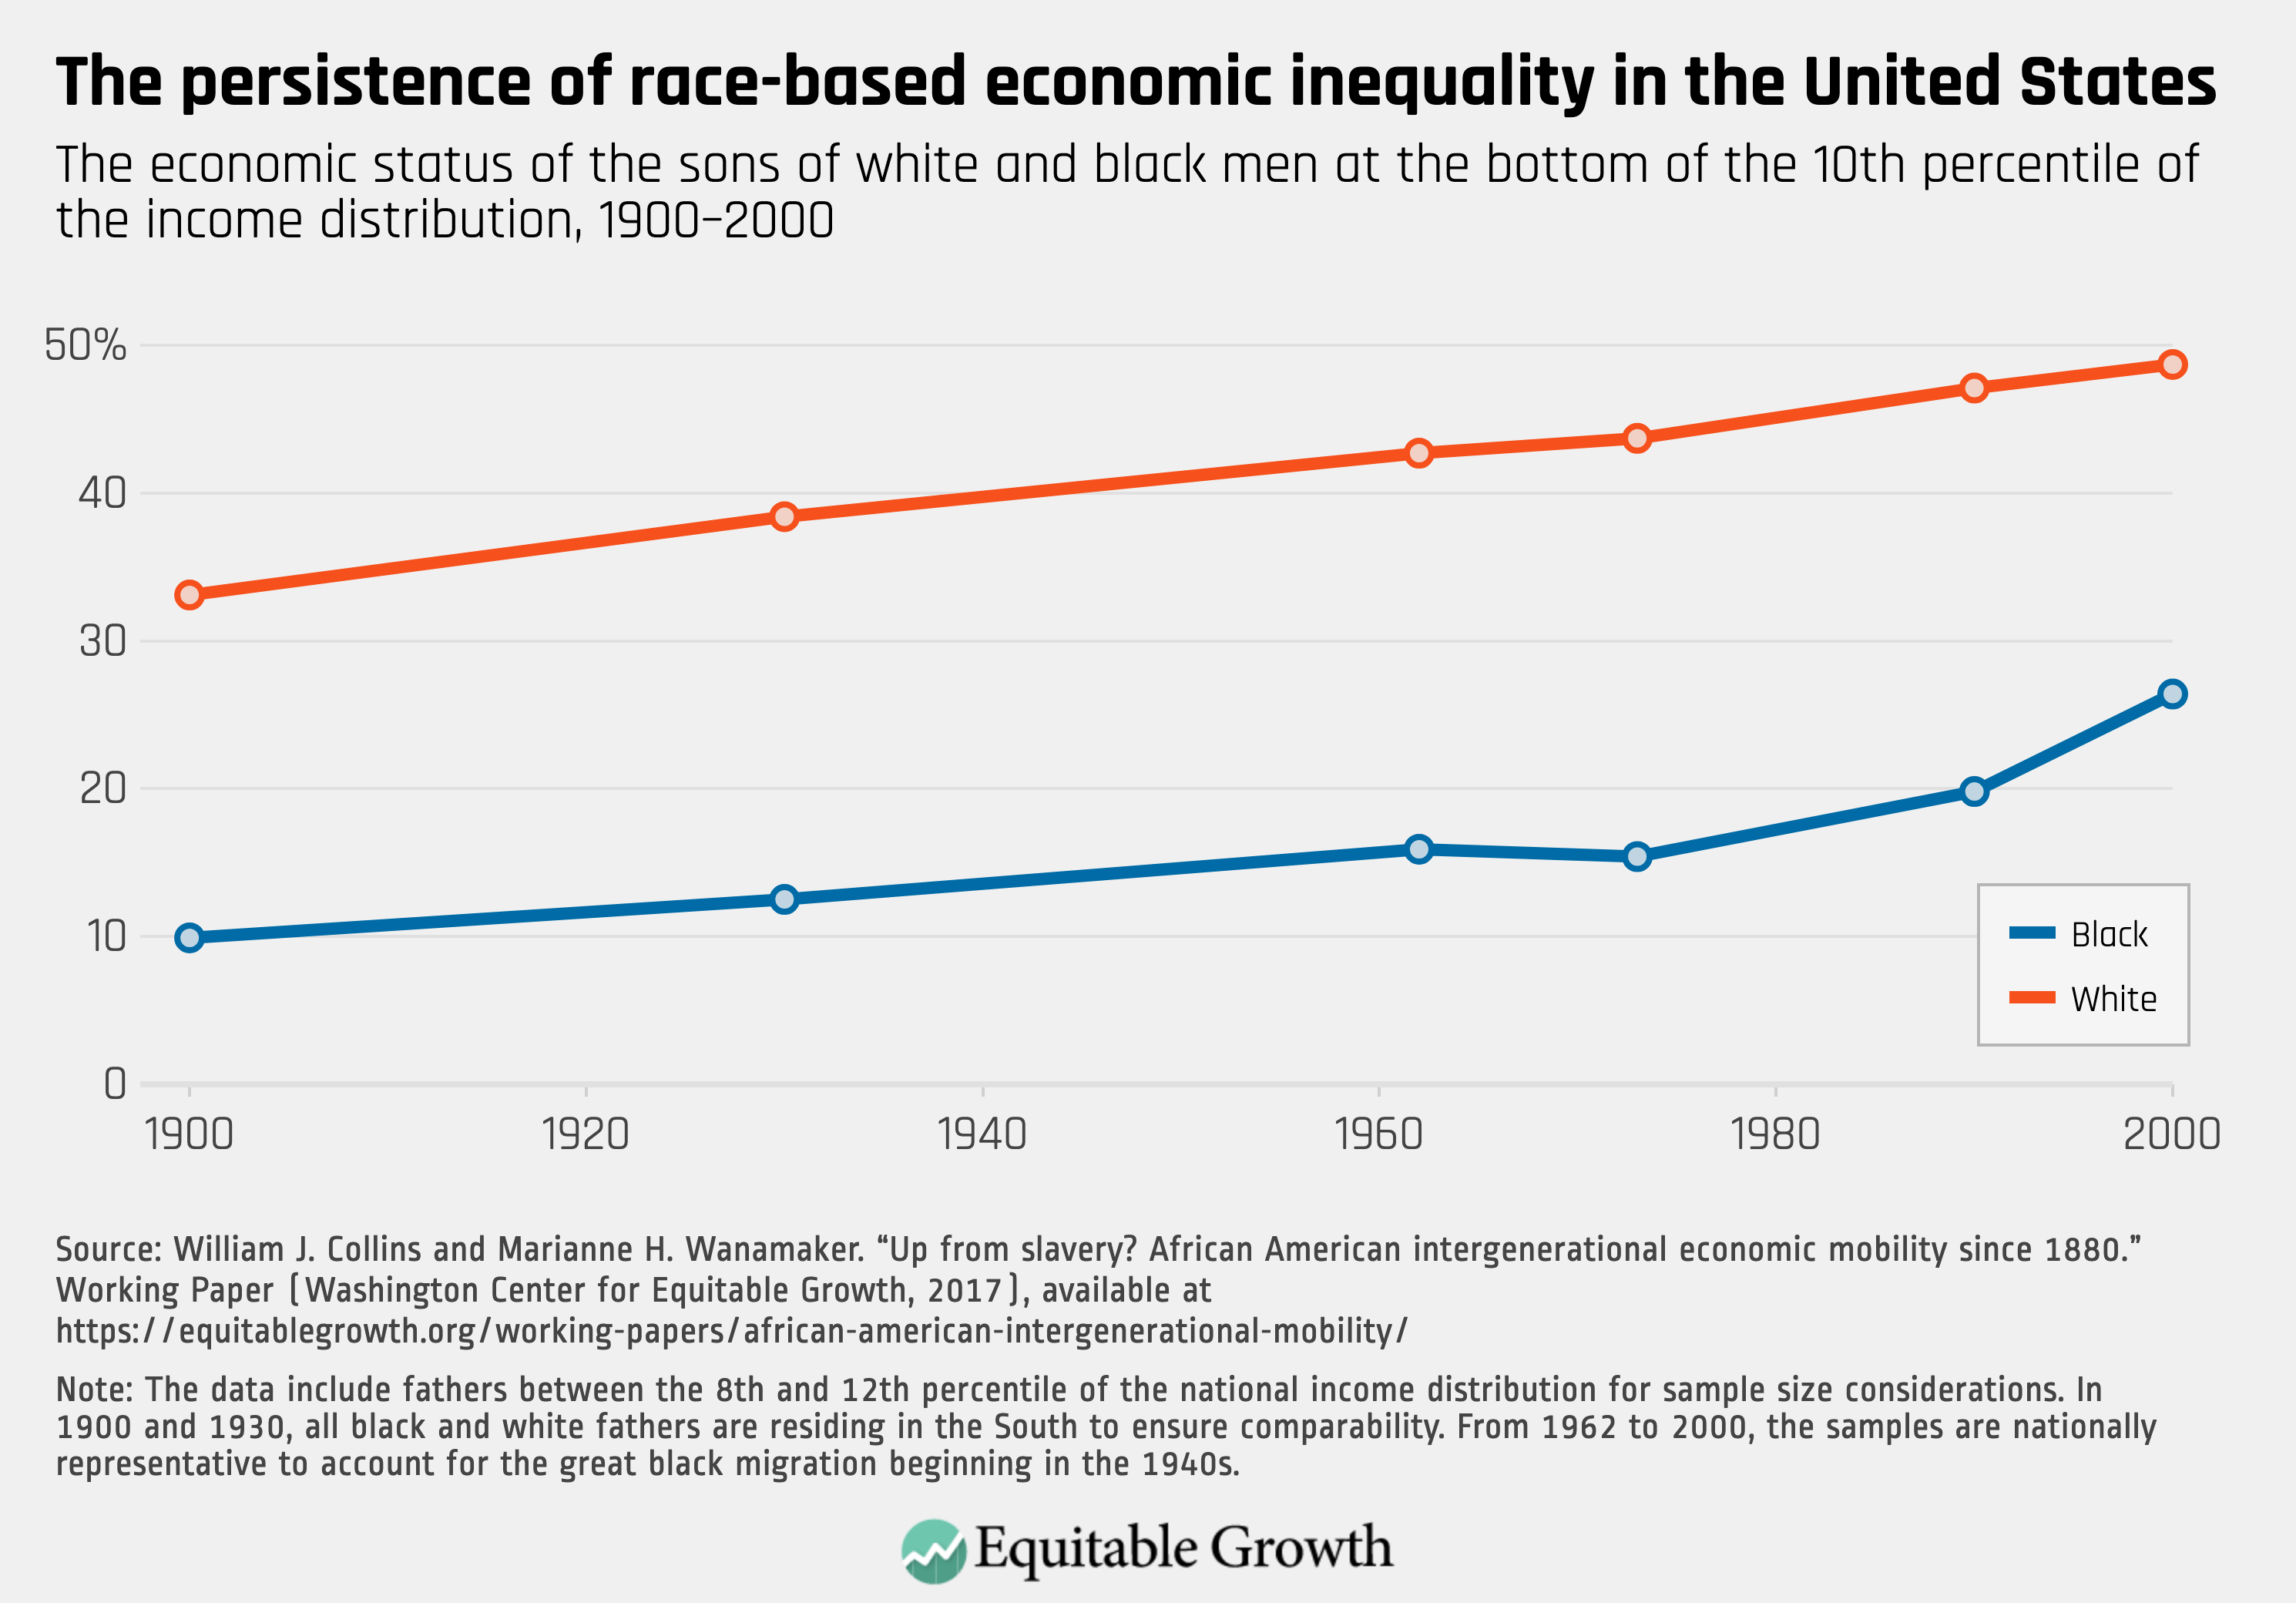
One product resulting from this initiative was a strategic framework report by Elisabeth Jacobs and myself, “Are today’s inequalities limiting tomorrow’s opportunities?,” which surveyed the academic literature on economic mobility to determine what we know and what we need to know about the drivers of intergenerational mobility. The report emphasized crucial factors related to the acquisition of human capital—such as improving education, particularly early childhood education—and found that they are insufficient when seeking to understand why mobility has declined over time and why mobility outcomes remain sharply divergent for Americans of different races and in different places.

Over the past year, we shared this framework in convenings and meetings with researchers; policymakers at the national, state, and local levels; and advocacy groups dedicated to advancing racial and economic justice. The feedback we received made clear that there is still more work to be done to deepen our understanding of the mechanisms connecting parental economic advantage and children’s adult economic outcomes.

This year, we hope to invest in research that pushes beyond individual-level factors such as education and skills and explores the structural barriers that people face in realizing their full human potential, particularly racism and public policies that create and perpetuate those structural barriers. We welcome proposals asking questions about how changes to the labor market such as fissuring and the erosion of career ladders affect intergenerational mobility. What are the mechanisms via which race and place influence intergenerational mobility? How does family wealth—not just income—impact mobility? What are the mechanisms underlying the relationships between mobility and family structure, and what do they imply about policies that can support families and break the link between family background and economic outcomes?

These are just some examples of the questions that Equitable Growth is interested in exploring as part of our 2020 Request for Proposals to academics to explore these and other issues related to inequality and mobility. Equitable Growth’s grants program, now entering its seventh year, includes a portfolio of cutting-edge scholarly research investigating the various channels through which economic inequality may or may not impact economic growth and stability, both directly and indirectly. The organization has provided grants to more than 200 researchers and distributed more than $5.6 million in grants. Earlier this year, Equitable Growth announced 14 grants to 33 researchers and 13 grants to doctoral student researchers totaling $1.064 million. Equitable Growth bridges the gap between academia and policy by fostering research that is relevant to today’s policy debates, and by informing policymakers of cutting-edge research.

The American Dream remains a dominant narrative in U.S. economic policy conversations. And the “pull-yourself-up -by-the-bootstraps” metaphor remains the dominant one for how Americans think about achieving the American Dream. Yet research clearly demonstrates this is a facile response that ignores the role of legal barriers, policy choices, and discrimination in shaping and determining economic outcomes. By funding new, cutting-edge scholarly research that examines the role of structural barriers to economic mobility, Equitable Growth will be able to arm policymakers with solutions that make the American Dream live up to its promise.

Posted in Uncategorized

Nobel laureates, former Fed chair, two former CEA chairs–58 scholars endorse the Measuring Real Income Growth Act of 2019

Fifty-eight economists and other social scientists, including Nobel laureates Robert Solow and Joseph Stiglitz, former chair of the Federal Reserve Janet Yellen, and former chairs of the Council of Economic Advisers Jason Furman and Laura Tyson, endorsed the Measuring Real Income Growth Act of 2019, which was reintroduced in the U.S. Senate today by Senator Chuck Schumer (D-NY) and Senator Martin Heinrich (D-NM). The bill was previously introduced in the House of Representatives by Representative Carolyn Maloney (D-NY).

The Measuring Real Income Growth Act would add a distributional component to the National Income and Product Accounts, breaking out income growth into deciles of income and allowing us policymakers and the American people see who prospers when the U.S. economy grows. The bill was previously endorsed by 11 economic nonprofit organizations, including Equitable Growth.

The text of the letter and a link to the letter with all signatories listed are below.

Signatures on Letter of support – Measuring Real Income Growth Act

We the undersigned economists and other social scientists are writing in support of the Measuring Real Income Growth Act of 2019. This act would direct the U.S. Bureau of Economic Analysis to report on growth in income for each decile of income earners.

Pundits and politicians frequently judge economic progress by reference to Gross Domestic Product (GDP) growth, a one-number measure of output that is both readily available and easily comparable across countries. These two features have fueled its adoption as an indicator of prosperity. But as income inequality has widened, GDP is increasingly ill-suited for this purpose.

In the mid-20th century, families all along the income distribution tended to share the fruits of growth equally, making GDP growth broadly representative. But over the past four decades the experiences of rich and poor Americans have been very different, with the latter falling far behind, and average growth, though widely reported and discussed, becoming much less useful as a guide to how the economy is performing for median families.

The inadequacy of aggregate measures of income was noted by Simon Kuznets, who pioneered the creation of National Accounts in the United States. In his report to Congress on the new measurement, he warned that “Economic welfare cannot be adequately measured unless the personal distribution of income is known.” Indeed, such aggregate measures could have a pernicious effect—increases in GDP could lull us into a complacency that all is going well with the economy, when in fact most citizens are seeing their incomes decline.

Nonetheless, the concept of national income accounting is a useful one, and with some improvements could provide valuable guidance for elected officials. A simple first step is to report growth for households at different levels of income so that we know how growth is distributed among the rich and poor, as the Measuring Real Income Growth Act will do.

This data will have a number of useful applications. Research has shown that unequal patterns of growth may be indicative of falling intergenerational income mobility. Combined with distributed consumption data, the national income data could tell us about the accumulation of debt in the economy. In the wake of a recession, this data will help us understand how relief should be targeted.

As important as their analytical value, these statistics will provide a more accurate reflection of the economy for millions of Americans who are poorly represented by aggregate statistics. Surveys show that 66 percent of Americans believe most government statistics are inaccurate. This may reflect in part the legitimate feeling that the economic statistics are not accurately describing their economic experiences and those of people like them. Statistics that show how income is distributed is a small but meaningful step toward rectifying this situation and improving the tools we have available to us to steward the economy.

Posted in Uncategorized

JOLTS Day Graphs: October 2019 Report Edition

Every month the U.S. Bureau of Labor Statistics releases data on hiring, firing, and other labor market flows from the Job Openings and Labor Turnover Survey, better known as JOLTS. Today, the BLS released the latest data for October 2019. This report doesn’t get as much attention as the monthly Employment Situation Report, but it contains useful information about the state of the U.S. labor market. Below are a few key graphs using data from the report.

1.

The quit rate continued to hold at 2.3% in October, where it has remained for over a year with the exception of a blip in last July.

2.

The ratio of hires to job openings remains below 1.0 as it trended downward in October to 0.79 from 0.85 in September.

3.

As job openings increased by 235,000 in October, to a total of 7.3 million, and unemployment remains low, there continues to be fewer than one unemployed worker per opening.

4.

The Beveridge Curve reveals the continuation of an expansionary labor market, with a low rate of unemployment and a high rate of job openings.

Posted in Uncategorized

New measure of county-level GDP gives insight into local-level U.S. economic growth

Local Area Gross Domestic Product allows policymakers and economists to examine local-level economic conditions.

Since the 1930s and ‘40s, the United States has primarily relied on Gross Domestic Product, or GDP, as the main measure of economic growth and activity. For decades, analysts viewed the upturns and downturns of the GDP growth rate as a reflection of our overall economic well-being. But recent trends in income inequality have enabled the fruits of economic activity to accrue at the top of the income ladder, causing GDP as a measure of the economy to become less and less a reflection of the economy for everyday people. In short, people in the bottom 90 percent of the income distribution are no longer experiencing the same growth as those in the top 10 percent.

Making GDP a more useful metric may require peeling it apart and looking at the data more closely. On December 12, the U.S. Department of Commerce’s Bureau of Economic Analysis released a new measure of economic growth that does just this—Local Area Gross Domestic Product. LAGDP is an estimate of GDP at the county level between the years of 2001—2018. This measure allows policymakers and economists alike to examine local-level economic conditions and responses to economic shocks and recovery.

The new data measurement shows that private-sector industries across the nation have experienced growth since the end of the Great Recession in mid-2009, yet most of this growth is concentrated in the West Coast states and parts of the Midwest. States such as Nevada, West Virginia, New Mexico, and Wyoming have seen a significant number of counties contract in economic output since the recession. (See Figure 1.)

Figure 1

One of the benefits of this new LAGDP measure is that it provides an industry-specific breakdown that shows us how 34 different industries contribute to local economies. The tech industry, for example, contributed a substantial amount to local economies in the major cities of states such as California, Colorado, New York, and Massachusetts since 2001. (See Figure 2.)

Figure 2

Using the data, trends in the manufacturing industry and how manufacturing has contributed to GDP pre- and post-Great Recession are also now more trackable. Looking at the data since 2001, manufacturing output increased overall, but clusters of counties on the East Coast and the Midwest suffered contractions. Although overall manufacturing output in North Carolina increased, many counties experienced heavy declines over the past 17 years. (See Figure 3.)

Figure 3

The new measure gives an insight into the geographic distribution of our nation’s economic activity, but it also highlights just how unequally distributed GDP is. When looking at real GDP (after accounting for inflation) at the county level, LAGDP shows that 20 percent of the nation’s economic growth is concentrated in 11 counties, including the cities of Los Angeles, New York, and Harris, Texas. At the other end of the spectrum, the new data show that 20 percent of GDP is contributed by approximately 2,700 counties with the lowest economic activity. Aggregated GDP measures are not able to paint the picture that 2,700 counties contribute as much to the nation’s economy as 11 of the largest counties in America. (See Figure 4.)

Figure 4

These comparisons don’t mean that workers are more productive in Los Angeles than elsewhere, since the new measurement doesn’t account for population size, which means LAGDP doesn’t capture the overall well-being of families in each county. For instance, Los Angeles contributed 3.8 percent of the national GDP, but LAGDP doesn’t show that approximately 15 percent of its residents are living in poverty. But the data highlights just how vast the urban-rural divide is and how concentrated our economic activity is.

In order to provide a clear picture to policymakers about how the economy works for households at all levels of the income spectrum, we need more disaggregated growth and income data. On its own, the new LAGDP measure has the potential to widen our understanding of the impact industries have on regional economies. Combining this data with disaggregated national income data would facilitate the study of the effects of and relationships between industry growth and income inequality at such levels.

Equitable Growth’s GDP 2.0 project, which proposes that the Bureau of Economic Analysis extend the National Income and Product Accounts to assess national income distribution, is a further step toward better understanding who prospers when the economy grows. In the hands of local policymakers, these tools can guide efficient resource allocation, economic development and investment strategies, and opportunities for growth.

Posted in Uncategorized

Lessons from the New Deal of the 1930s for a Green New Deal today

Hundreds of young people occupy Representative offices in Washington, D.C. to pressure the new Congress to support a committee for a Green New Deal, December 10, 2018.

This post was adapted from remarks delivered at Vision 2020: Evidence for a Stronger Economy, the Washington Center for Equitable Growth’s policy conference, which was held November 1, 2019.

Climate change activists in the United States and around the world can take heart from recent polls that show a majority of Americans in both major political parties and all ages support interventions to reduce greenhouse gases and encourage renewable energy. Ferocious hurricanes, extensive flooding, and destructive fires certainly help underscore the dire situation for the public.

Yet the scale of action and the agenda for change that many Americans endorse is nowhere near as ambitious as what the authors of a proposed array of policies, collectively known as a Green New Deal, are calling for. Their proposals, although in flux, generally call for a total shift to renewable energy within 10 years, as well as the creation of a transformative green economy that will provide decent jobs with benefits, universal healthcare, and more affordable housing and infrastructure investments.

A Green New Deal, in short, is conceived as the opening wedge in a radical shift from a private, market-based neoliberal economy to a more social democratic one, where new federal policies will create a more egalitarian, just, and greener United States. Advocates for this revolutionary change have seized the mantle of the New Deal of the 1930s and 1940s as their inspiration—and for good reason. President Franklin Roosevelt’s New Deal—designed to address the crisis of the Great Depression—remains the gold standard for the federal government taking responsibility in a national emergency, despite all the backtracking since the 1970s.

My research into how ordinary workers in Chicago responded to FDR’s New Deal provides insights into how popular support for a massive set of new federal programs might be mobilized for a change of this magnitude today. And my recent new book, Saving America’s Cities, tracks how the retreat from empowering the federal government fueled the current crisis in affordable housing and crumbling urban infrastructure. Together, I believe there are four key lessons that Green New Dealers can take from the original New Dealers and the eventual breakdown in support of federal government intervention in the U.S. economy beginning in the 1970s.

But first, it’s important to understand why Americans in the 1930s and 1940s came to embrace the New Deal, as we seek parallels to it today.

How Americans came to support the New Deal

Before the New Deal, many of the workers in the steel mills, packing plants, and other industrial workshops of a city such as Chicago lived political lives defined narrowly by their local ward boss, either a Democrat or a Republican—that is, if, as first- and second-generation Americans, they even voted or participated politically at all. For African Americans, the national Democratic Party was the enemy, the party of their southern oppressors and the party to vote against now that they were in the North.

Moreover, within workplaces, unions, to the extent that they existed in the 1920s, were dominated by elite (usually white and native-born) craft workers, who aimed to limit opportunity for the more numerous, less skilled, and commonly immigrant nonunion workers. After the union organizing defeats of 1919, unions held little promise for lesser-skilled industrial workers. To the extent that working-class Chicagoans could depend for survival on any affiliations beyond their own families, it was on the institutions of their ethnic and racial communities—mutual benefit societies, building and loan associations, churches, and neighborhood “Mom and Pop” stores extending credit.

Workers also looked to the paternalistic welfare programs that their employers had instituted in the 1920s to protect themselves against the failed, but still worrisome, unionization drives that had followed World War I. Companies touted such benefits as paid sick leave and vacation, pensions, and employee representation to foster loyalty in their workers, but their unwillingness to put their money where their promises were gave few workers full access to these benefits.

By 1936, the year of President Roosevelt’s first re-election, the world had turned upside down. Faced with a global Great Depression, ordinary working-class Chicagoans, in a few short years, had become enthusiastic adherents of a national Democratic Party with FDR at the helm, voting in much greater—and Democratic—numbers in national elections. That trend also included African Americans, who increasingly replaced the motto “Stick to Republicans because Lincoln freed you” with “Let Jesus lead you and Roosevelt feed you.”

Workers took full advantage of President Roosevelt’s federally funded New Deal programs, benefiting especially from its relief programs but also becoming the rank and file of a massive drive to unionize industrial workers across many sectors, coordinated by the newly founded Congress of Industrial Organizations, or CIO, whose success was made possible by Congress’ passage of the Wagner Act of 1935, which guaranteed the right of private-sector U.S. workers to organize, engage in collective bargaining, and strike. By 1940, one in three workers in Chicago manufacturing would be a union member, whereas 10 years earlier hardly any had been.

The political landscape of Chicago was transformed. Workers who, not many years before, had ignored or shunned the national Democratic Party, had had few connections to Washington, and had been excluded from national unions now identified with the national government and a nationwide party and union.

Lessons from the New Deal era

Given the challenge today to mobilize ordinary Americans for an ambitious climate policy agenda in the 21st century, what can they learn from the original New Dealers, who successfully recruited supporters to such a paradigm-shifting program more than eight decades ago?

First, President Roosevelt and his advisers never had a master plan for the New Deal of the 1930s. Rather, they promoted and implemented a set of new laws and regulations in FDR’s first 100 days as practical fixes to pressing problems. As time went on, programs that worked remained while others died, to be replaced by new initiatives.

When the National Industrial Recovery Act—with its voluntary codes of fair competition and limited encouragement of collective bargaining—proved inadequate and then was ruled unconstitutional, it was replaced with the stronger Wagner Act that offered a clearer path to unionization. And it was not until the so-called Second New Deal beginning in 1935 that a welfare state of Social Security, minimum wages and hours, Unemployment Insurance, and public housing would take shape.

In other words, the New Deal was improvisational and incremental. Furthermore, to minimize the impact of the shift away from state-based federalism to more national management of the polity, many federal programs were operated and dollars were channeled, through states, counties, and cities—injecting federal resources and regulations without marginalizing all existing local sources of political power.

The result was a hybrid governance structure of national statism and persistent localism. President Roosevelt pledged to create “a new deal for the American people,” but he also insisted that he was rescuing capitalism, not overthrowing it. And he never laid out a fully developed blueprint for action. For ordinary Americans, embracing the New Deal did not require signing on to a totally new, radical platform.

Second, this New Deal of the 1930s was more practical than ideological, tolerating constraints imposed by its coalition partners. Most tragically, powerful southern Democrats insisted on excluding agricultural and domestic workers, many of whom were black and Mexican, from the protections of the Fair Labor Standards Act, and rejected much-needed anti-lynching legislation.

But there were also crucial partners on the left. Ideologically motivated, radical activists pushed the New Deal to make deep, structural changes in the U.S. economy and society, orchestrating Communist Unemployed Councils, Socialist Workers’ Committees for Unemployment, hunger marches, and left-wing unions. In the end, despite all the hardships of the Great Depression, the average worker did not buy into an anti-capitalist message. Communist organizer Steve Nelson recalled how he and his comrades had “spent the first few weeks agitating against capitalism,” but then quickly learned to shift to a “grievance approach,” raising “demands for immediate federal assistance to the unemployed, and a moratorium on mortgages.”

In fact, partly inspired by the failed promises of their employers’ welfare capitalism schemes of the 1920s, working-class Americans came to embrace what I have labeled “moral capitalism.” While benefiting from radical leaders, they more often opted for liberal goals, to be achieved by pressuring employers and national leaders to deliver a fairer, more just capitalism, but not to refashion the existing economic order.

But rather than lead the Green New Dealers of today to conclude they must accept the inherent conservatism of ordinary Americans in their agenda setting, this experience of the 1930s should remind us that a radical flank played a crucial role in achieving even a liberal outcome. Left leaders of the CIO worked hard to cultivate what I call an inclusive “culture of unity” in the union movement. They knew that success required it, or else the ethnic and racial divisions that had doomed the 1919 organizing drives would re-emerge. If they did not brazenly call for class solidarity, then white working people might well retreat to their segmented ethnic worlds and express open hostility to African American co-workers.

Applying these lessons to climate policy today

One broad lesson, then, from the New Deal of the 1930s is the necessity of having both a radical flank of idealists to inspire action and a willingness to accept a more gradualist and moderate path to change.

The history of the Roosevelt New Deal, however, offers up three more specific lessons for building support for a Green New Deal. First is the importance of leadership, both at the top and the bottom. Workers admiringly championed President Roosevelt. And committed local leaders, both in the Democratic Party and on the shop floor, effectively managed to bring a national agenda of change back home.

Second, working people were mobilized within existing and new institutions and organizations, not as isolated individuals. Even as churches, ethnic organizations, and the like failed to meet the crisis of the Great Depression on their own, they provided entryways to new solutions. This is perhaps one of the greatest challenges facing progressive policymakers today. Even as people’s social media affiliations have grown, many intermediary institutions—particularly unions, but also churches, clubs, and other centers of social capital—have weakened or even disappeared. The success of the political right might, in fact, be attributed to the greater survival of organizations such as evangelical churches, which provide infrastructure as well as inspiration for conservative politics.

Third, the New Deal of the 1930s was most remarkable for how it inspired a generation of Americans to trust the federal government as capable of solving many of the nation’s—and their own personal—problems. That confidence would persist during at least three more post-war decades. Today, however, we are in a very different place. Trust in the federal government has eroded. And as distrust has grown, responsibility has devolved to lower levels of government and has fed the anger and disillusionment that is so visible today. Global warming is not a problem that can be solved easily at lower levels. National—even international—remedies are needed to address climate change and a host of other challenges.

In my recent book, Saving America’s Cities, I analyze how this rejection of the federal government also fueled today’s lack of affordable housing and disinvestment in urban infrastructure. Mounting a Green New Deal—or solving the nation’s housing crisis—will require reawakening people’s confidence in the vision and effectiveness of Washington. The Green New Deal carries the potential of helping to inspire that greater confidence—or of being dismissed by a still-skeptical public as one more federal folly. How shrewdly progressives play that hand may ultimately determine their success.

Lizabeth Cohen is the Howard Mumford Jones Professor of American Studies and Harvard University Distinguished Service Professor.

Weekend reading: “Inequality runs deep” edition

This is a post we publish each Friday with links to articles that touch on economic inequality and growth. The first section is a round-up of what Equitable Growth published this week and the second is relevant and interesting articles we’re highlighting from elsewhere. We won’t be the first to share these articles, but we hope by taking a look back at the whole week, we can put them in context.

Equitable Growth round-up

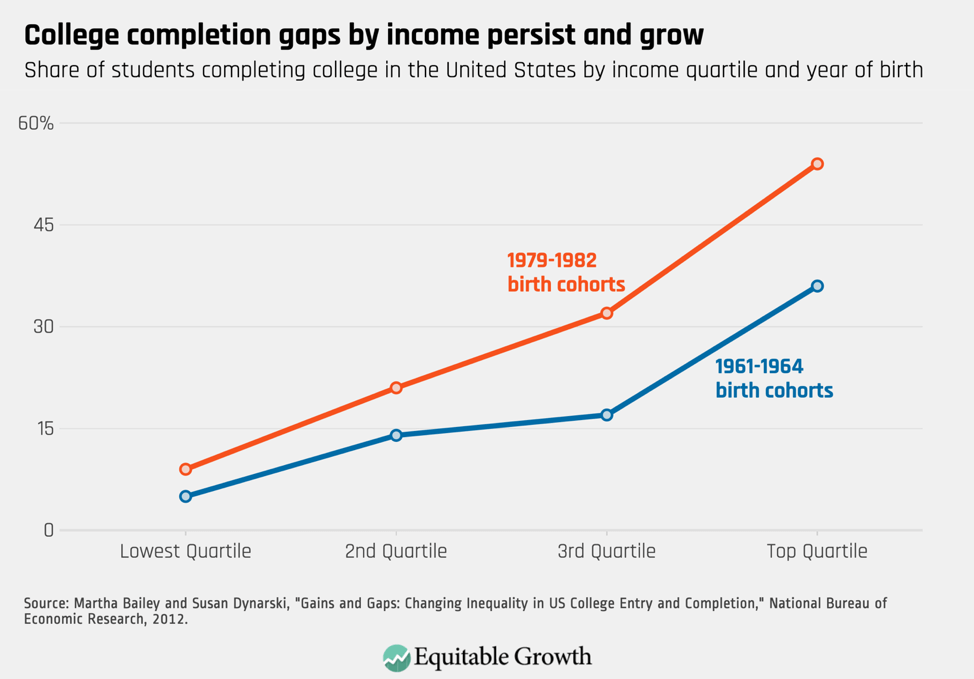
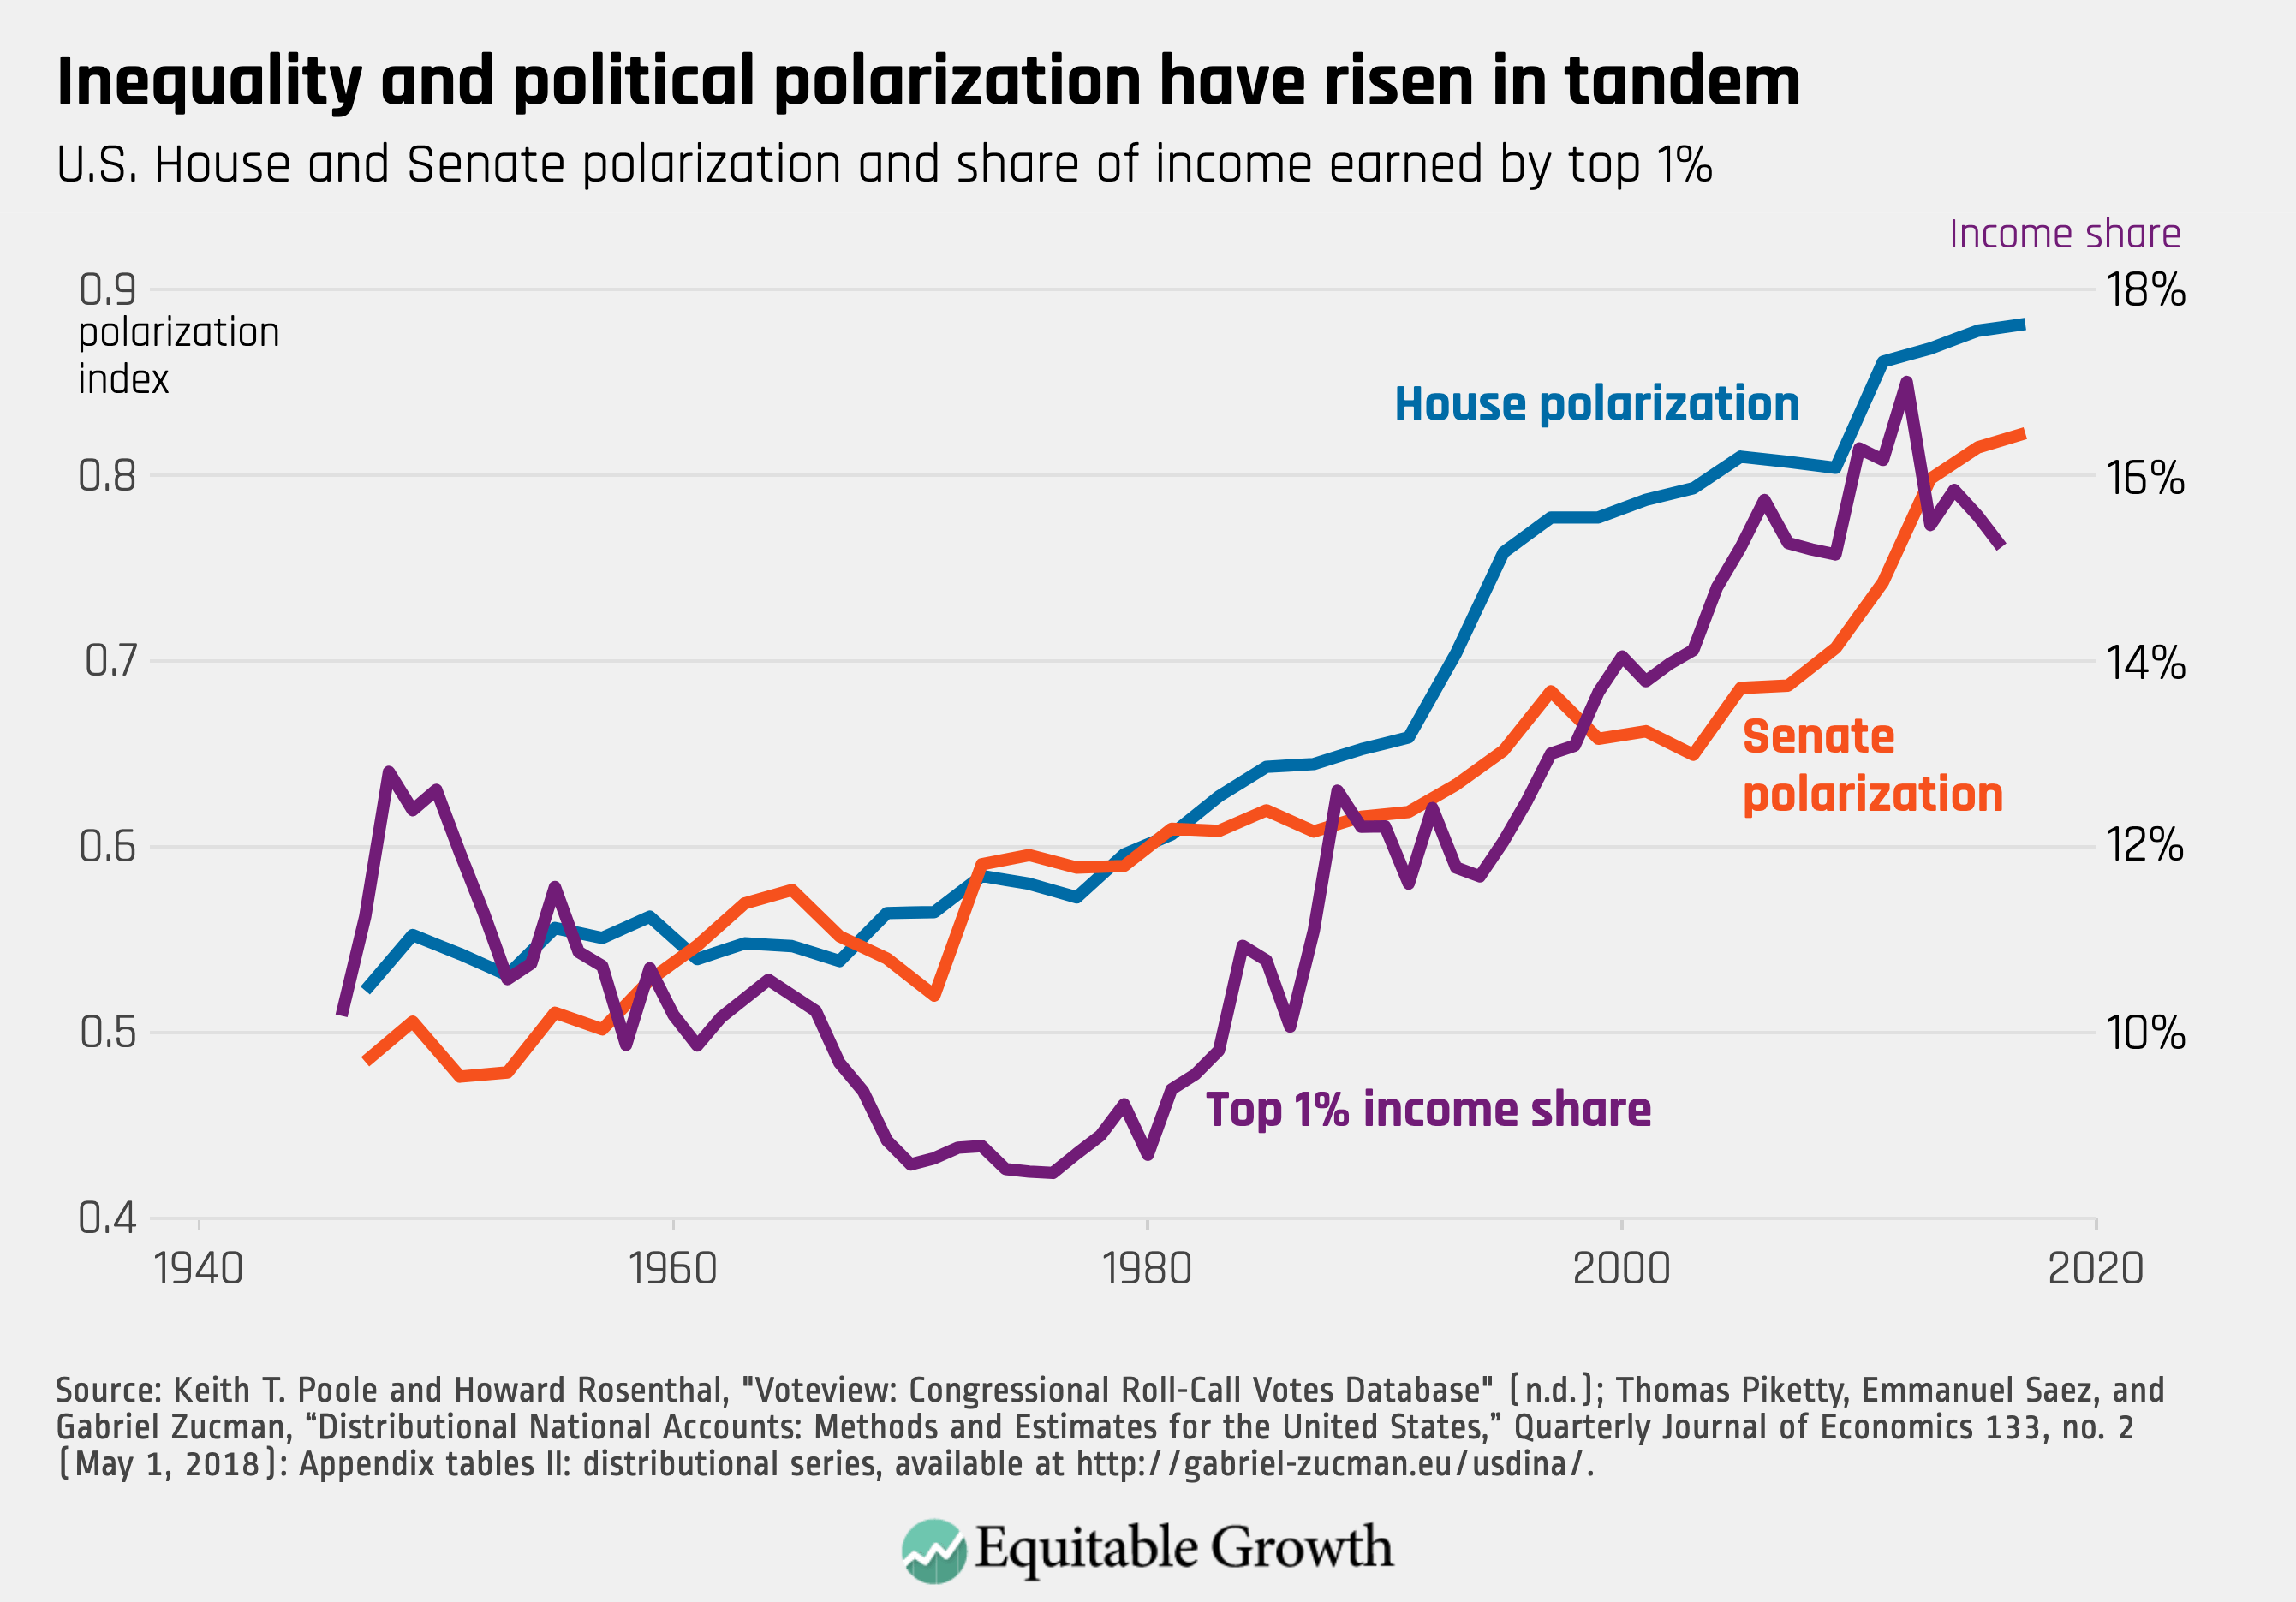
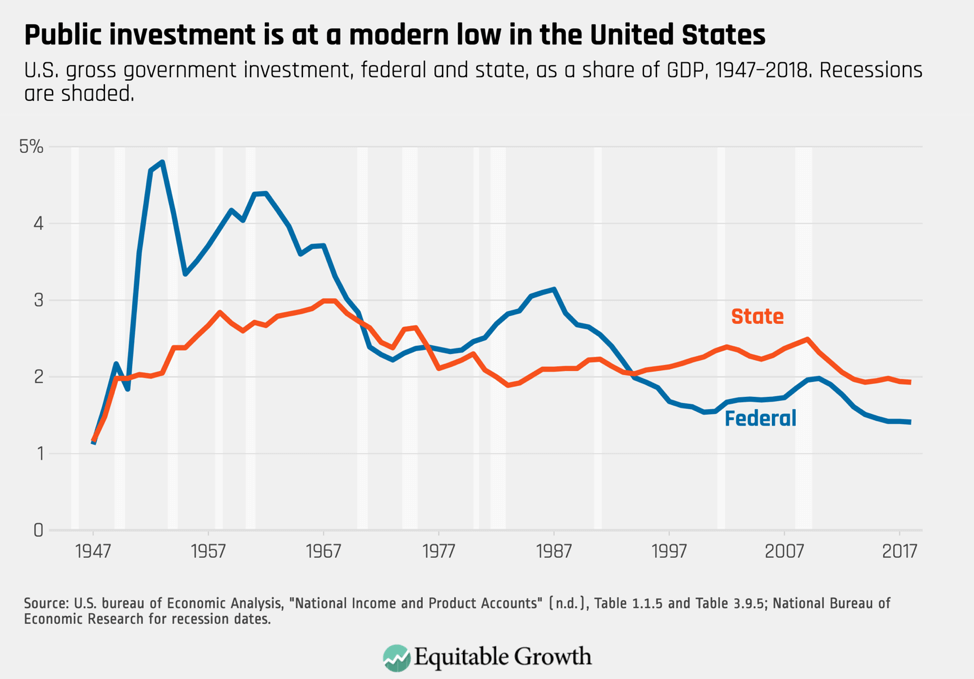
Economic inequality, on the rise for decades in the United States, is reshaping the wealth and income landscapes so that the gains of prosperity and growth are largely only shared by those at the very top. As a result, income mobility continues to decline, educational achievement gaps continue to rise, and disparities in health outcomes among different income groups continue to grow. Austin Clemens put together eight graphics to illustrate these realities, and why the work Equitable Growth does to study how inequality impacts growth and stability in the U.S. economy—and how American families are affected as well—is so important.

The way the U.S. Bureau of Economic Analysis currently measures economic and income growth using Gross Domestic Product does not accurately account for the lived experience of most people. That’s why our GDP 2.0 project for a new measurement strategy—breaking out growth by income decile—is key to affective economic policymaking and why this week, along with 10 other organizations, we endorsed the Measuring Real Income Growth Act of 2019, which would enable this measurement reform to happen. The bill, sponsored by Rep. Carolyn Maloney (D-NY) and Sens. Chuck Schumer (D-NY) and Martin Heinrich (D-NM), would, for the first time, enable us to see who really prospers when the economy grows.

Various studies show how deeply recessions negatively affect economic outcomes of young college graduates, particularly compared to other age cohorts—that is, younger workers tend to experience higher unemployment rates, lose access to valuable trainings and experience, and suffer more severe income losses. But a new working paper shows that the damage to younger workers is worse and lasts longer than previously thought. Jesse Rothstein summarizes his research findings, writing that “those who enter the labor market during recessions have permanently lower employment and earnings, even after the economy has recovered”—making it even more imperative for policymakers to do more to prepare for and ameliorate future recessions. (If they need any ideas, Equitable Growth and The Brookings Institution’s Hamilton Project recently released a book, Recession Ready: Fiscal Policies to Stabilize the American Economy, arguing for six policies that can do just that.)

More lenient U.S. antitrust rules, caused by fears of what strict regulations might do to innovation and product markets, are extremely costly to consumers. Michael Kades in his Competitive Edge post runs through the example of the pharmaceutical industry, showing that the adoption of the lenient scope-of-the-patent rule cost U.S. consumers more than $60 billion. He also shows that later, stricter antitrust enforcement did not end pharmaceutical settlements, nor did it deter innovation in the industry or prevent generics companies from challenging patents. Thus, he argues, an even stronger rule may be even more effective.

In case you missed it, Equitable Growth recently released its 2020 Request for Proposals, and this year, we have also launched a separate RFP focused exclusively on issues relating to paid family and medical leave. Alix Gould-Werth explains why we opened this second stream, why this issue is such an important one to study, and why it should be looked at now.

We are excited to welcome Tara McGuinness to our Board of Directors. McGuinness has a long history of leadership in organizations that serve the public, and is a strong believer in evidence-backed policies and programs that help local communities. She is currently a senior fellow at New America, a public policy think tank, and teaches public policy at Georgetown University.

Head over to Brad DeLong’s latest worthy reads for his takes on recent must-reads from Equitable Growth and around the web.

Links from around the web

Four decades of economic inequality are driving American cities apart, writes Emily Badger and Kevin Quealy for The New York Times’ The Upshot, using the divergent paths of New York City and Binghamton, NY to illustrate inequality’s effects. In 1980, the gap between the top and the bottom income groups were about equal in both cities, but nowadays, wage inequality is much higher in New York City than in its upstate counterpart. “Economic inequality has been rising everywhere in the United States,” the authors write. “But it has been rising much more in the booming places that promise hefty incomes to engineers, lawyers and innovators. And those places today are also the largest metros in the country: New York, Los Angeles, San Francisco, San Jose, Houston, Washington … [i]n these places, inequality and economic growth now go hand in hand.”

The rise in street protests demanding societal change around the globe are being driven by a new type of inequality, according to a new UN Development Programme report, which notes that shifts around technology, education, and climate change are causing an inequality of opportunity rather than wealth that is increasingly motivating pushes for change. Jason Beaubien of NPR explains that as a result, our 20th century ideas for overcoming wealth inequality—finding ways for underprivileged communities to get better jobs that give them access to a larger slice of the economic pie—may not be relevant anymore for this new cohort of young people, who are “educated, connected, and stuck with no ladder of choices to move up.”

Some good news for workers in Washington state this week: The state Department of Labor and Industries approved the nation’s toughest overtime rules, entitling salaried workers (up to about $83,000 annually) who spend more than 40 hours a week on the job with time-and-a-half pay. The rules will phase in by 2028 and are expected to restore protections for thousands of workers in various job categories and boost the state’s middle class, writes Gene Johnson for AP.

More than 2 million federal workers are likely to receive paid parental leave for the first time in our nation’s history, reports Li Zhou for Vox. A U.S. military budget bill that includes 12 weeks of paid time off for all federal government employees to care for a new child is expected to pass through Congress before the end of the year, and President Donald Trump is expected to sign it. The pending new law will not affect those U.S. workers who are not employed by the federal government—and pales in comparison to other paid leave proposals put forward by Members of Congress—yet this is a definite step forward for a country where neither paid nor unpaid family or medical leave is a guarantee for most workers.

Society bombards us with the image of a two-parent household as the best family structure in which to raise a child. Not only is this held up as the gold standard, but families who deviate from this structure are also often blamed for all manner of societal ills. Perhaps it’s time to look at the research on this, writes Christina Cross for The New York Times. When we do, it becomes clear that access to resources, more than two-parent households, is what matters most for success—especially for African American children, whose social and economic disadvantages are commonly written off as stemming from the prevalence of unconventional family structures in black communities. This is not to say that the two-parent structure is bad by any means, Cross continues, but rather that other solutions would make more of a difference in the lives of black children.

Friday Figure

Figure is from Equitable Growth’s “Eight graphs that tell the story of U.S. economic inequality” by Austin Clemens.

Posted in Uncategorized