JOLTS Day Graphs: October 2019 Report Edition

Every month the U.S. Bureau of Labor Statistics releases data on hiring, firing, and other labor market flows from the Job Openings and Labor Turnover Survey, better known as JOLTS. Today, the BLS released the latest data for October 2019. This report doesn’t get as much attention as the monthly Employment Situation Report, but it contains useful information about the state of the U.S. labor market. Below are a few key graphs using data from the report.

1.

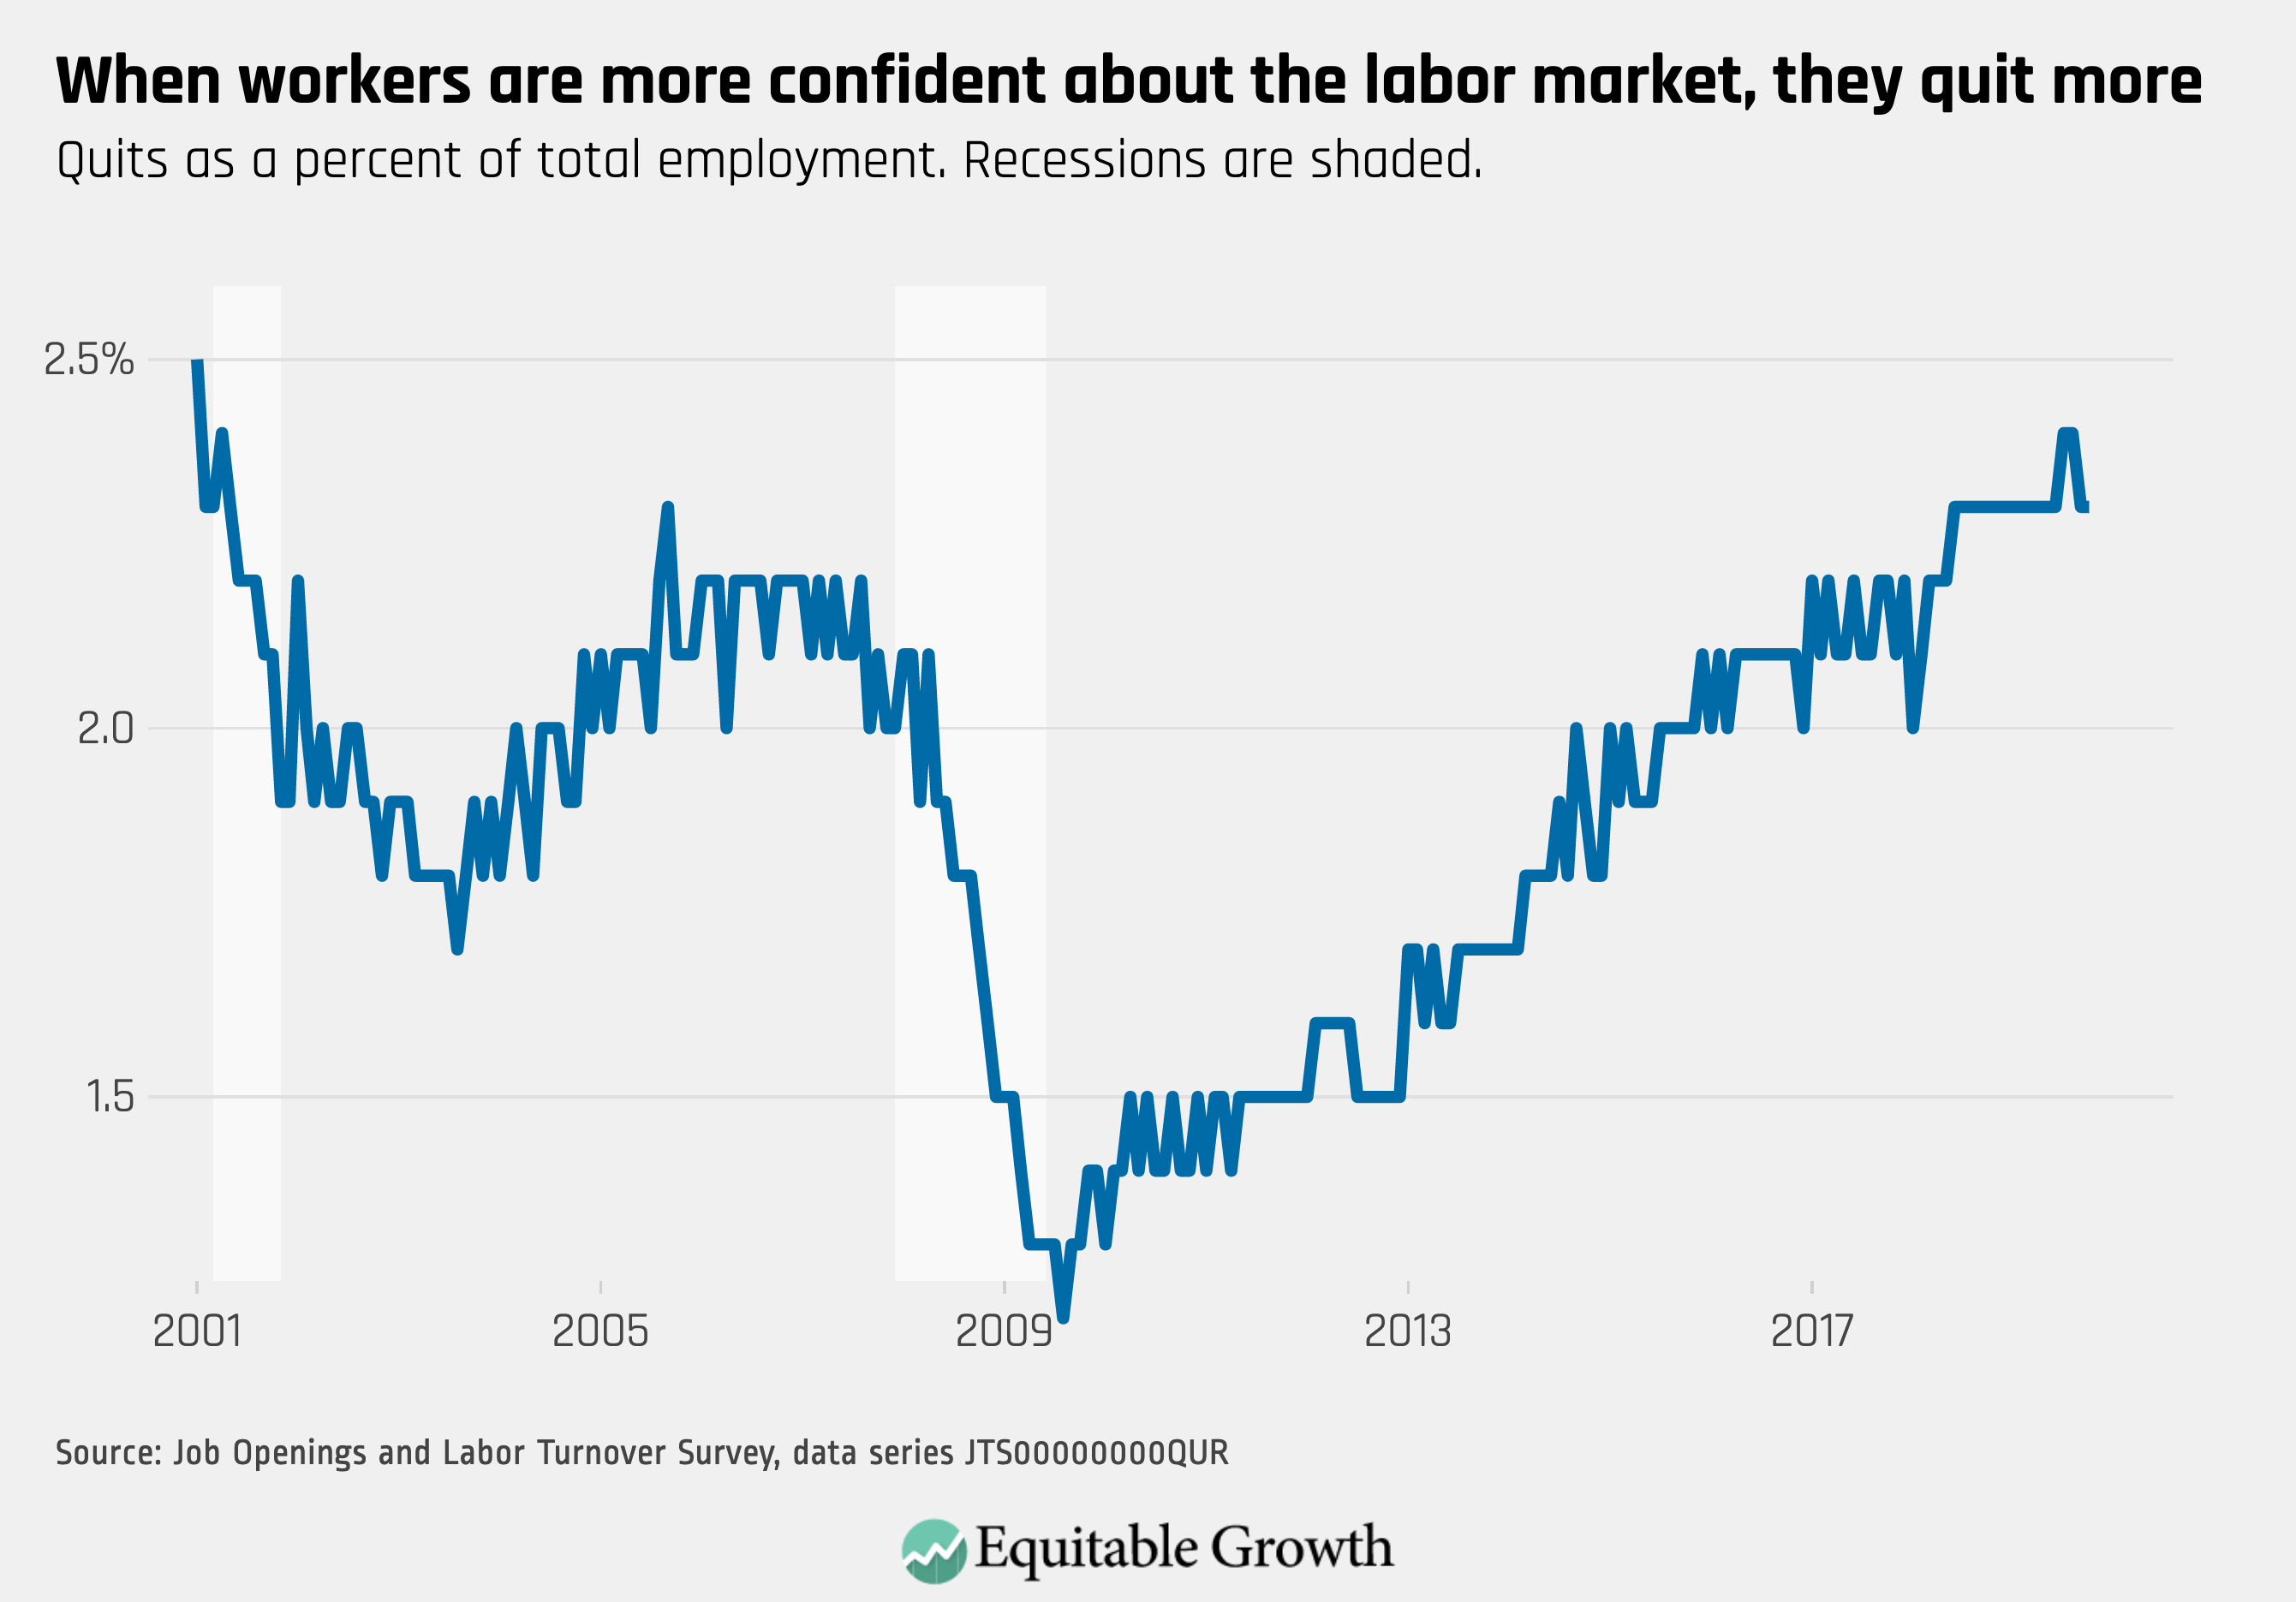
The quit rate continued to hold at 2.3% in October, where it has remained for over a year with the exception of a blip in last July.

2.

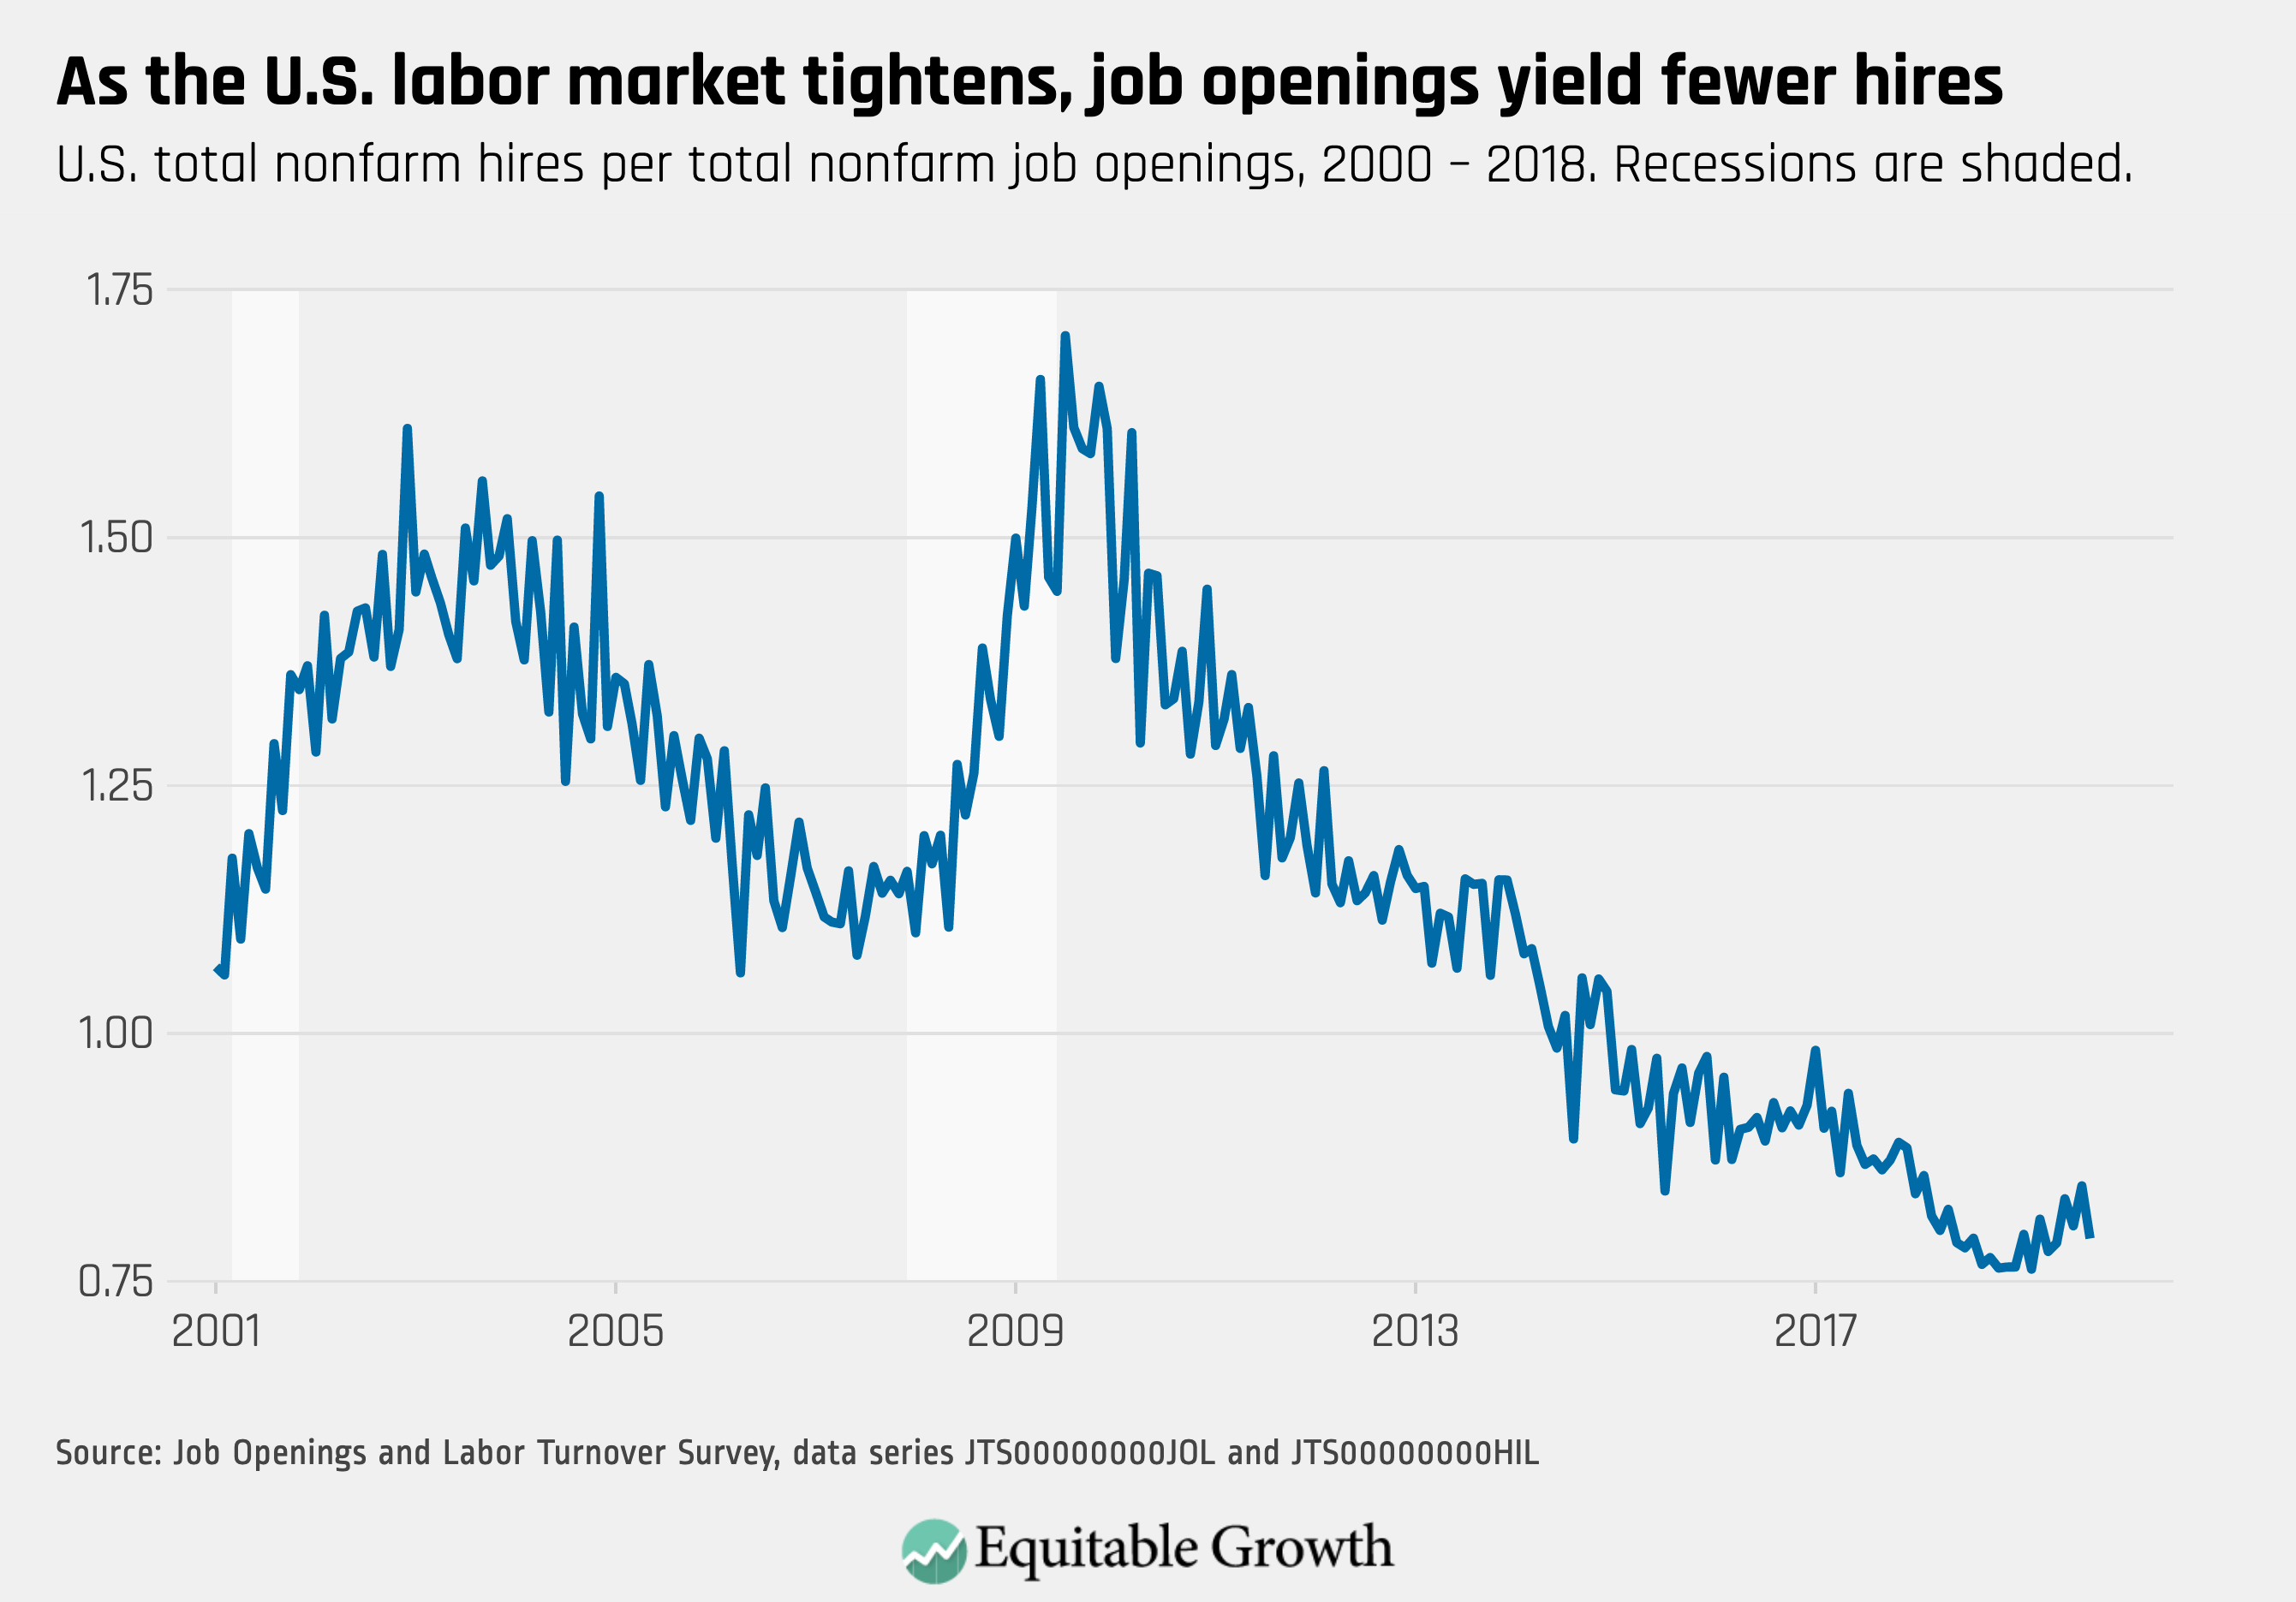
The ratio of hires to job openings remains below 1.0 as it trended downward in October to 0.79 from 0.85 in September.

3.

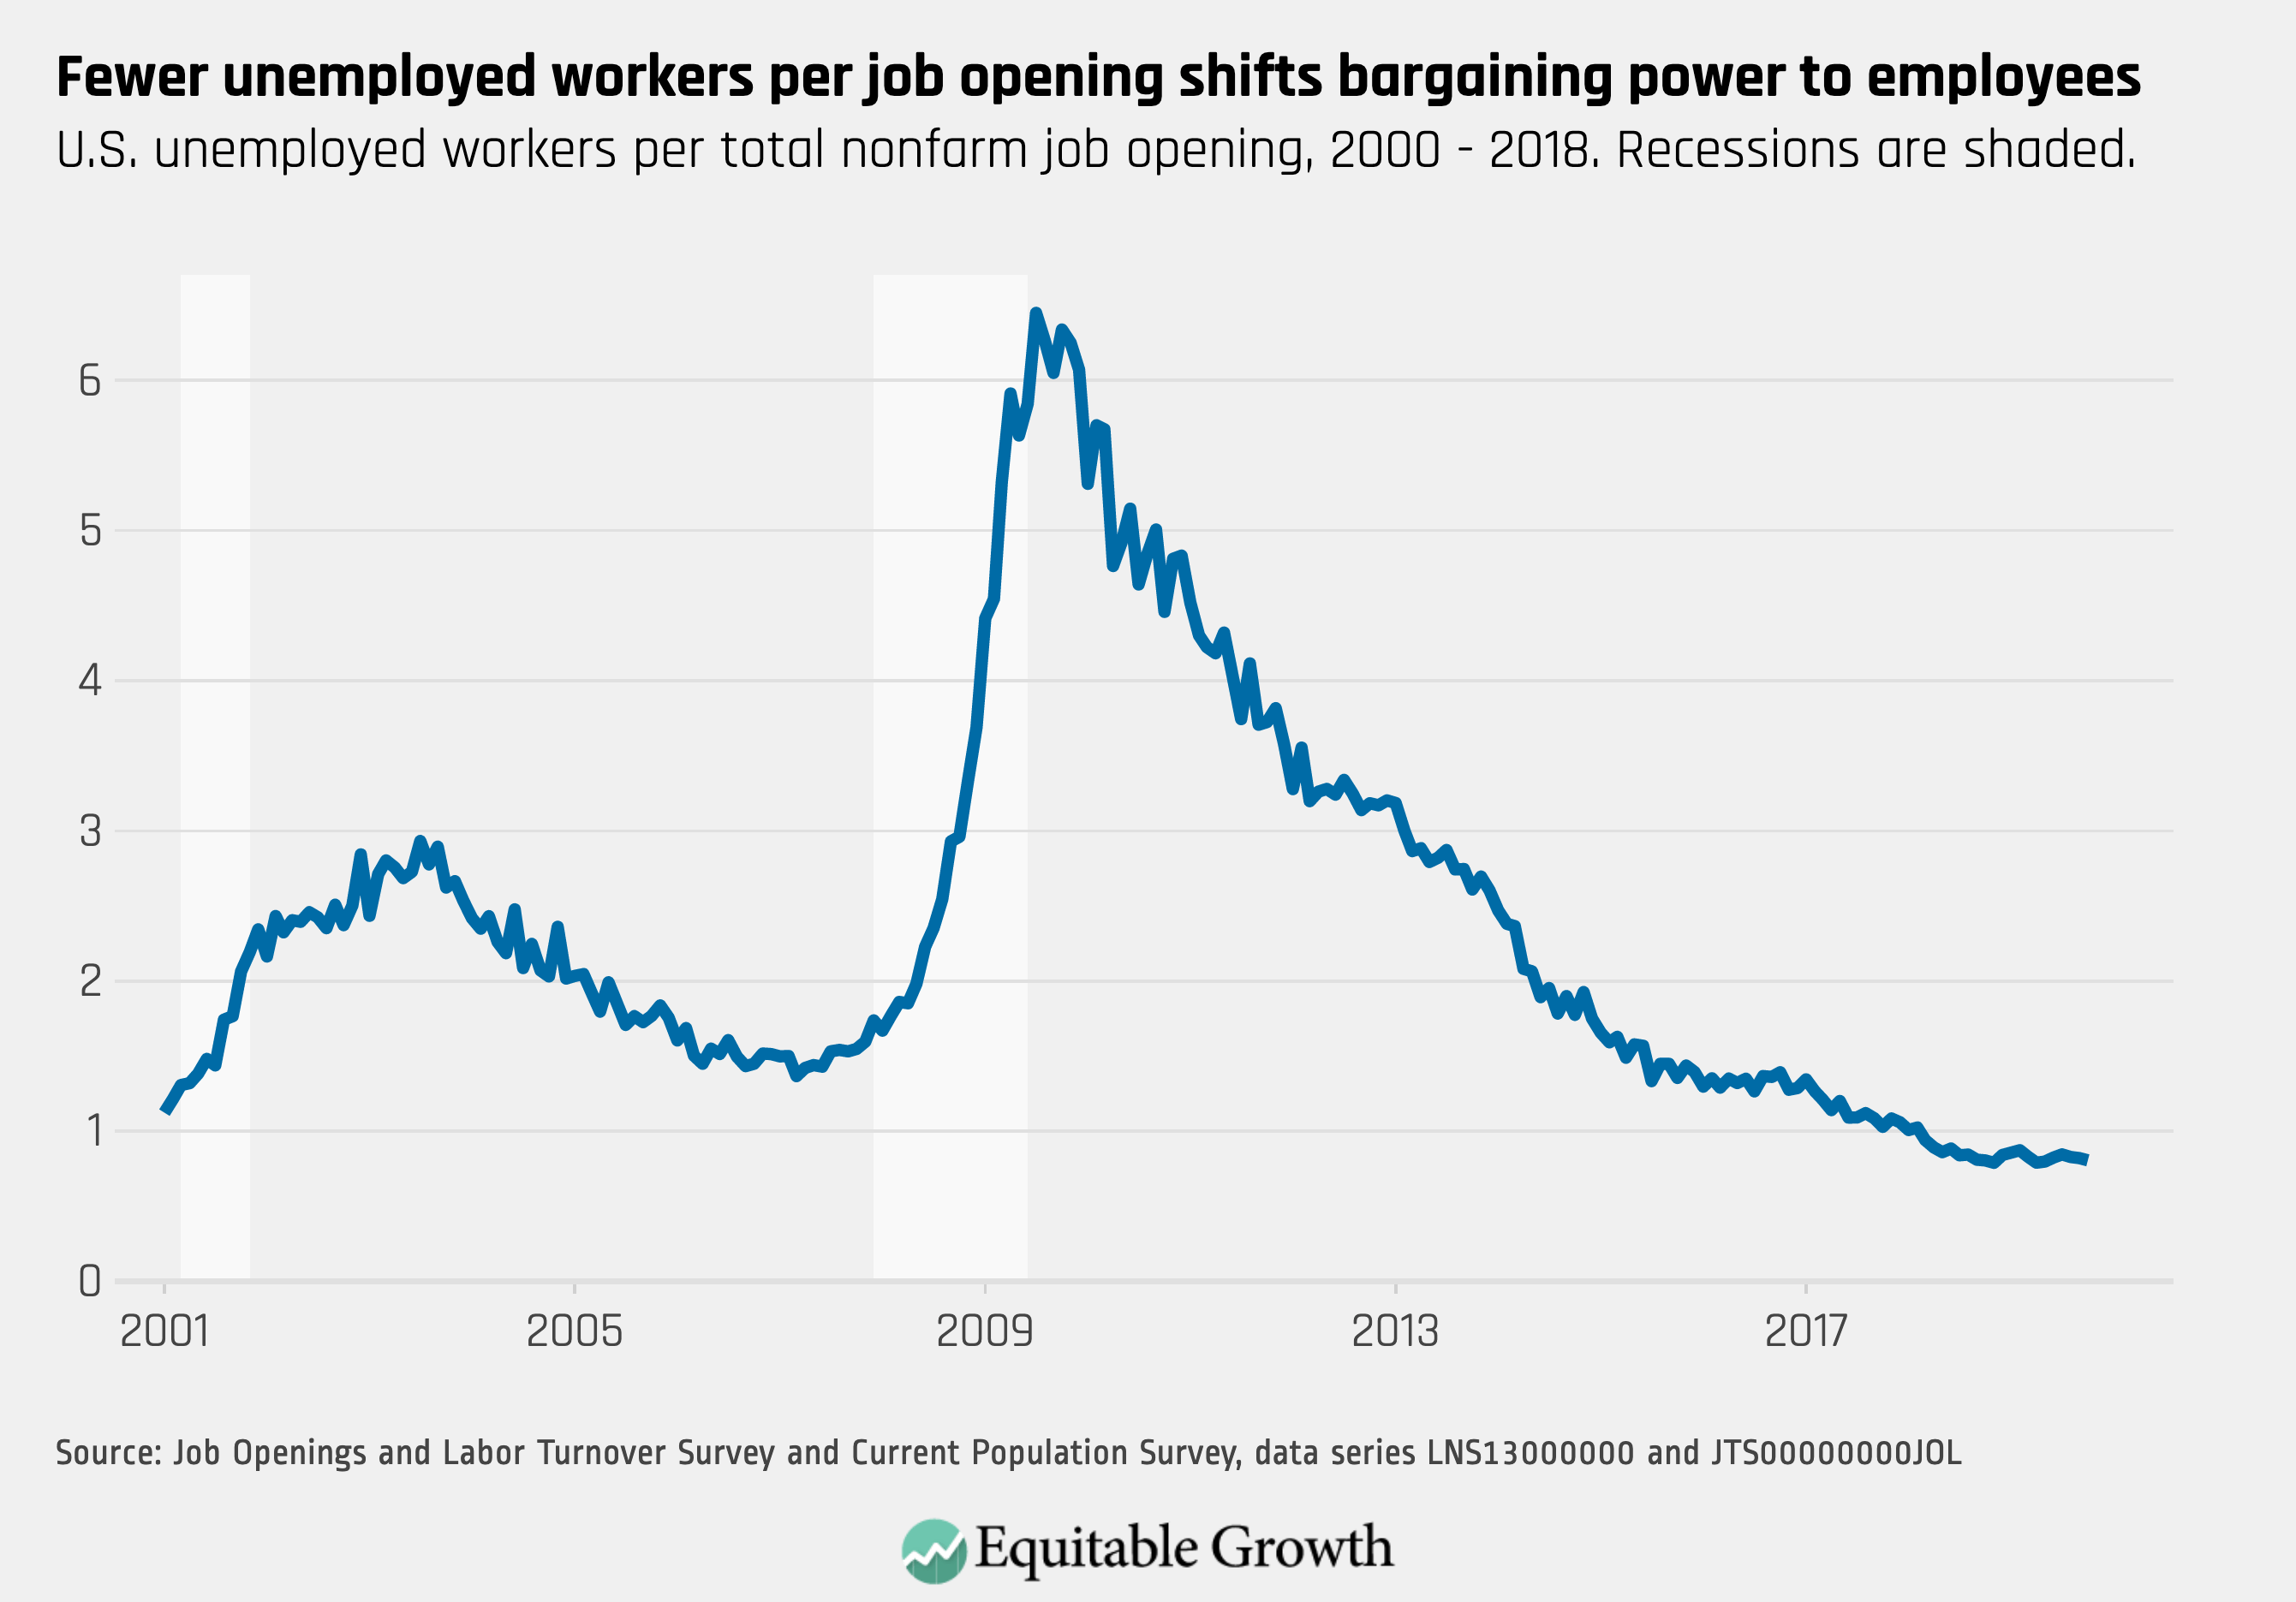
As job openings increased by 235,000 in October, to a total of 7.3 million, and unemployment remains low, there continues to be fewer than one unemployed worker per opening.
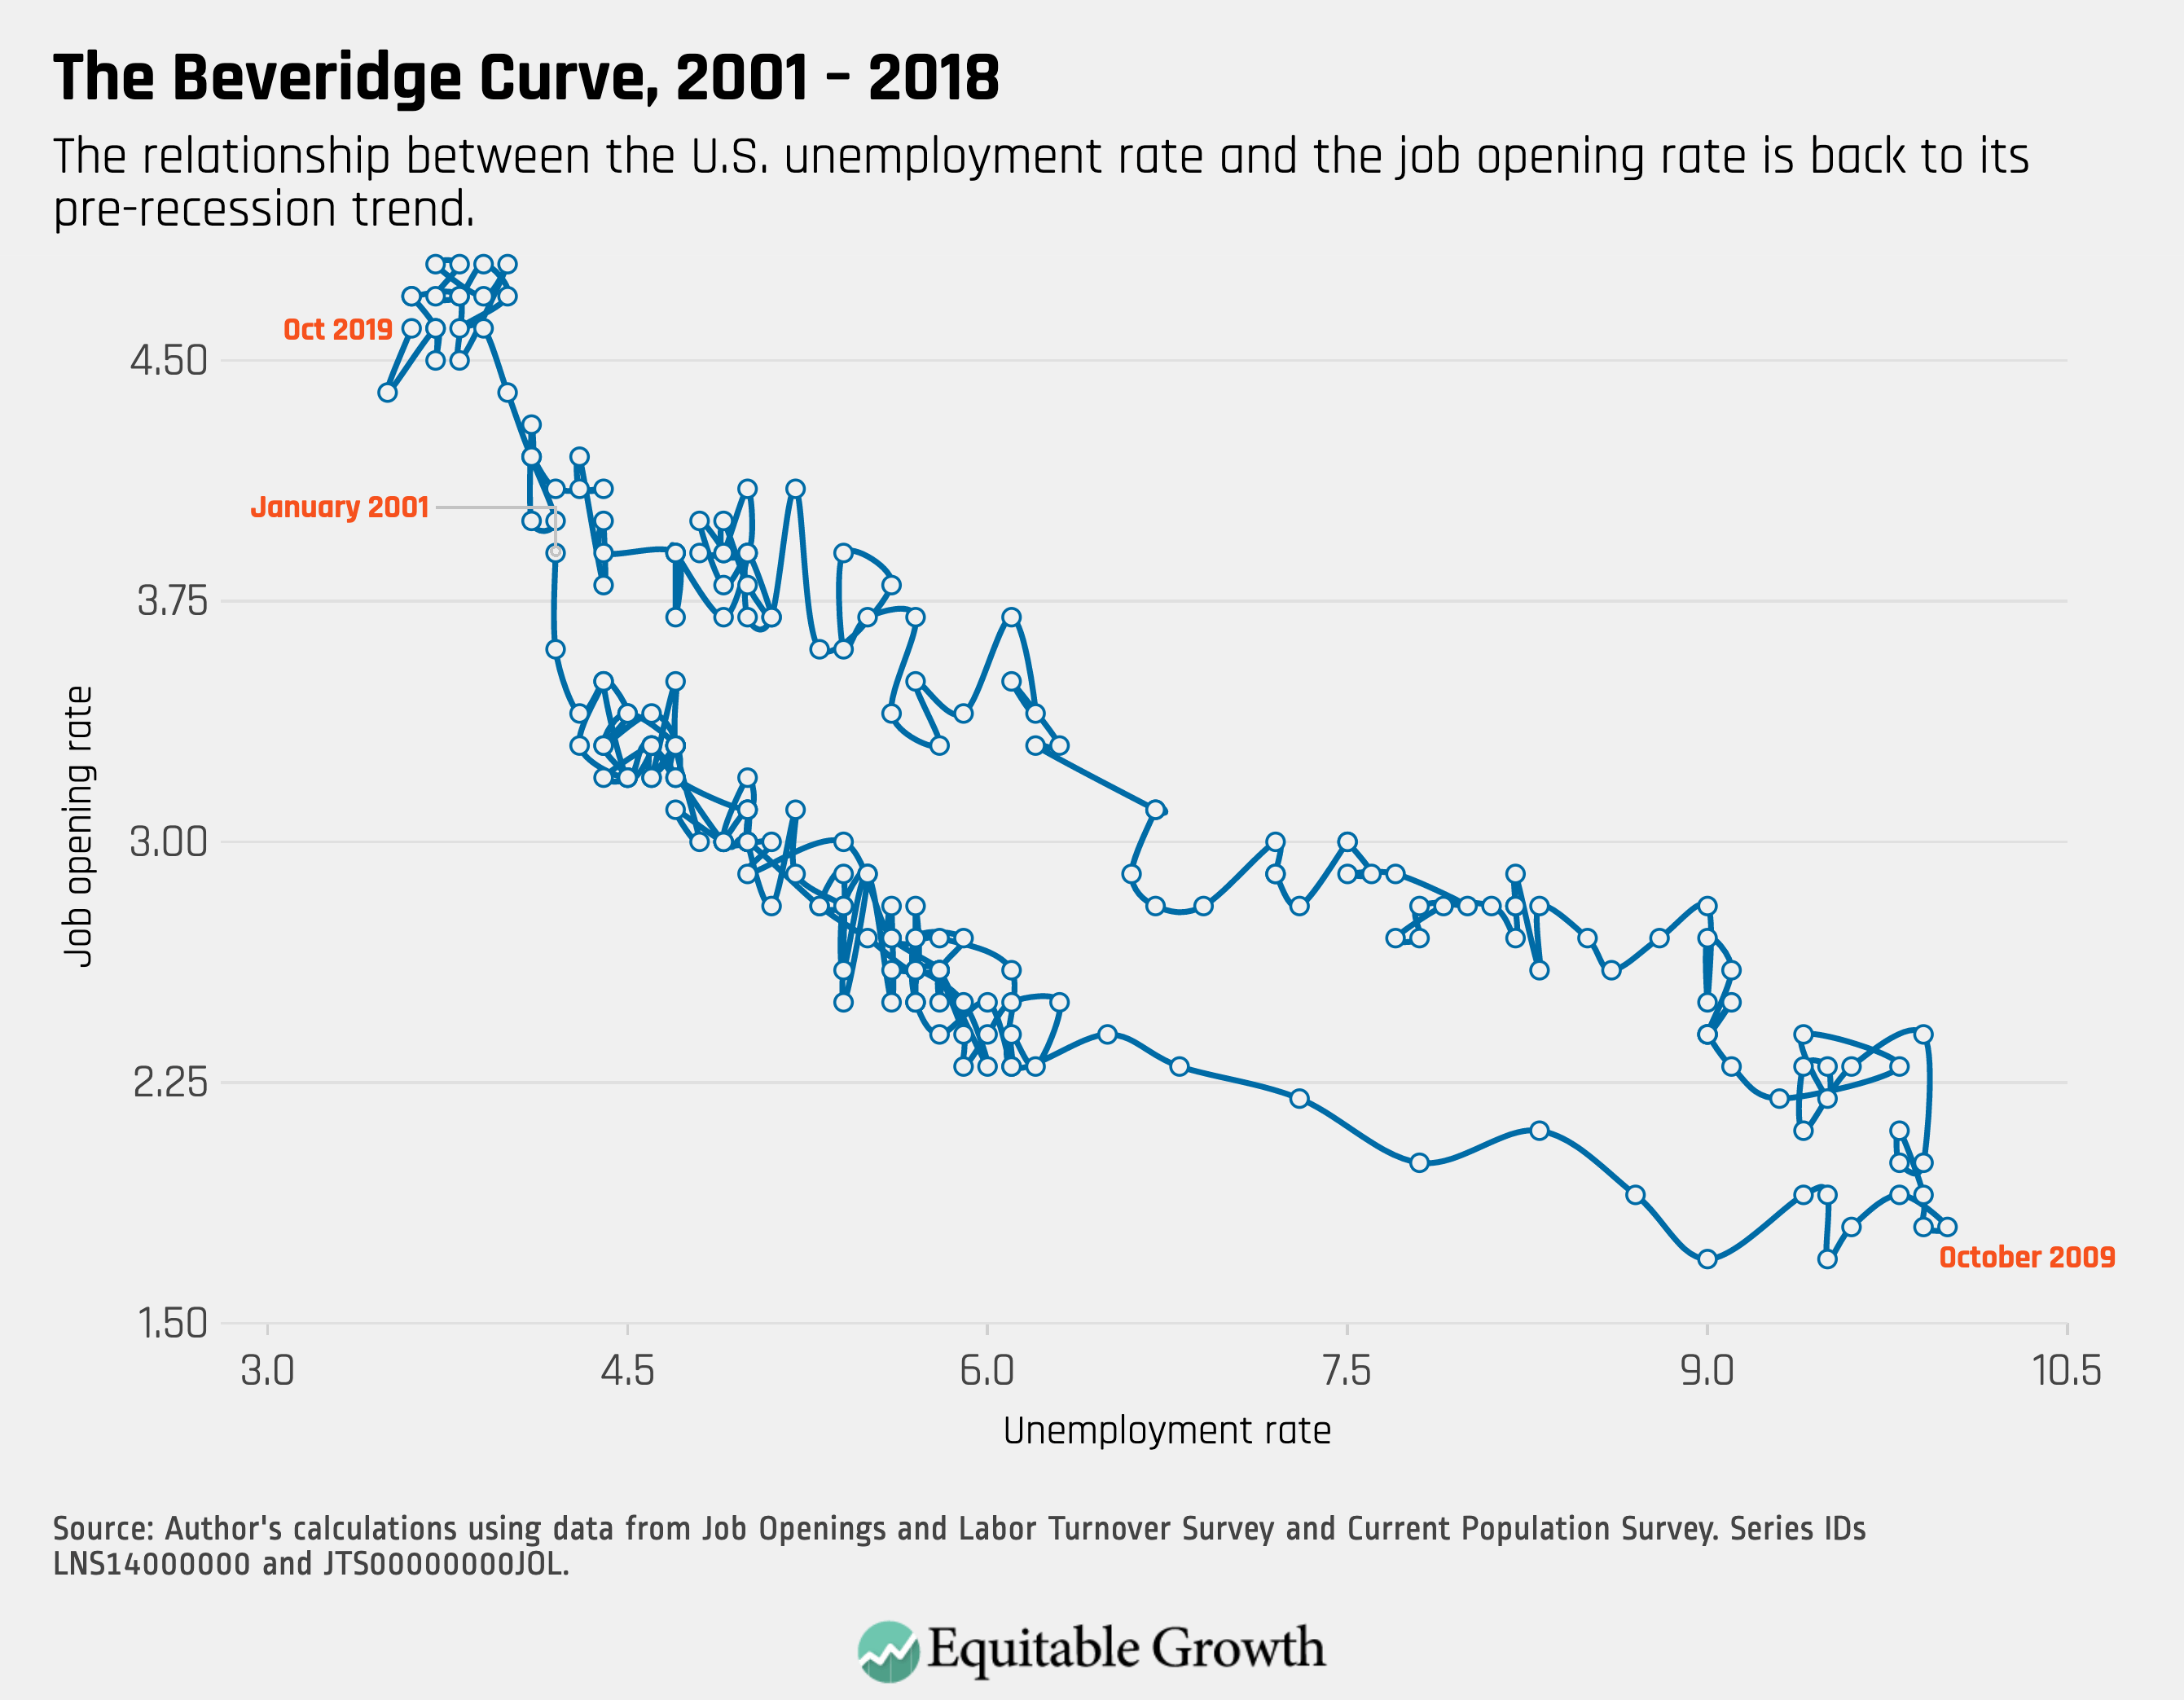
4.

The Beveridge Curve reveals the continuation of an expansionary labor market, with a low rate of unemployment and a high rate of job openings.

December 17, 2019

Topics

Job Mobility

Connect with us!

Explore the Equitable Growth network of experts around the country and get answers to today's most pressing questions!

Get in Touch