Michael Kades Director, Markets and Competition Policy Washington Center for Equitable Growth Statement for the Record House Committee on Oversight and Reform “Unsustainable Drug Prices (Part III): Testimony from AbbVie CEO”
May 18, 2021
This committee has done important work investigating prescription drug prices and the burden they place on both Americans’ pocketbooks and their health. As a former litigator and regulator with the Federal Trade Commission for almost 20 years, I hope to offer some historical context in which to understand the issues confronting the committee today.
Too often, too many pharmaceutical companies focus their innovation on new ways to delay competition, increase profits, and aggravate the burden on Americans struggling to pay their healthcare costs rather than on developing new lifesaving medications. AbbVie, whose CEO is testifying today, too often has been the posterchild for developing and employing anticompetitive practices that increase costs without any offsetting benefit.
Professor Craig Garthwaite, who is also testifying today, has correctly warned that there can be a trade-off between lowering cost and promoting innovation.1
These are hard questions that deserve careful consideration. But the type of anticompetitive conduct in which AbbVie has historically engaged represents the easy case. Congress can end these practices without any fear of deterring innovation.
AbbVie and pay-for-delay patent settlements
Before Humira and before Ibruvica, Solvay Pharmaceuticals—which AbbVie eventually acquired—protected its lucrative monopoly over Androgel, a testosterone replacement cream. Solvay paid not one, but two companies to refrain from selling their generic testosterone cream, in a practice known as a pay-for-delay patent settlement. The generic products would have taken 90 percent of branded Androgel’s sales at a substantial price discount. Although Solvay sued both companies for patent infringement, Solvay reached lucrative settlements with each generic competitor. The generic companies agreed to keep their testosterone creams off the market until 2015. Until then, each company would market Solvay’s branded product and receive a royalty on the branded product’s sales. Instead of trying to take sales from the monopolist, as a competitor should, the two companies would be trying to increase them; Solvay was literally sharing its monopoly profits to deter competition.
In a seminal case, Federal Trade Commission v. Actavis, the Supreme Court held that this type of agreement could violate the antitrust laws. By this time, AbbVie owned Solvay and the product Androgel. AbbVie could have quickly settled the case and opened the market to competition. Instead, AbbVie chose to fight tooth-and-nail for roughly 6 years, only settling with the FTC on the eve of trial. That delay helped prevent competition, allowed AbbVie to extract additional monopoly rents from consumers, and gave it the time to effect the product hopping strategy discussed below. The lesson here is that too many pharmaceutical companies use delay in the legal process to avoid judgement, increasing the effectiveness of their anticompetitive conduct.
AbbVie and frivolous patent litigation
By 2011, AbbVie faced a new competitive threat. Perrigo, a third generic company, filed an application to sell generic Androgel. Solvay itself had reached this conclusion and chosen not to sue Perrigo. AbbVie, which had acquired Solvay, ignored the merits. It understood that the time it would take Perrigo to win the patent case would keep the generic company off market for years and extend AbbVie’s Androgel monopoly.
The FTC brought an antitrust case against AbbVie. Antitrust cases based on sham litigation are somewhat of a unicorn because the legal standards are so high. The plaintiff must prove that “the lawsuit must be objectively baseless in the sense that no reasonable litigant could realistically expect success on the merits” and that “the baseless lawsuit conceals an attempt to interfere directly with the business relationships of a competitor . . . through the use [of] the governmental process—as opposed to the outcome of that process—as an anticompetitive weapon.”2
Despite those high standards, the District Court ruled in the FTC’s favor. Indeed, it found it indisputable that AbbVie’s case was objectively baseless—so frivolous that the court, in an antitrust case, did not need to hold an evidentiary hearing on the issue.3The court further found that the FTC had satisfied its burden on the second element as well.4 Finally, it ordered AbbVie to give up almost half a billion dollars that it earned by filing a sham lawsuit that delayed competition.5
The case has, however, an unfortunate ending. Although the Court of Appeals upheld the liability determination, it decided that the FTC could not deprive AbbVie of its illegal profits. In an unrelated case, the Supreme Court recently stripped the FTC entirely of its powers to seek monetary remedies like the one described here.
In short, AbbVie filed frivolous litigation, the very process of that litigation—not its outcome—delayed competition, that delay increased its profits by hundreds of millions of dollars—and AbbVie suffered no consequences.
AbbVie and product hopping
Neither the pay-for-delay settlement nor the frivolous litigation were isolated strategies. AbbVie had a larger plan to move patients from the original formulation of Androgel to a new version, a strategy referred to as product hopping.
New Androgel was not significantly better than the original, but it would blunt competition from the generic version of the original Androgel. AbbVie’s combined strategies delayed competition from generic versions of original Androgel until 2014, and AbbVie was able to convert 83 percent of the market before a generic entered. Once generic versions of the original version entered, however, new Androgel ceased gaining market share.
The pay for delay settlement and the sham litigation gave AbbVie additional years to move the market to the new, but not better, product.6 Had generic versions of the original product been available, consumers would have saved hundreds of millions of dollars by using the less expensive but equally effective generic alternative.
Implications for the Oversight hearing
Long ago, AbbVie moved on from Androgel, but this committee should not ignore the lessons of history. While strategies such as patent thickets may look different, they may be complex variations on a theme. For example, Humira’s original patents were set to expire in 2016. As that date approached, however, AbbVie began seeking a multitude of new patents for what seems to be minor improvements at best, but which have secured its monopoly for years and perhaps a decade or two.7 This committee should be skeptical of claims that every strategy that extends a company’s monopoly is necessary to protect innovation; too many are simply anticompetitive tactics to prevent legitimate competition.
On the bright side, Congress can change market dynamics. Pharmaceutical companies respond to rules and incentives. For example, federal courts, beginning in 2005, took a very lenient view of pay-for-delay patent settlements. In response, pharmaceutical companies increasingly entered into them. When, however, the Supreme Court rejected that approach, pharmaceutical companies largely abandoned this practice. (See Figure 1.)
Figure 1
Similarly, for years, some branded companies denied generic companies sample products that the generic manufacturers needed to obtain regulatory approval from the Food and Drug Administration, while other branded companies refused to negotiate required safety protocols with the generic companies. According to the U.S. Food and Drug Administration, these practices were increasing prescription drug costs by $13.4 billion per year.8 In December 2019, Congress passed the CREATES Act to stop these practices. Both the Food and Drug Administration and the industry believe the bill has largely been successful.9
There are three proposals that Congress could adopt to limit anticompetitive conduct in the pharmaceutical industry.
Stop pay-for-delay agreements: Despite the U.S. Supreme Court’s clear signal in the Actavis case that pay-for-delay settlements can be anticompetitive, the Federal Trade Commission continues to spend substantial resources and time challenging clear violations. Tougher laws, such as the Protecting Consumer Access to Generic Drugs Act10 or the Preserve Access to Affordable Generics Act,11 would deter such conduct and free up limited resources to attack other anticompetitive conduct.
Restore the Federal Trade Commission’s disgorgement authority: A relatively simple modification to the Federal Trade Commission Act would clarify the FTC’s authority to deprive companies of any illegal profits they earned—authority that is critical to deterring highly profitable but anticompetitive conduct. Something is wrong when courts decide there are no repercussions for violating the antitrust laws.
Deter strategic behavior such as product hopping and patent thickets when done to protect monopolies: By modifying patent law, the antitrust laws, and FDA law, Congress can likely deter purely rent-seeking activity that harms consumers without undermining legitimate incentives to innovate new and better pharmaceutical products.
Conclusion
This committee’s investigation is critical to understanding the scope of the problems that unnecessarily increase prescription drug costs. My statement has offered some historical context to understand today’s issues. Abbvie’s history of preventing competition through weak patents and frivolous lawsuits should should inform this Committee investigation into Abbvie’s current practices with regard to Humira and Imbruvia. I would be happy to work with the committee in any way to help it complete its important work.
1. As I previously wrote, burning rubber and leaving skid marks as you rejoin traffic at speed is not the same thing as boiling over and melting your engine. My view is that we should not worry about an inflationary spiral from “overheating” until we have made back the 9 percentage points by which the price level today has undershot expectations of where prices today would be back at the start of the Great Recession. Read Equitable Growth’s “Overheating is not a concern for the U.S. economy,” which says: “Plans for further public investments should be judged primarily on the merits of those investments. Arguments that the U.S. economy will overheat ignore the need for additional investments in the economy and rely on the possibility of future policy errors to argue against needed investments today … The Congressional Budget Office’s estimates of potential GDP are highly influential, but critics argue, with substantial justification, that CBO analysts have been unduly pessimistic about the capacity of the economy in recent years, and thus overstate the risk of overheating … The U.S. economy has 10 million fewer jobs today than it likely would absent the coronavirus pandemic and resulting recession. This is why now is not the time for concern about overheating … Wendy Edelberg and Louise Sheiner of The Brookings Institution estimate that legislation of approximately the scale of the American Rescue Plan would restore actual GDP to potential GDP after the third quarter of 2021, cause GDP to exceed potential GDP temporarily by a modest 1 percent in the fourth quarter of 2021, and then allow GDP to roughly match its potential path in the middle of 2022 … Concerns about an overheated economy typically focus on a set of potential consequences that could arise if it remains overheated for a long time. If an economy remains overheated for many years, then that could lead to higher inflation. If the Federal Reserve, in response to that inflation, pushes the U.S. economy into recession by pushing up interest rates, then that could cause widespread harm … This concern is less about overheating specifically, and more about extended overheating followed by a bad policy response.”
2. This event looks very much worth attending this week. Register now for Equitable Growth’s Webinar: How to strengthen U.S. labor standards enforcement to protect workers’ rights on May 20, 2021 2:00 p.m. – 3:30 p.m. EDT. The event will examine “The COVID–19 pandemic that led to record unemployment [and] also devastated state and local government revenues across the country. With governments still facing extraordinary budget deficits, this fiscal crisis makes it even more difficult for state and local labor enforcement agencies to respond to labor violations, such as wage theft, just when this work is needed most. In this webinar, Equitable Growth grantees Janice Fine, Daniel Galvin, and Jenn Round of the Center for Innovation in Worker Organization at Rutgers University outline how labor standards enforcement agencies can strategically target high-violation industries. They will also describe how agencies can partner with worker centers, unions, legal advocacy organizations, and other community-based organizations to more proactively address labor rights violations.”
3. A key problem in dealing with a large and dissipative finance sector—one that consumes nine percent of society’s income rather than the three percent that it consumed back in the 1950s, and yet does not show any signs of adding anything of value in exchange for that extra six percentage points of society’s income—is that the overwhelming bulk of payments to financial intermediaries are “voluntary” yet not even semi-voluntary in terms of monopoly or monopsony rents. People think that they are getting a good deal when they pay the financial sector, even though the overwhelming evidence is that they are, in fact, not. Read Amanda Fischer, “The rising financialization of the U.S. economy harms workers and their families,” in which she writes: “Financialization refers to the process by which the financial sector—banks, private equity firms, hedge funds, stocks and derivatives exchanges, and other conduits through which money flows between those who have it and those who need it—takes up a larger and larger share of the U.S. economy, fails to allocate capital to its most productive uses, and increasingly results in the hoarding of economic, and thus political, power at the top of the income and wealth ladders … Corporate leaders themselves use their outsized economic power to influence the policymaking process in their favor … feedback loops where enhanced economic power begets more political power, with workers increasingly short-changed.”
Worthy reads not from Equitable Growth:
1. Noah Smith and I thought about what we now believe about capital gains taxes on our podcast, “Hexapodia XIV: The Capital Gains Taxes,” offering these key insights: Arguments against higher taxes that may have been somewhat plausible back in the days of 70 percent or so maximum individual and 40 percent or so maximum capital gains tax rates simply do not apply now … Right-wing parties that don’t think they can credibly make the argument that cosseting their core constituencies is necessary for rapid economic growth search for some non-economic cleavage in which the rich and the right-thinking poor, or the right-colored poor, can be on one side and the people who seek a fairer and more equal distribution of income and higher taxes on the rich can be put on the other … Capital to fund investment is really not a big constraint right now—incentivizing savings in financial assets really is just pushing on a string … Companies with investments that have high societal value in expansion need to be properly incentivized, and that is best done either by the smell of more profits next year from serving a larger market with lower costs of production through larger scale, or through the government paying and so getting prices righter than the free market can get them.”
2. Raising capital gains taxes produces large increases in societal well-being only if it is accompanied by effective loophole-closing. The very sharp Len Burman believes that it is indeed the case that the Biden Plan does this. Read his “Biden Would Close Giant Capital Gains Loopholes—At Least For The Rich,” in which he writes: “Critics of Biden’s proposal have several complaints. None hold water. Critics worry that raising capital gains taxes would lower the after-tax return for individual investors and drive down stock prices. However, taxable individuals hold less than one-third of corporate stock. The rest is owned by nonprofits, retirement plans, life insurance companies, and foreigners—none of whom pay individual income taxes on US capital gains and dividends.”
3. Best-case—the most optimistic scenario for employment—is employment corresponding to a “true” unemployment rate of 2.5 percent in 2023 with core inflation at 2.75 percent a year. That is enough to get inflation expectations up to the Fed’s target of 2.5 percent a year on a CPI basis. That is not enough for anyone reasonable to claim that an ever-upward inflationary spiral is on the way. The definition of “stagflation” is a world in which expectations are anchored on the belief that inflation is going to rise over time, hence an unemployment rate greater than the natural rate is required in order to hold inflation steady. That does not seem to be the world we are headed for in the optimistic scenario. And that stagflation equilibrium is much further away in the non-optimistic scenarios. Read Laurence Ball and his co-authors, “U.S. inflation: Set for take-off?,” in which they write: “How high is the ongoing U.S. fiscal expansion likely to push inflation? This column presents new evidence that underlying (weighted median) CPI inflation has so far steadily declined since the start of the COVID–19 crisis, broadly as predicted by its historical Phillips curve relation. If the ongoing fiscal expansion reduces unemployment to 1.5–3.5 percent, as some predict, underlying inflation could rise to about 2.5–3 percent by 2023. If the fiscal expansion is temporary and monetary policy remains clearly communicated and decisive, there is little risk of a 1960s-type inflationary spiral.”
This is a post we publish each Friday with links to articles that touch on economic inequality and growth. The first section is a round-up of what Equitable Growth published this week and the second is relevant and interesting articles we’re highlighting from elsewhere. We won’t be the first to share these articles, but we hope by taking a look back at the whole week, we can put them in context.
Equitable Growth round-up
Tax Day 2021 is Monday, May 17. As many Americans prepare to file their tax returns and await their refunds, Corey Husakwrites that some of the wealthiest Americans will engage in complicated tax evasion techniques to avoid paying their fair share—costing the U.S. government up to $700 billion this year, according to Treasury Secretary Janet Yellen. This tax evasion trend has gotten so severe, Husak continues, that the Biden administration is proposing several measures to crack down on it and try to close the so-called tax gap. Husak looks at the ways tax evasion contributes to U.S. economic inequality, the various extralegal methods these rich tax cheats use to evade taxation and hide their income from the IRS, and the impact of declining resources for the IRS to investigate tax evasion and enforce the tax code. Policymakers must understand these sources of tax evasion, he explains, in order to enact strategies and proposals that will close the tax gap.
If the state of the U.S. economy were to be measured solely based on stock prices and Wall Street’s performance, then it would appear to be booming. But this standard does not provide an accurate view of what’s really going on, particularly amid the K-shaped economic recovery from the coronavirus recession, in which the wealthy are becoming ever wealthier while the nonrich continue to struggle. The financial sector’s tightening grip on the economy leads to expanding inequality and wealth divides—and policy enables this trend. Amanda Fischer explores a recent hearing before the U.S. Senate Committee on Banking, Housing, and Urban Affairs, which looked at the financialization of the U.S. economy, its effect on workers and inequality, and its contribution to racial economic disparities in the United States. She also provides some policy proposals for addressing this financialization, including investing in physical and care infrastructure, boosting worker power, strengthening financial-sector regulations, and making the tax code fairer.
Earlier this week, the U.S. Bureau of Labor Statistics released data on hiring, firing, and other labor market flows from the Job Openings and Labor Turnover Survey, better known as JOLTS, for March 2021. The report contains useful information about the state of the U.S. labor market, including the quits and job openings rates. Kate Bahn and Carmen Sanchez Cumming put together a few key graphs using data from the report, highlighting the major trends in the release.
A number of states are planning to end the expanded Unemployment Insurance of $300 extra per week related to COVID-19 emergency benefits, arguing these benefits—a lifeline for millions of U.S. workers amid this economic crisis—discourages people from going back to work. As the U.S. economy reopens and vaccination rates jump, some sectors are still experiencing challenges to rehiring their workforce, but there is nothing in the data to suggest that expanded UI benefits are behind that trend. NBC News’ Dartunorro Clark reports on several governors’ reasoning behind the decision to end emergency UI benefits, which critics call “ill-informed and cruel.” For more details on what’s really at stake as states cancel this federally funded UI expansion, check out this factsheet by The Century Foundation’s Andrew Stettner. He details what will happen to workers in need as these programs are cut, how cuts will disproportionately impact workers of color, and why this policy choice is short-sighted. Stettner also explains the Biden administration’s alternative approach to the issue of getting workers back into jobs.
The stock market is booming, and while this is great news for anyone with investment or retirement accounts, it also signals a deeper issue within the U.S. economy. NPR’s Greg Rosalskydelves into why soaring profits and stock prices are eating into the incomes of U.S. workers and exacerbating inequality, hurting the overall economy. It’s part of why wages have stagnated, why fewer people are in the workforce, and why startups haven’t been growing as much in recent decades, he continues. Rosalsky looks at the rise of market power in the United States since the 1980s, why this rise has occurred, how it has affected the broader economy, and what policymakers can do to address it.
Tens of millions of Americans will duly pay the taxes they owe and file for their refunds by Tax Day in 2021, which was delayed until May 17. Meanwhile, some of the wealthiest Americans will engage in complicated tax evasion schemes that will cost the U.S. government $700 billion this year, according to U.S. Treasury Secretary Janet Yellen.
Tax evasion has reached such heights that the Biden administration is proposing bold measures to crack down on rich tax cheats. And academic research is leading the way in exposing the schemes and frauds that the rich use to evade taxes and how to close the so-called tax gap.
The tax gap is the difference between what taxpayers owe to the IRS and what is actually paid. Because unreported or hidden income cannot be directly observed, academic research is key in documenting the sources and size of the tax gap. For instance, Natasha Sarin, now at the U.S. Department of the Treasury, and Larry Summers at the Harvard Kennedy School of Government corroborate Secretary Yellen’s assertion that the tax gap is about $700 billion this year and outline many steps to close it.
This issue brief examines the following factors that help determine the size of the tax gap:
The growth of economic inequality
The availability of extralegal means to hide income from the IRS
Falling IRS resources to investigation tax evasion and enforce tax laws
Understanding these sources of evasion can lead to strategies to close the tax gap.
Inequality fuels tax evasion
Growing income and wealth inequality in the United States over the past five decades has several serious implications for tax evasion. First, as inequality grows, the rich find more and more ways to hide their income (to pay for tax avoidance schemes, for instance) and also have more incentives to find ways to do so (more money to protect).
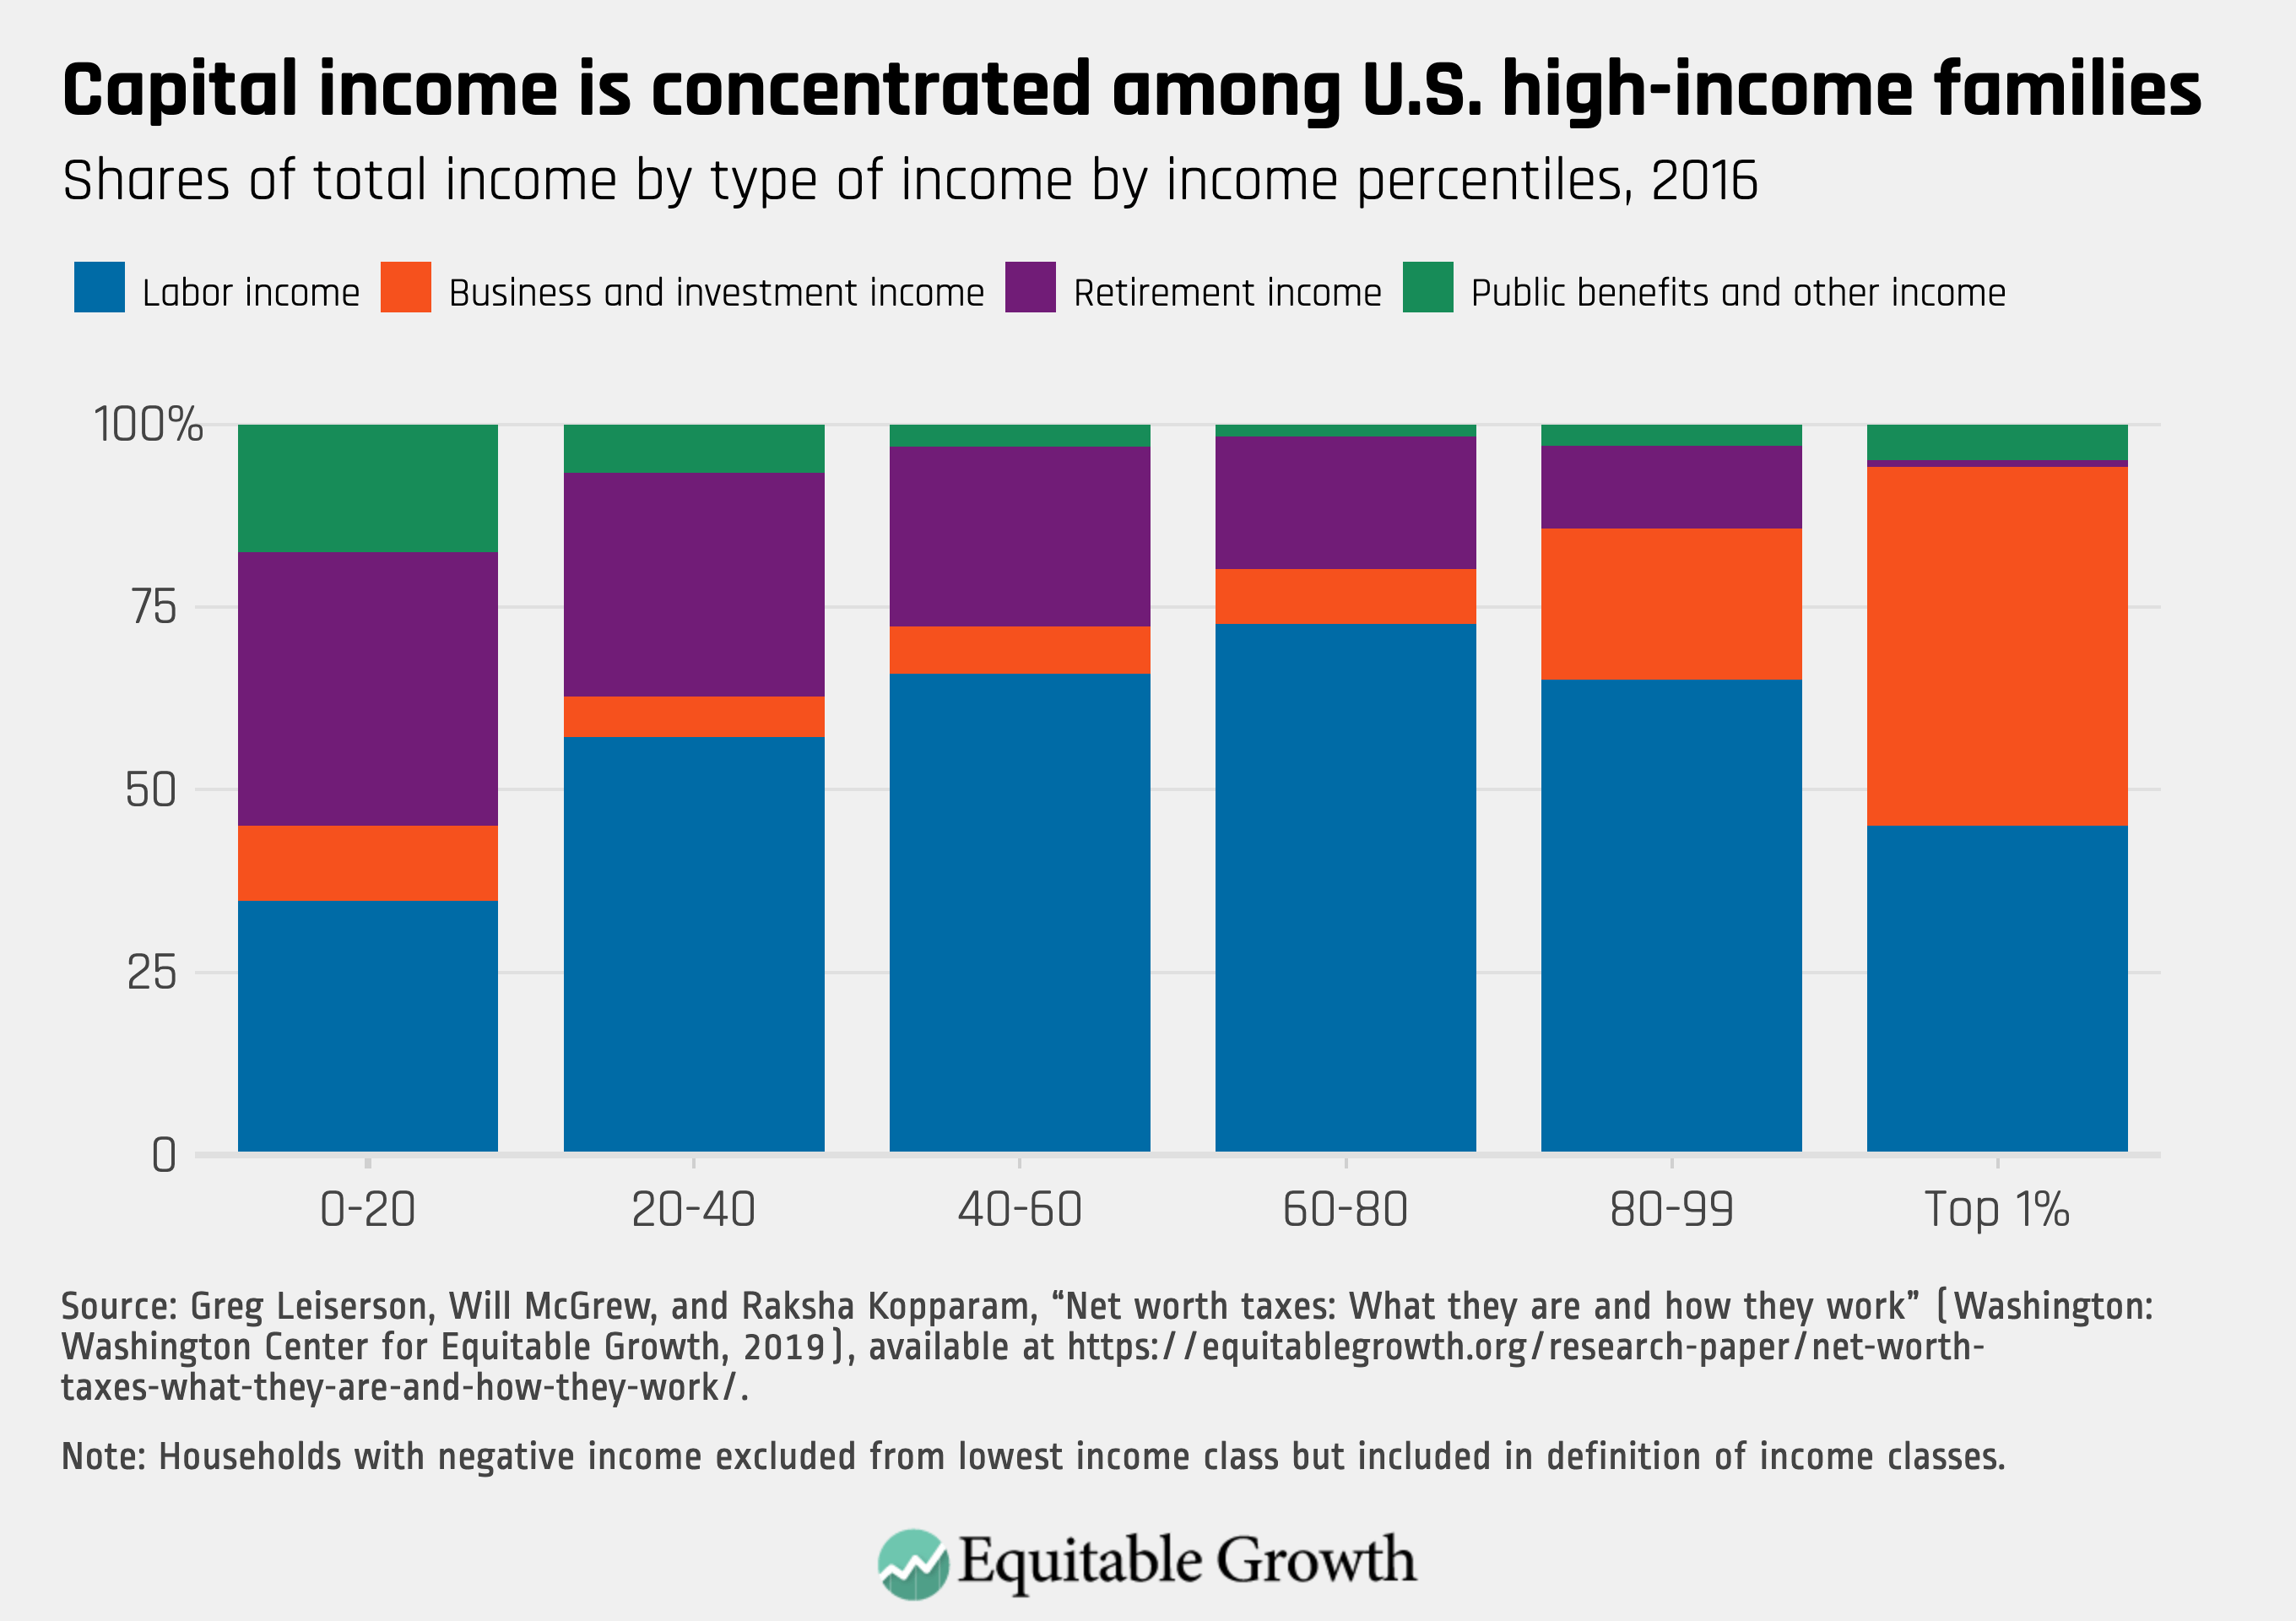
Second, the income earned by the top 1 percent is fundamentally different than the income most Americans earn. Most Americans earn income primarily from their wages and secondarily from retirement income and public benefits. These income sources are easily tracked and verified by the IRS. Meanwhile, the wealthy are more likely to gain income from their businesses or capital investments. (See Figure 1.)
Figure 1
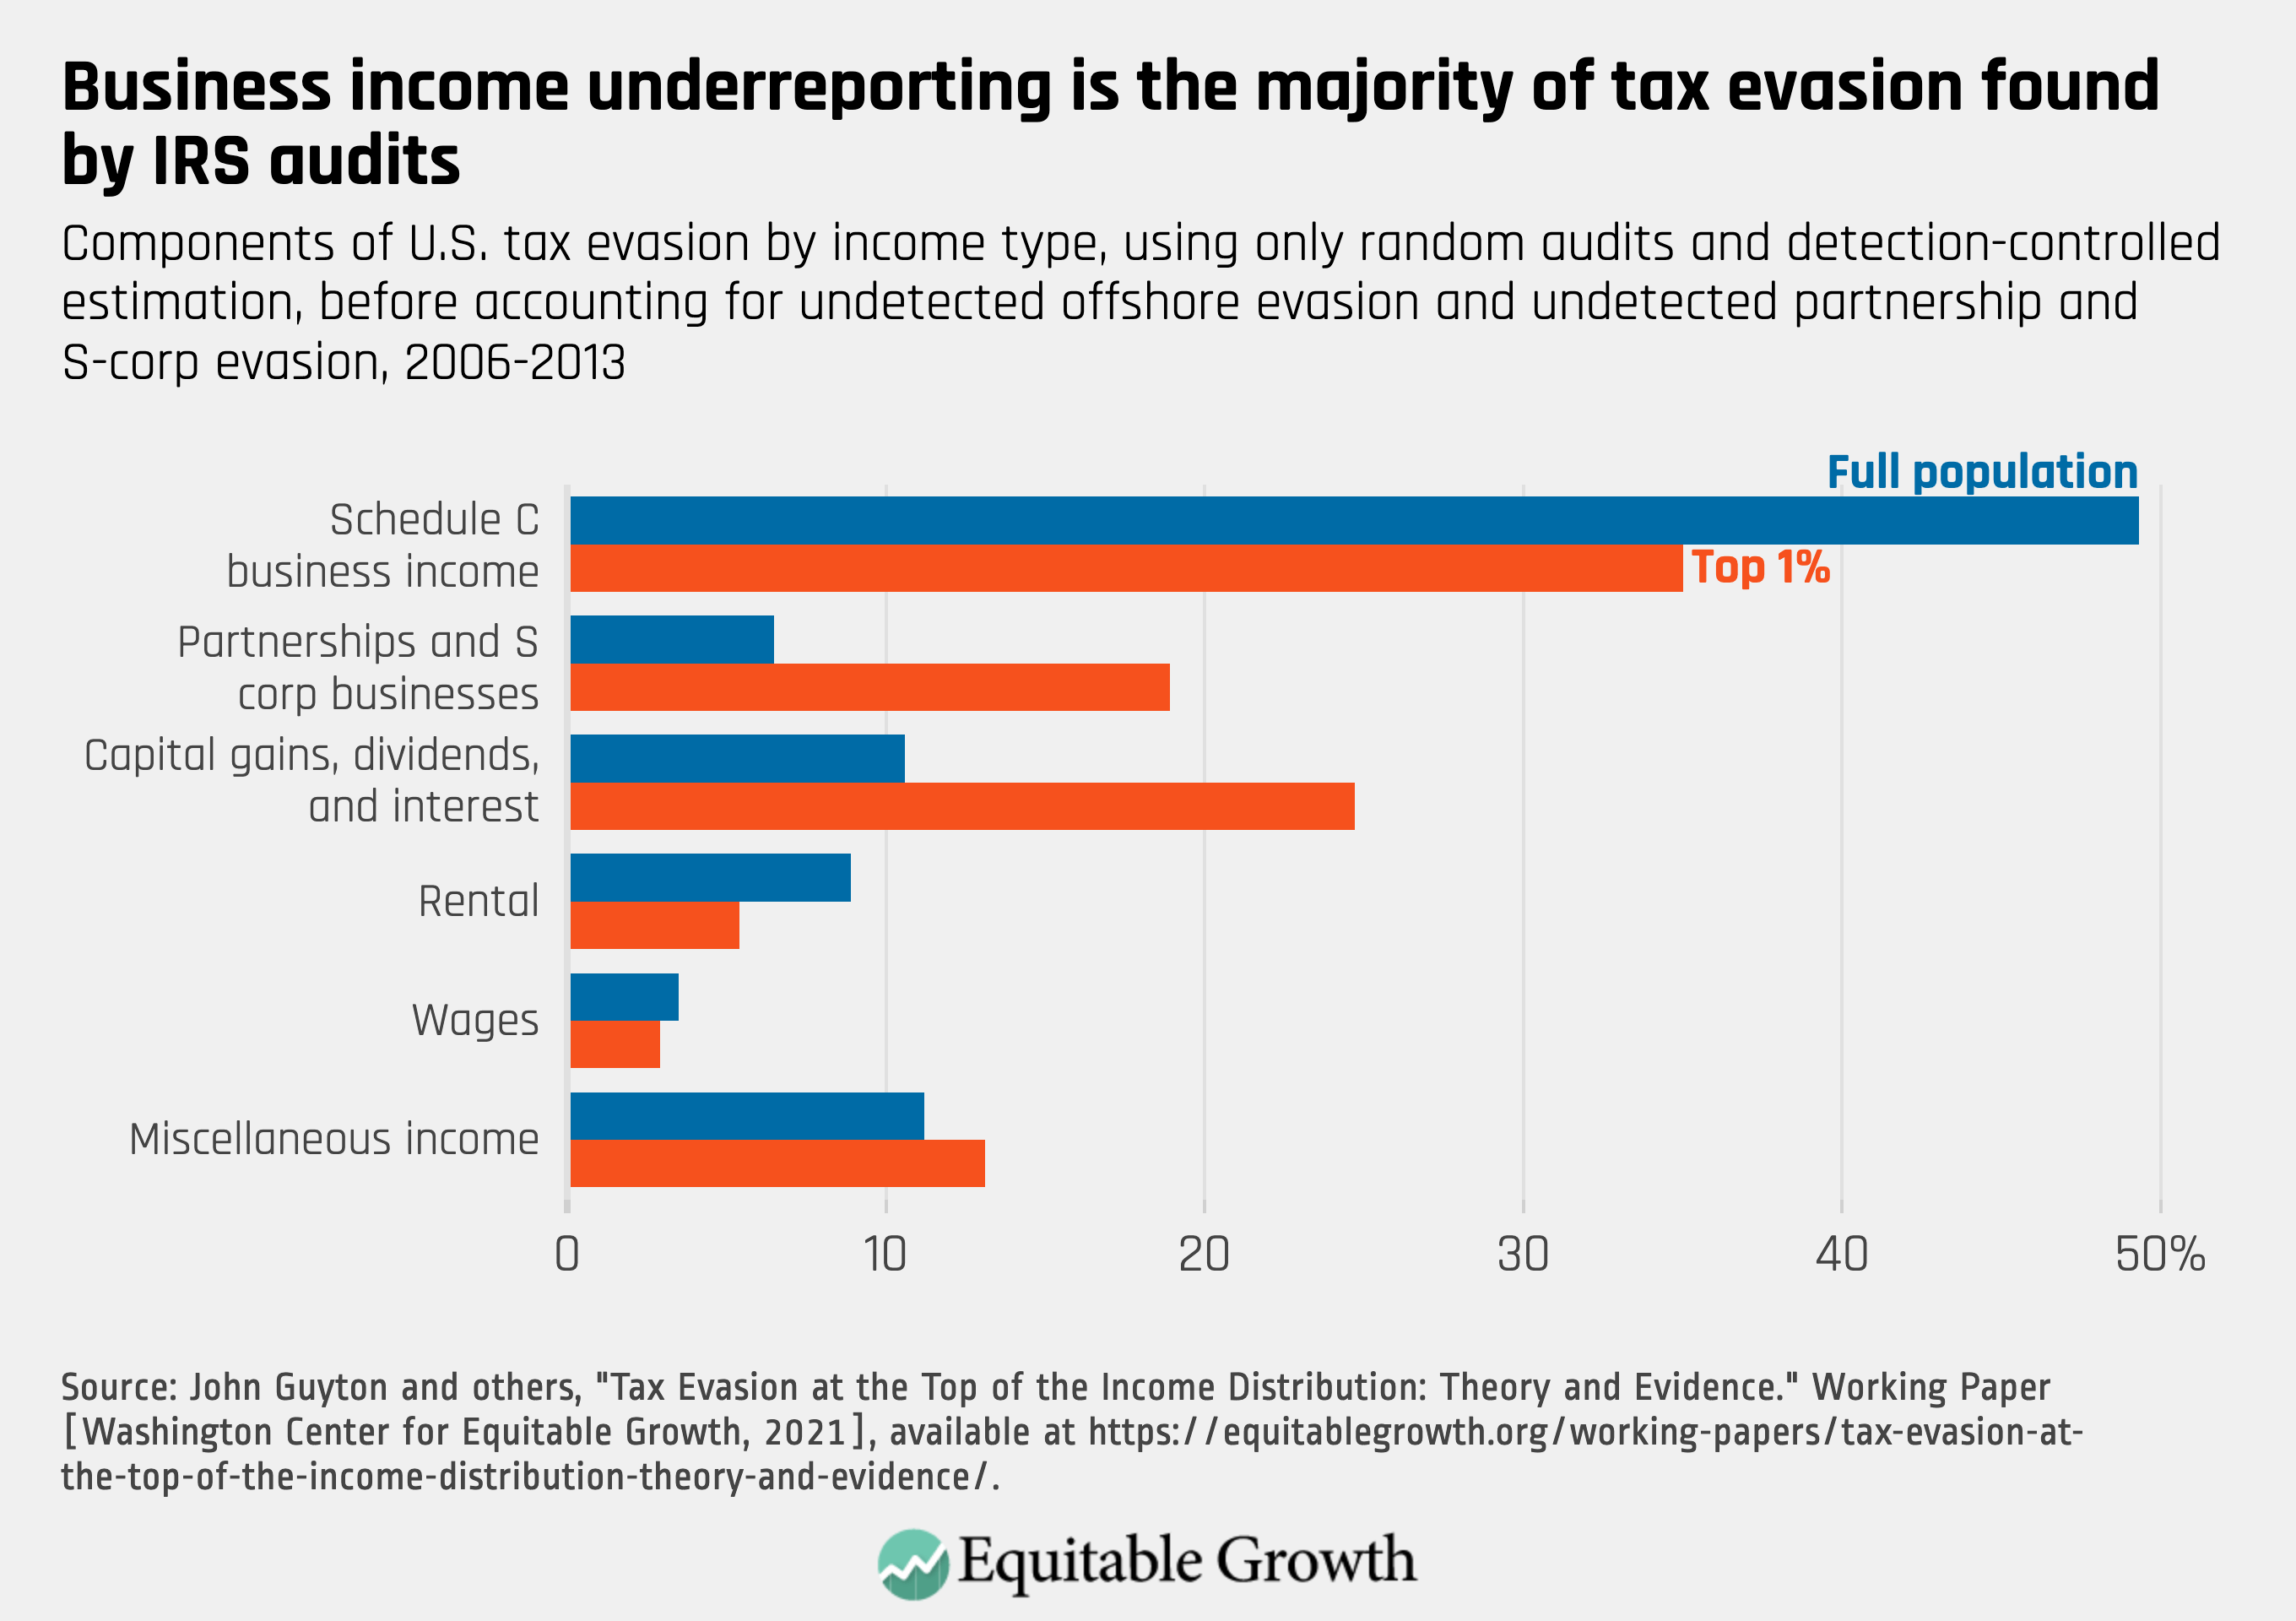
Business income and investment income is harder for the IRS to track because they often require taxpayers to self-report, which can be unreliable. In fact, a groundbreaking study by John Guyton and Patrick Langetieg of the IRS, Daniel Reck of the London School of Economics, Max Risch of Carnegie Mellon University, and Gabriel Zucman of the University of California, Berkeley shows that the top 1 percent of tax filers hide their income far more than was previously known. Using evidence from random IRS audits, a voluntary offshore asset disclosure program, and analysis of the structure of passthrough businesses, the co-authors show that the top 1 percent probably hide more than 20 percent, on average, of their income from tax collectors, accounting for 36 percent of the tax gap.
This research shows that in some ways, growing inequality is self-reinforcing. As resources become concentrated, those with these resources increasingly hide their income from scrutiny.
The rich use offshore accounts and business entities to hide taxable income
Tax noncompliance is driven by income that is not subject to third-party reporting. People report wage income, public benefits, and interest earned on savings accounts on their individual tax returns. These income sources are also separately reported to the IRS by their employers, by government agencies, and by financial institutions. This double reporting makes it very difficult for individuals to evade taxation on these sources of income. Consequently, tax compliance in these forms of income is quite high, and evasion is quite low.
In contrast, tax evasion skyrockets when there is no third party reporting a flow of income to the IRS. This is very often the case for personal business income, overseas income, for some capital gains, and for some interest and dividends. (See Figure 2.)
Figure 2
Again, the types of income which are most frequently misreported are also the types of income that are disproportionately common among the top 1 percent. Tax evasion at the top, however, is even more drastic than shown here. The five co-authors show that the very wealthy use two primary methods to avoid taxes—and avoid detection in the random audit data shown above. First, they place their capital gains, interest, and dividend income in offshore accounts to hide it from scrutiny by the IRS; foreign financial institutions have not historically been subject to the same reporting requirements as U.S. institutions. Second, they underreport income in their personal partnership and S-corporation businesses, which are difficult for the IRS to examine.
Partnership and S-corporation businesses differ from more traditional Schedule C businesses in their level of transparency. On tax forms, a Schedule C business can be attributed to a sole proprietor who reports her business’ profits, deductions, and expenses on her personal 1040 tax return. A partnership, however, reports its earnings separately from its owners, who only report their share of the profits or losses on their individual tax returns. This separation between business entity and owner creates technical and data hurdles for IRS auditors seeking to trace tax evasion.
Often, is it not possible to match partnership business income to personal income without great effort. A partnership business can have many owners, and indeed, they can be owned by other partnerships, sometimes creating a complex web of ownership. Research by Michael Cooper of the U.S. Treasury Department and his co-authors shows that 15 percent of partnership income was in circular partnership ownership patterns—partnerships owning other partnerships owning other partnerships—and, distressingly, almost 10 percent was not able to be linked to any individual’s tax return. Of the income that can be traced to individuals, two-thirds accrues to the top 1 percent.
The research on tax evasion firmly establishes that when streams of income are not subject to third-party reporting, the wealthy are able to hide their income from taxation. It also shows that the wealthy are constantly moving their income to escape IRS scrutiny. For instance:
Rich investors will attempt to hide income in tax-haven countries so long as their banks will help them to hide this income. Financial institutions are key intermediaries in hiding money from tax collectors—for example, by concealing income under layers of business entities. Yet when new policies crack down on bank activities, would-be evaders cut down on their evasion, finds Jim Omartian at the University of Michigan.
Around the 2008 financial crisis, many countries started signing data-sharing agreements to combat tax evasion. These one-by-one agreements allowed countries to see their citizens’ assets and income in foreign-based financial institutions for tax purposes. Research by Niels Johannesen of the University of Copenhagen and UC Berkeley’s Zucman found that this caused evaders to move funds to alternate tax-haven countries that did not sign these agreements.
Enforcement initiatives by large countries such as the United States can have large effects on reducing evasion. Even smaller, targeted enforcement policies (as opposed to comprehensive ones) after 2008 increased offshore-income reporting by billions of dollars per year, find Johannesen, Langetieg, Reck, Risch, and Joel Slemrod of the University of Michigan.
A comprehensive attempt to tackle evasion, such as the Foreign Account Tax Compliance Act, could be expected to have larger effects. Indeed, an early look at the program by Lisa De Simone and Rebecca Lester of Stanford University and Kevin Markle of University of Iowa suggests FATCA is having large effects on tax evasion, though much more work needs to be done to counter new evasion opportunities.
Tax evasion is complex and requires both the closing of known loopholes, as well as dedicated resources for enforcers to keep pace with lawbreakers. Unfortunately, the tools to combat these crimes have been lacking in the past decade.
Academic research establishes that Secretary Yellen is right about the size of the tax gap and that given some tools, the IRS can meaningfully close this gap, increase equity, and pay for valuable investments in our society. The Treasury Department’s Sarin and Harvard’s Summers find that by “performing more audits (especially of high-income earners), increasing information reporting requirements, and investing in information technology,” the IRS could generate more than $1 trillion in revenue over a decade—even more than the Biden administration projects it can raise.
These two tools—more audits and more reporting requirements—are necessary and work in tandem: Greater IRS enforcement budgets and greater access to information on income flows will cut evasion.
After a decade of budget cuts, the IRS has lost more than 15,000 enforcement staff since 2010. With more resources, such as the $80 billion that the Biden administration proposes to invest in the agency, the IRS will be able to better litigate tax disputes and conduct more and better audits of the top 1 percent, who now experience audits almost as often as low-income recipients of the Earned Income Tax Credit. The debilitating defunding of the IRS has allowed tax evasion to proliferate, degraded service for regular taxpayers, and made our tax system more regressive.
Congress has stepped up, but it could do more. In addition to Foreign Account Tax Compliance Act, which can help target unreported overseas income, the American Rescue Plan included a provision requiring companies that use independent contractors, such as gig companies, to increase third-party reporting of payments to the IRS. This will increase the double reporting that research shows is necessary to enforce tax laws, cutting down on evasion through business entities, while FATCA makes it harder to hide income overseas. Other recent legislation may make it easier to track who ultimately owns a partnership businesses.
The IRS, however, still needs more tools to combat tax evasion, and Congress can still do more to increase third-party reporting to the IRS. And, of course, any enhanced reporting is of limited use unless the IRS has the staff to process the new data it collects. So, this Tax Day, Congress should make it a priority to increase resources for the IRS and make the tax system more equitable and fair by making tax cheating more difficult.
A view of Goldman Sachs Tower, August 23, 2017, in Jersey City, New Jersey.
Overview
If you are an analyst following Wall Street, things are looking pretty bright these days. The S&P 500—an index of 500 major publicly traded companies in the United States and a benchmark for gauging the health of the U.S. corporate sector—is up more than 80 percent since its low in March 2020 during the onset of the global pandemic.12 Companies in the index have added $50 trillion worth of value during the course of the lockdowns and recovery, a rally not seen since the post-Great Depression period 90 years ago.13
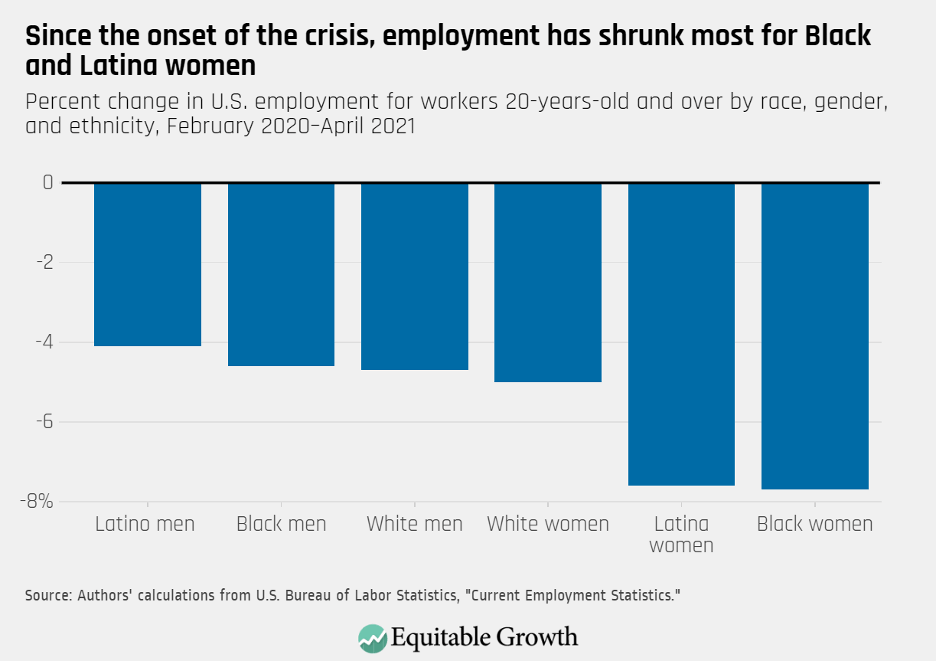
Meanwhile, how Main Street is faring is a bit more complicated. While the U.S. economy added a healthy 916,000 jobs in March 2021 and the unemployment rate fell to 6 percent, there are still 8.4 million fewer jobs than before the pandemic.14 And job gains during the incipient recovery are driven predominately by the strength of employment for White workers. Black men are still experiencing an unemployment rate of 9.6 percent—almost double that of White men—and Black women actually saw their unemployment rate slightly increase to 8.7 percent in March.15
What’s more, this disparity comes at a time when Black women have already dropped out of the workforce at staggering rates. Their employment-to-population ratio dropped 6 percentage points since just before the pandemic, double the rate of White women’s withdrawal from the workforce.16 Latina women face a similar set of challenges as Black women, with the unemployment rate for Latina women at 7.3 percent and the employment-to-population ratio also still far below pre-pandemic levels.17
By now, many policymakers have heard the story of the so-called K-shaped recovery.18 This describes how the fortunes of those at the top of the U.S. wealth and income ladders can be so disconnected from the experiences of U.S. workers and their families, especially those struggling the most in our economy. Even as U.S. policymakers’ economic response to the coronavirus pandemic was relatively robust, compared to other countries,19 the gap between the rich and nonrich in the United States is still among the largest in the world.20
In short, even a strong rescue response can’t make up for decades of disinvestment. So, what policy choices led to the growing divide between the wealthy and the rest of us? How did U.S. policymakers enable these inequitable economic outcomes?
On April 29, a hearing of the U.S. Senate Committee on Banking, Housing and Urban Affairs explored that question, within their remit of banking and financial services: What are the mechanisms by which finance, enabled by public policy, made this the case?21 The hearing delved into the channels through which our financial markets have put the squeeze on U.S. workers, drawing on testimony from Trevon Logan, an Equitable Growth grantee and the Hazel C. Youngberg Trustees distinguished professor of economics at The Ohio State University; Heather McGhee, board chair of the advocacy group Color of Change and author of the new book The Sum of Us: How Racism Costs Everyone and How We Can Prosper Together; and Lisa Donner, executive director of Americans for Financial Reform, an organization focused on strengthening our financial system.22
This issue brief explores their testimony, alongside other evidence-based research and analysis. The brief details how the financialization of the U.S. economy over the past five decades contributed to income and wealth inequality, stifled economic growth, and exacerbated economic disparities by race and ethnicity. It then presents some policy ideas put forth by the witnesses at the hearing, including solutions to short-circuit financialization by investing in physical and care infrastructure, building worker power, ensuring strong regulation of our financial system, and improving fairness in our tax system.
How Wall Street harms U.S. workers and their families
Witnesses at the hearing on April 29 explored how Wall Street harms U.S. workers and their families through the phenomenon known as “financialization.” Financialization refers to the process by which the financial sector—banks, private equity firms, hedge funds, stocks and derivatives exchanges, and other conduits through which money flows between those who have it and those who need it—takes up a larger and larger share of the U.S. economy, fails to allocate capital to its most productive uses, and increasingly results in the hoarding of economic, and thus political, power at the top of the income and wealth ladders.
Financialization also can refer to the increasing participation of nonfinancial businesses in financial activities. General Electric Company, for example, a company most people associate with manufacturing and innovation, earned 43 percent of its profits from financial activities as recently as 2014.23
As explored in the hearing, financialization can create downstream harm for U.S. workers and their families by undermining what Sen. Sherrod Brown (D-OH), chairman of the Senate Banking Committee, calls “the dignity of work.” Sen. Brown borrowed the phrase invoked by Martin Luther King Jr. in defense of striking workers in Memphis, Tennessee, in 1968. The phrase means that all people’s labor is compensated fairly, that employment is free from exploitation and coercion, and that work—whether inside or outside the home—is respected and met with dignity.
How financialization took hold over the past 50 years
Witnesses at the hearing identified the shift to “shareholder capitalism” over the past five decades as a key framework for understanding how financialization has been operationalized. Over the past half-century, corporate leaders, influenced by the free-market economists of the Chicago School, shifted the views of the majority of financiers from the need to support jobs and the communities in which they operate to a focus on the maximization of short-term shareholder value.24 In the words of Milton Friedman in 1970, the goal of corporate managers is to “conduct business in accordance with (shareholders’) desires, which generally will be to make as much money as possible while conforming to the basic rules of the society, both those embodied in law and those embodied in ethical custom.”25
The import of Friedman’s statement is that considerations such as worker welfare, the economic health of communities, the environment, and U.S. competitiveness on the world stage were best left to policymakers and civil society leaders, with business leaders’ only obligation being the maximization of profits. This philosophy formed the underpinnings of not just a change in managerial practices but also in business education.26
The problem with this narrowing of focus on the part of corporate leaders is that policymakers—the stewards of public welfare in this ecosystem—failed to keep up, as large businesses and finance entrenched the excesses of shareholder value to harm workers. In fact, as witnesses at the hearing documented, corporate leaders themselves use their outsized economic power to influence the policymaking process in their favor, for example, by eroding the worker protections and financial system regulations established after the Great Depression. This has created feedback loops where enhanced economic power begets more political power, with workers increasingly short-changed.
How financialization shapes the U.S. economy today
How does financialization manifest itself throughout the U.S. economy today and, especially, in how policymakers measure the success of the economy?
For one, the share of income accruing to workers continues to decline. The so-called labor share of income represents the percentage of U.S. Gross Domestic Product paid out in the form of wages, salaries, and benefits and can be contrasted with capital’s share of income, which is the money made off of investments or the ownership of things. As economist Dean Baker at the Center for Economic and Policy Research points out, if the labor share of income were the same just before the pandemic as it was in 1979, the median worker’s pay would be about 4.2 percent higher than it is now.27
Financialization can decrease the labor share of income in two ways: by increasing the amount of income derived from capital and then by decreasing the amount of income derived from labor. On the first point, while factors such as technological innovation and globalization can drive up the capital share of income, financialization also plays a role, as companies increasingly earn money through financial engineering rather than investment in people. According to one estimate, financialization may have contributed to more than half of the fall in the labor share of income.28
Moreover, financialization, enabled by the gutting of worker power discussed more below, can also decrease the labor share of income by increasing the pressure on short-term profit maximization, driven, in part, by decreasing labor costs. This phenomenon is exemplified by Wall Street analysts downgrading the stock of the restaurant chain Chipotle Mexican Grill Inc. because they concluded that management had exhausted their ability to reduce hours or cut wages of front-line workers.29
Financialization also widens the disparities between people who earn their money in the financial-services industry versus workers who earn it elsewhere. Economists Josh Bivens and Lawrence Mishel at the Economic Policy Institute documented how the overall pay of financial-sector workers relative to others in the economy has risen substantially over the past decade.30 While the ratio never exceeded 1.1 percent from 1952 to 1982, it began rising and reached 1.83 percent by the onset of the Great Recession of 2007–2009.31
Likewise, research by Thomas Philippon at New York University’s Stern School of Business and Ariell Reshef at the Paris School of Economics shows a pay premium for finance workers even when multiple controls, such as education and employment risk, are used. The authors conclude that roughly 30 percent to 50 percent of the pay premium in finance is due to economic “rents,” or policy failures that allow a market to exist out of equilibrium.32
Further, the profits of financial firms comprise a greater share of all corporate profits and of total U.S. GDP. In her April 29 testimony before the Senate Banking Committee, Donner of Americans for Tax Reform presented U.S. Bureau of Economic Analysis data to show that financial-sector profits and their share of GDP have skyrocketed since the 1970s.33 (See Figure 1.)
Figure 1
And despite the growth of the finance industry, the costs of intermediation—the toll taken by financial-services firms to funnel money between savers and spenders—are about the same as they were a century ago.34
Finally, financialization can impede overall economic growth, dragging the entire global economy down. Researchers from the Bank for International Settlements surveyed international economies and found that financial booms can create “bloat” in the global economy that drags resources away from productive activities and into nonproductive trading and speculation.35 Further, according to Adair Turner, a former British banking regulator, only 15 percent of financial flows actually fund new projects and jobs in the global economy, with the rest going toward securitizing and speculating on existing assets.36
As pointed out by Color of Change’s McGhee in her testimony, the subprime mortgage crisis of 2008 is the paradigmatic example of this phenomenon, with a relatively small number of toxic mortgage loans, sold disproportionately to Black and Latinx individuals and families, able to cause a global financial crisis due to the magnifying effect of financial derivatives.37
Financialization is supercharged by policy choices
Financialization isn’t natural law or the logical outgrowth of improving technology or a changing economy. Instead, it is driven by policy choices motivated by Friedman’s ethos taking hold among economists and policymakers alike. Tax policy, for example, encourages executive compensation structures that focus on short-term gains over long-term value creation by making performance-based equity awards tax-deductible for corporations.38 Compensation in the form of unrestricted stock can encourage CEOs to pursue juicing share prices over long-term value creation, particularly as 43 percent of CEOs admit to having a planning horizon of 3 years or less.39
The swirl of tax policy and shareholder supremacy also leads to an increasing number of firms using profits to enable capital distributions to stockholders in the form of dividends and share repurchases, rather than investment in longer-term growth. Research suggests that this short-term focus encourages companies to increasingly focus on financial engineering rather than slow and steady value creation. In fact, some research suggests that capital markets actually reward companies with the highest levels of share repurchases rather than the firms with the highest growth potential.40
These phenomena are further exacerbated by the tax deductibility of interest payments on debt. This leads to firms not only privileging capital distributions over investments in their own operations and future growth, but also to relying on debt to do so. Recent data suggest that about half of share buybacks are financed by debt.41 While the Tax Cut and Jobs Act of 2017 did limit some of the deductibility of interest on corporate debt payments, the windfall to firms from reduced tax bills was met with declining business investment and tepid wage growth, even before the onset of the pandemic and recession.42
Laggard antitrust enforcement is another reason why firms are able to exercise outsized control in their markets, harming workers and their families and decreasing innovation in the broader economy. Researchers hypothesize that lax antitrust enforcement allows firms to sidestep competitive market forces as firms no longer have to invent new technologies or improve services when their market position allows them to extract monopoly profits. Common ownership by institutional investors also can lead to businesses competing less vigorously against one another.43
When combined with the legislative and judicial erosion of worker power over recent decades, these firms can easily exercise outsized control over their workers. Ohio State economist Logan in his testimony points to the coercive control exercised by firms not only via low wages but by policies such as limiting bathroom breaks or social interaction with colleagues, requiring entry-level employees to sign nondisclosure agreements that foreclose on their ability to switch jobs, and using aggressive tactics to prevent collective bargaining.44 Workers of color are disproportionately represented in jobs governed by what Logan, in his testimony, calls “factory discipline,” or the ability of managers to exercise de facto authoritarian control, underscoring the racialized harm caused by monopsonistic behavior.45
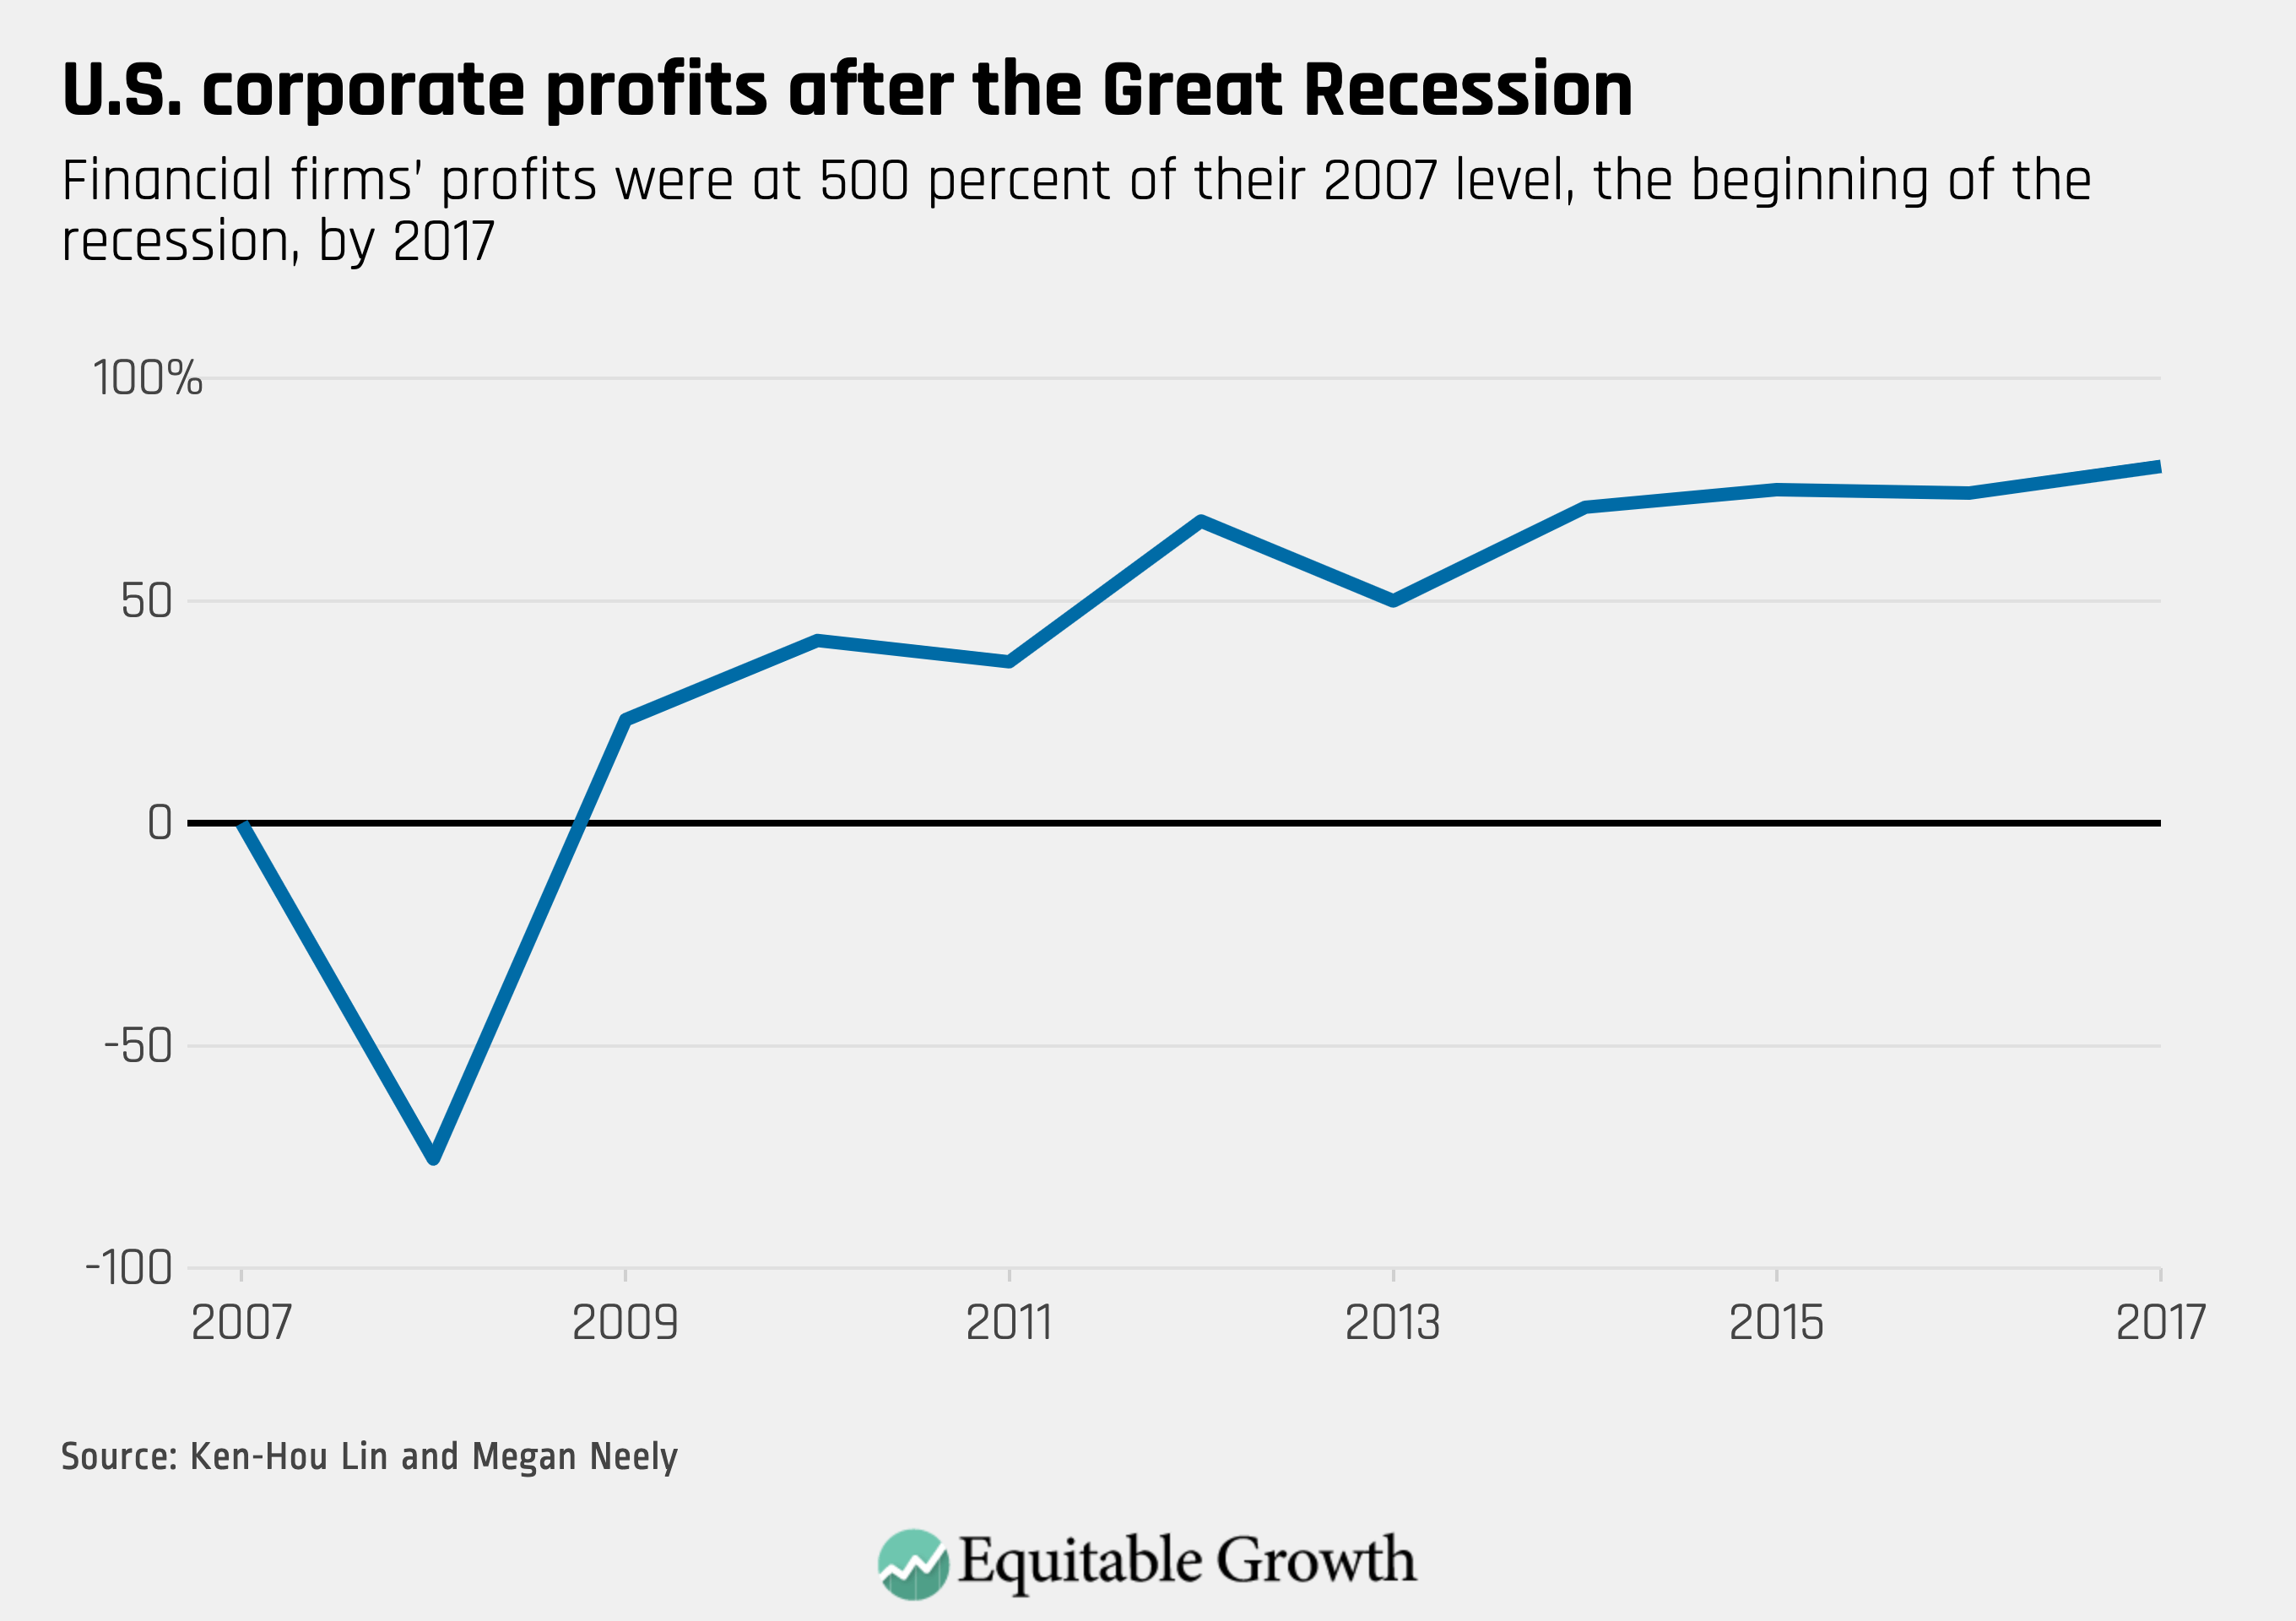
Financial deregulation also plays a role. Donner’s testimony describes the process by which Wall Street eroded bank safety and soundness protections, defeated laws governing predatory mortgages, prevented measures to bring transparency to financial derivatives markets and weakened corporate accounting and governance rules in the lead-up to the Great Recession.46 In turn, financial crises inevitably harm vulnerable communities much more than they hurt the financial sector itself. While the Great Recession wiped out almost three-quarters of financial-sector profits, the sector had fully recovered by midway through 2009.47 (See Figure 2.)
Figure 2
Meanwhile, it took a decade for wages to recover to pre-Great Recession levels.48 As Heather McGhee points out in her testimony, communities of color are most likely to suffer earliest and harshest during financial bust periods—and in the 2008 crisis, were both the targets of predatory financial behavior and the last to recover from its effects.49
Finance itself is financialized
The banking sector itself perhaps provides the best case by which to illustrate the feedback loops caused by financialization. The largest U.S. banks benefitted from record revenue in trading in 2020 and early 2021, profiting from volatility across equities, fixed income, currencies, and commodities during the pandemic and the Fed’s intervention in the markets.50 Meanwhile, loans to consumers and small businesses remained flat. Bank executives contend that weak loan demand is driving the lackluster lending volumes.51 Yet community banks have continued lending at nearly 2.5 times the rate of noncommunity banks.52
Other research evidence suggests that large bank concentration in a community can impede lending to the real economy. One study conducted during the policy response to the coronavirus pandemic finds that a small business merely being located in an area predominately served by megabanks lowered the chances of an eligible small business receiving a Paycheck Protection Program loan.53 The lack of connection between Wall Street profits and provision of credit in the real economy is particularly troubling, given the regulatory forbearance afforded to big banks by U.S. financial agencies during the pandemic recovery in the name of jumpstarting lending.54
Meanwhile, front-line bank workers themselves have been exposed to significant risk during the pandemic, protesting a lack of personal protective equipment and intense stress from having to coach customers in navigating an economic crisis.55 At the same time, bank workers’ pay remains modest, with 75 percent of bank workers earning less than $15 an hour and about a third of bank workers relying on some form of public assistance to make ends meet.56 People of color are overrepresented in front-line bank positions such as tellers and underrepresented in senior management roles.57
Lisa Donner in her testimony also pointed to the private equity industry as being at the nexus of many of these phenomena.58 Emboldened by favorable tax treatment of their debt-driven business operations and a focus on short- to medium-term value creation, private equity funds buy up floundering companies, typically increase those companies’ debt levels, and seek to minimize business costs—most notably, labor costs. Some private equity funds may bring management expertise or process improvements to the businesses they own, but some research also shows that private-equity-owned firms are more likely to default on loans related to large buyouts.59 They also are more likely to go bankrupt.60 And they are more likely to cut jobs and reduce wages than similarly situated firms with other ownership models.61
Over the past year, research also suggests that private-equity-owned businesses such as nursing homes have a higher incidence of death among residents.62 And private-equity-owned hospitals were quicker to cut practitioners’ pay and benefits at the onset of the pandemic.63
Solutions to rising financialization
Witnesses at the April 29 hearing pointed to a number of policy solutions to these challenges. The $1.9 trillion American Rescue Plan, enacted in March 2021, directed substantial aid to those suffering the most from the pandemic and the recession it created, with $1,400 direct payments, an expanded refundable Child Tax Credit, and strengthened Unemployment Insurance compensation and child care investments. All are likely to improve the lives of those affected and help grow the U.S. economy.
Further efforts proposed in the $2.3 trillion American Jobs Plan and $1.8 trillion American Families Plan can help entrench those investments so that structural changes in the economy will help workers and their families more sustainably as the economy recovers.64 These policy actions and proposals, if fully implemented, would help correct the disinvestment in public institutions that began in the 1970s—timed just as our legislative and judicial systems removed formal barriers to access for people of color and thus removed an important counterweight to the forces of financialization.
The Senate Banking Committee also heard testimony on April 29 about other policy changes that could combat the deleterious effects of financialization. Ohio State’s Logan emphasized ways to empower workers by using antitrust enforcement to break up monopsonistic power and break the feedback loops created by financialization.65 Donner discussed how to rein in the outsized power at the very top of the U.S. wealth and income ladders by strengthening the rules and regulations governing Wall Street’s rising control of the U.S. economy. Specifically, she wants policymakers to address concentration among banks, strengthen protections against predatory lending, and reform the tax code to end the favorable treatment afforded to income gained via investments rather than labor.66
All of the witnesses also discussed the need to enact policy that addresses the roots of systemic racism, which is deeply interlinked with the causes and consequences of financialization. As McGhee pointed out, the legacy of the racial wealth divide is maintained and exacerbated by financialization, which pulls income away from workers and their families and directs it to those already exceedingly wealthy. Those with the least savings—mostly families of color historically cut off from wealth-building opportunities—are left the furthest behind, with fewer and fewer opportunities to catch up.67
On this point, witnesses also provided a host of policy recommendations to address economic disparities by race and ethnicity. They recommended that policymakers should collect more and better data, disaggregated by race and ethnicity,68 to provide better measures of the U.S. economy. Another suggestion was to enact policies such as baby bonds so that children have assets to help enable wealth-building activities as they head into adulthood.69 A third proposal would be to support worker power to help level the playing field between wage-earners and increasingly powerful corporations.70 Another recommendation was to examine how minority-owned small businesses were left behind in previous rescue efforts, including in response to the coronavirus recession.71 And more broadly, they recommended protecting against financial deregulation, which increases the risk of predation and its economic fallout for Black and Latinx individuals and families.72
The roots of financialization run deep, and its causes stretch far beyond the U.S. banking and financial-services sector. But with a broad set of investments in workers and families, policymakers can reverse these harmful decades-long trends and build a framework for sustained and broadly shared prosperity.
Every month the U.S. Bureau of Labor Statistics releases data on hiring, firing, and other labor market flows from the Job Openings and Labor Turnover Survey, better known as JOLTS. Today, the BLS released the latest data for March 2021. This report doesn’t get as much attention as the monthly Employment Situation Report, but it contains useful information about the state of the U.S. labor market. Below are a few key graphs using data from the report.
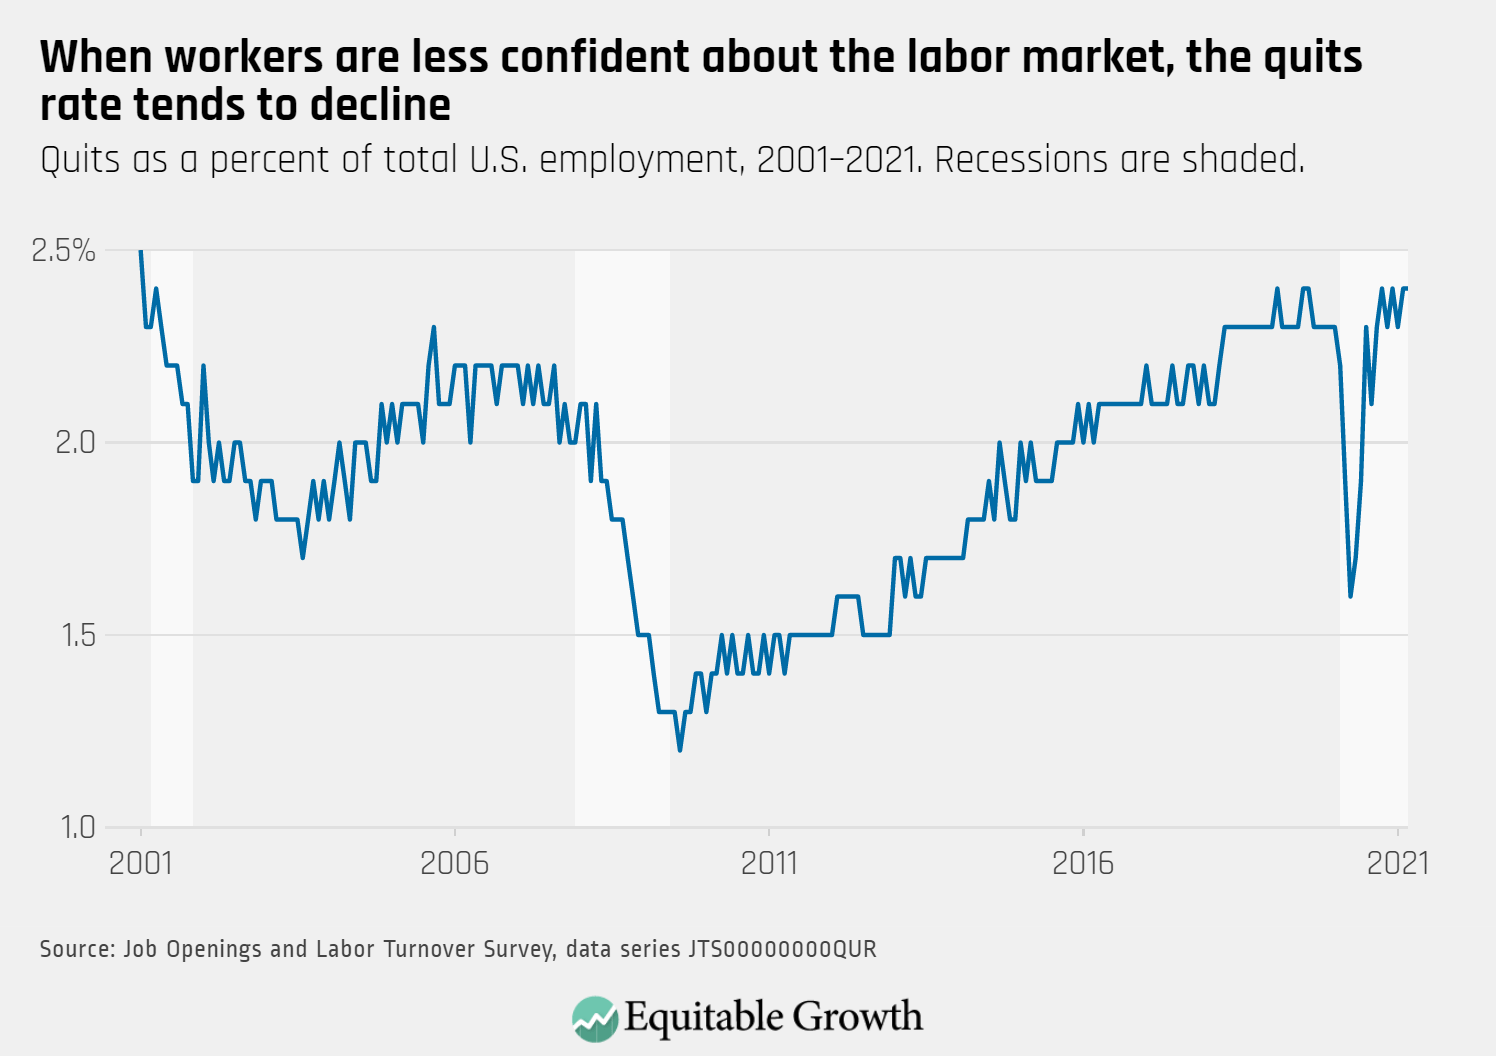
The quits rate remained unchanged at 2.4 percent in March, even as the job openings rate increased to 5.3 percent.
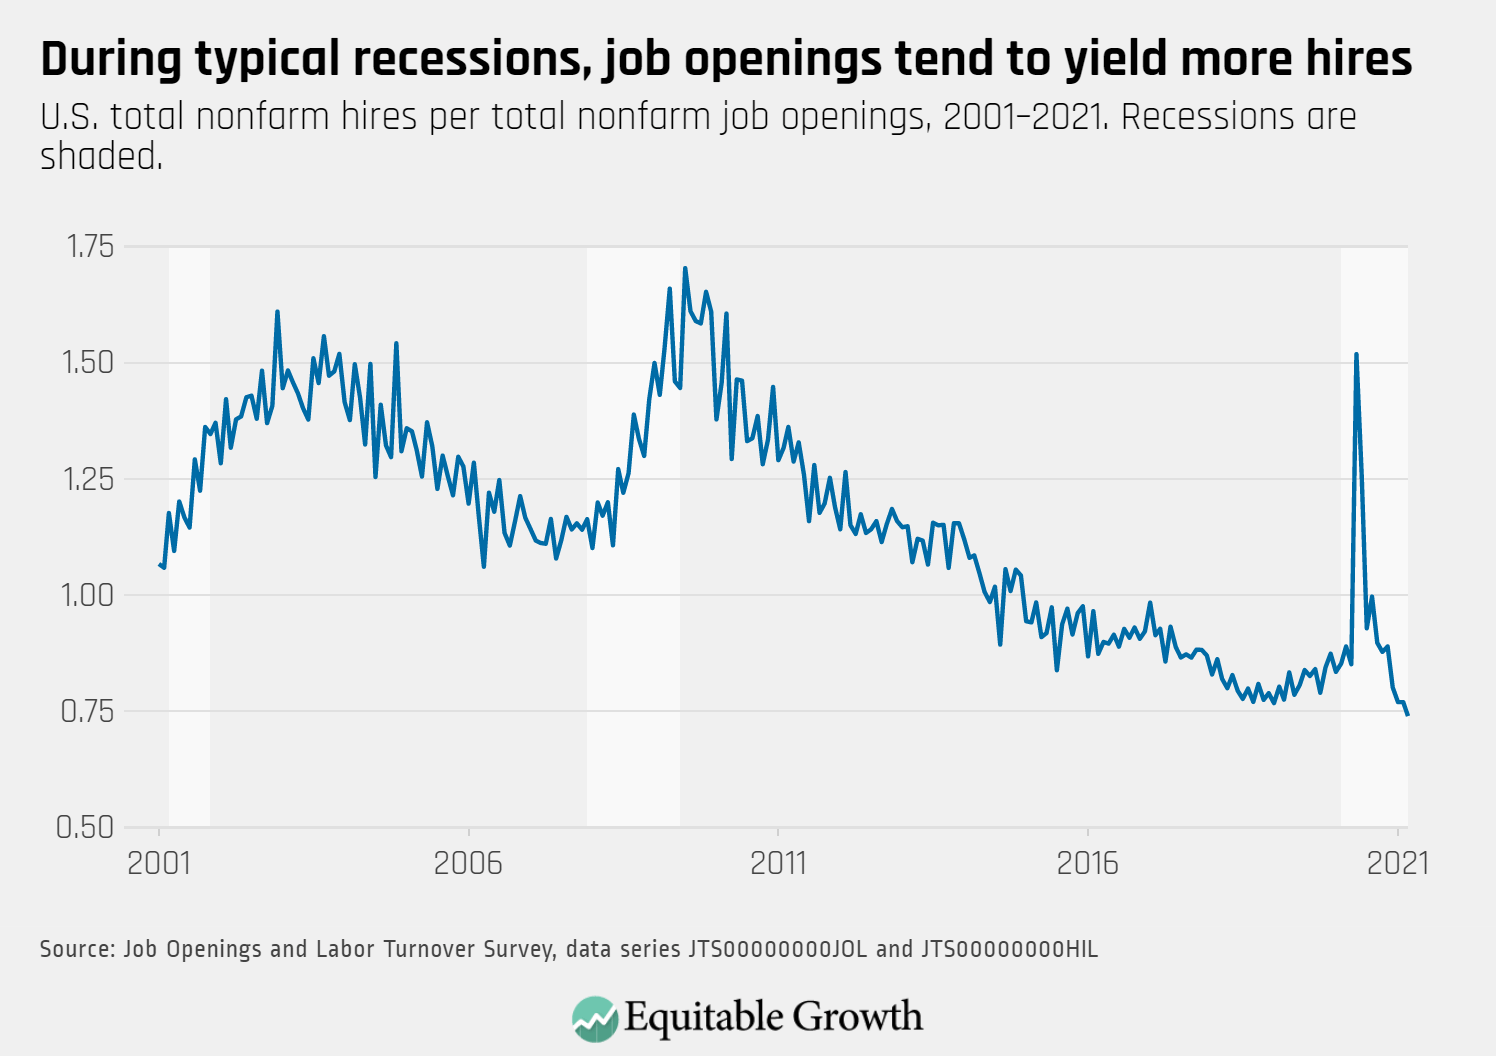
Job openings reached a series high, yet hires were little changed as the vacancy yield declined in March.
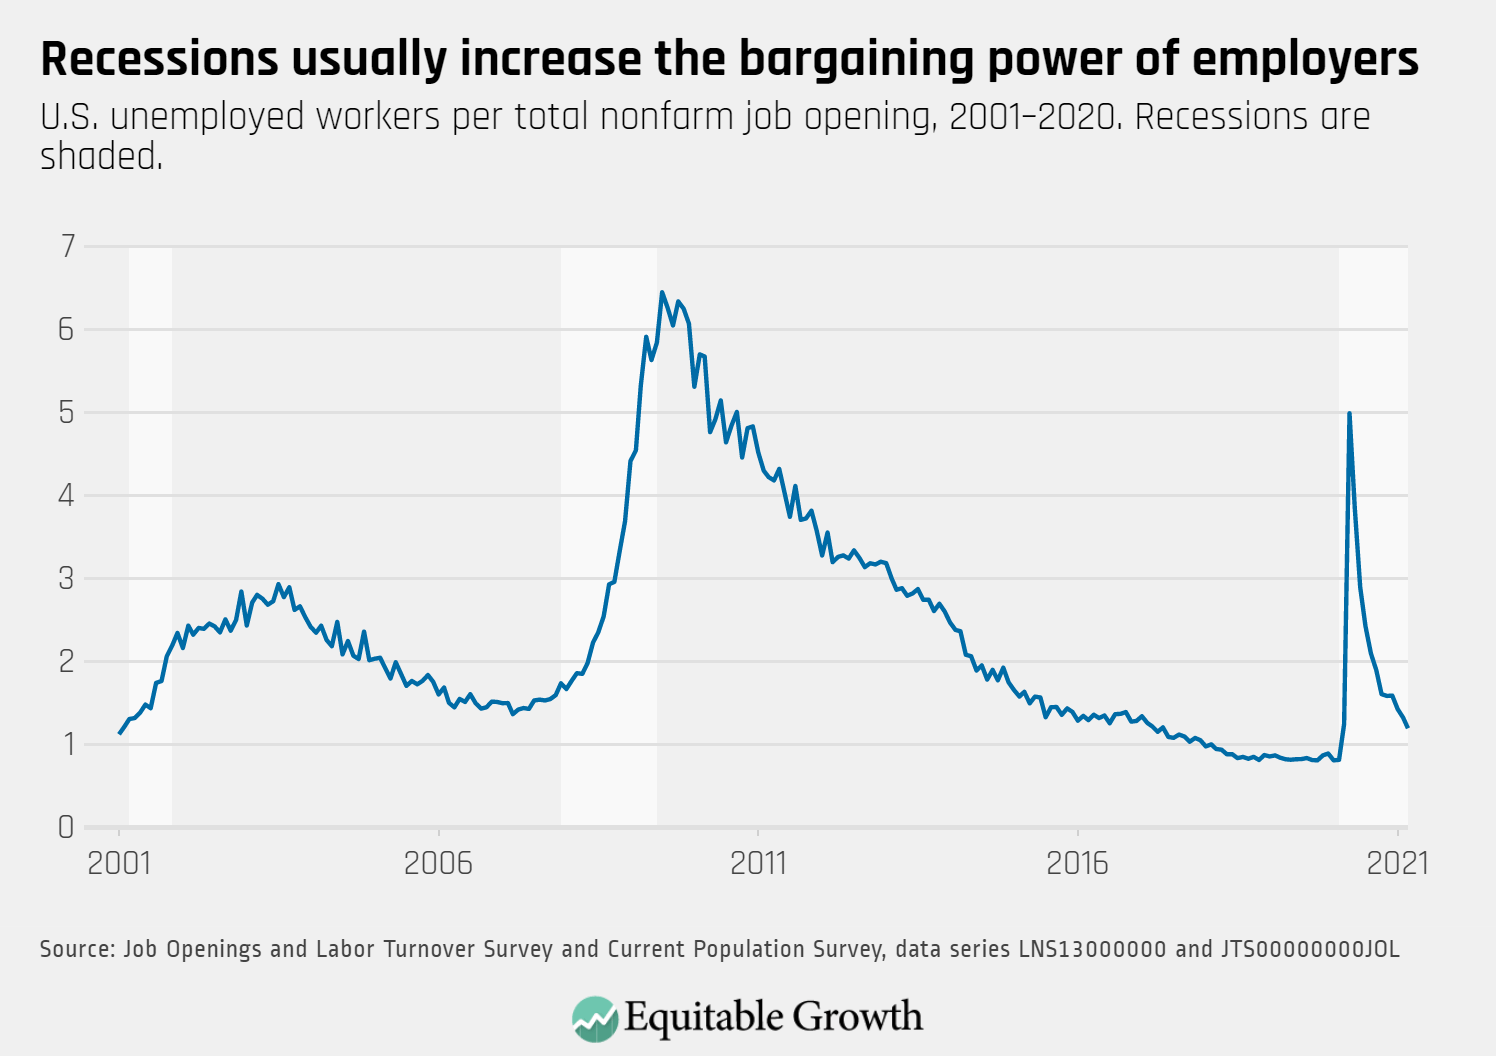
There were 1.2 unemployed workers for every job opening in March as unemployment decreased.
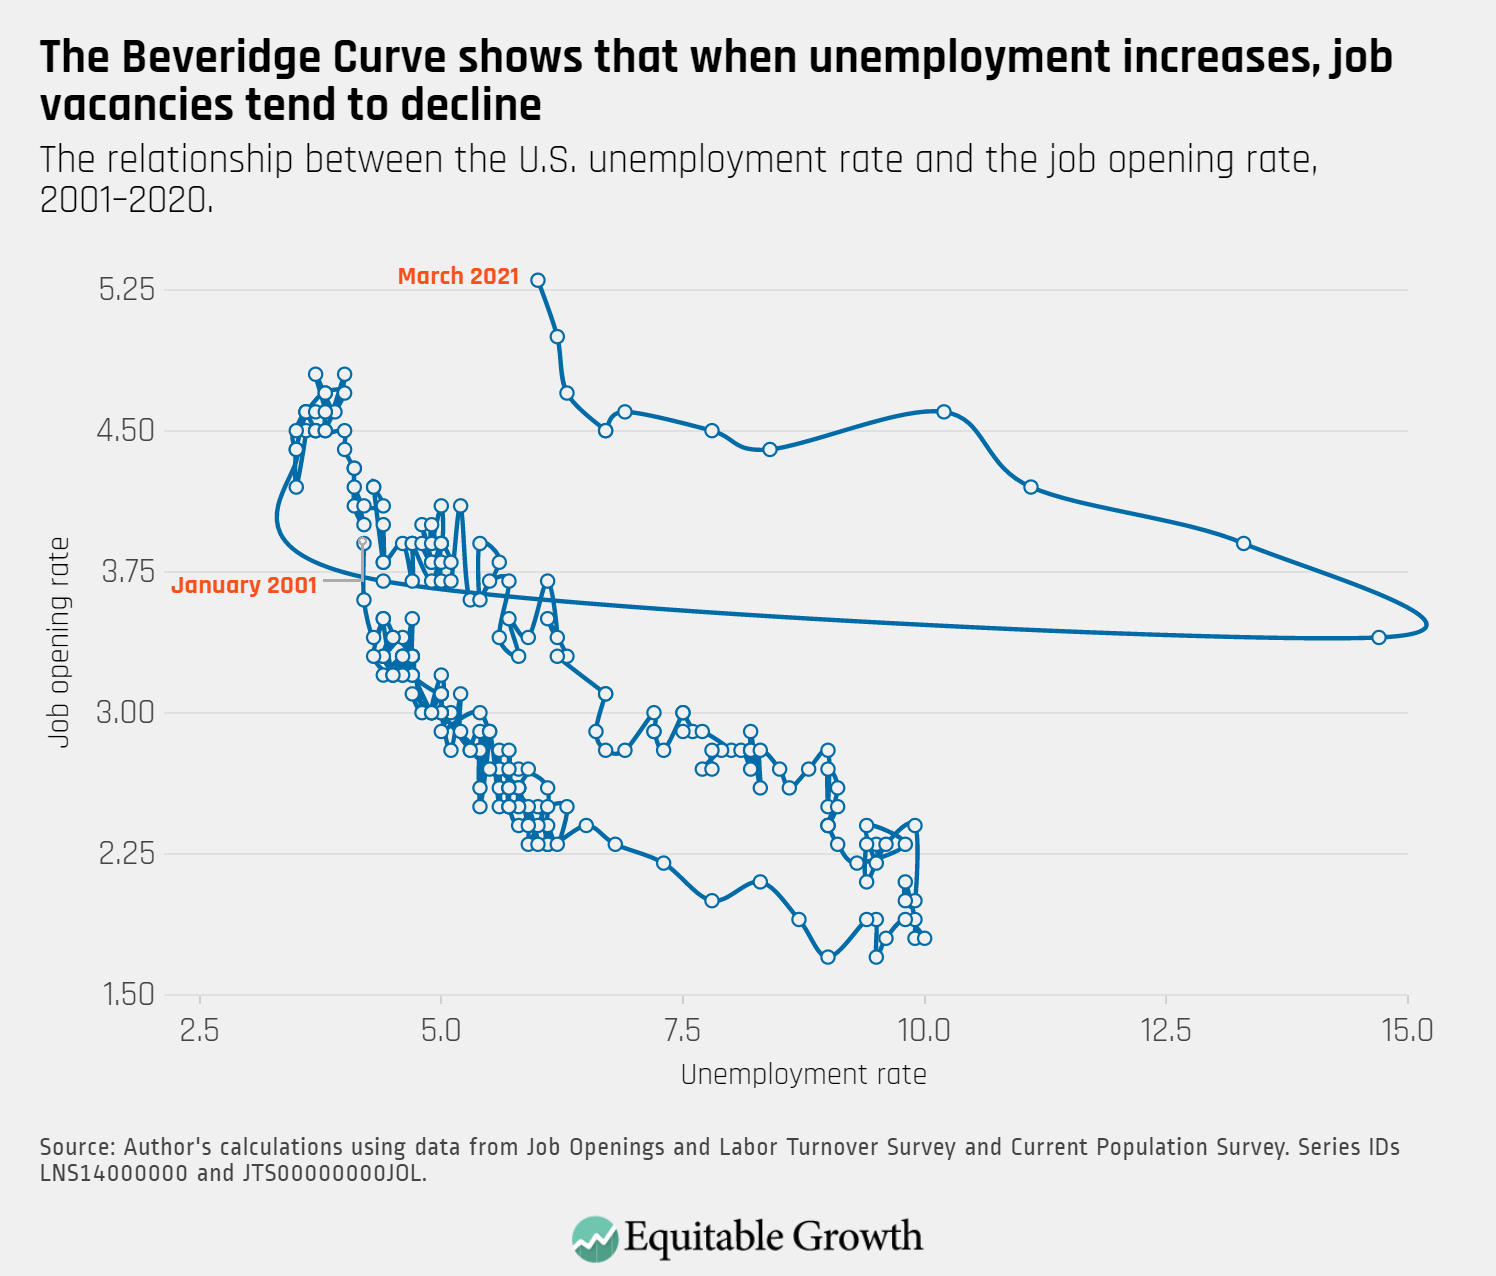
With a slight decrease in the unemployment rate and the job openings rate reaching a series high, the Beveridge Curve continues to move in atypical territory, reflecting the unique nature of this downturn.
1. The surprising and disappointing slow growth of U.S. employment between March and April underscores how sick the U.S. labor market still is. We need both better social support networks for those who want to return to work and higher wages in the jobs that people are going to be moving to in order to restore the health of the labor market. And, meanwhile, job displacement will not be without its substantial costs. We are still far from being out of the woods. Read Kate Bahn and Carmen Sanchez Cumming,” The consequences of job displacement for U.S. workers,” in which they write: “Unemployment in the United States remains high, and there are 8.4 million fewer jobs than prior to the pandemic … Some of those who lost their jobs are experiencing … job displacement … [and] their prior positions [will] no longer exist even as the economy recovers … Job displacement is generally outside of the control of individual workers, but it nonetheless can break down career ladders, dissolve valuable worker-employer relationships, and widen existing racial disparities in labor market outcomes.”
2. Equitable Growth has, after its ramp-up period, gotten in the groove with respect to funding substantial amounts of truly excellent economic research. If you do not read this, you almost surely have only a partial view of what we are doing and what we have learned from it. Read our “Second Annual Academic Research Report,” in which we explain: “We place a priority on research that is relevant to policy debates, abetting the development of evidence-based policies. Equitable Growth’s in-house team of more than 40 staff helps bridge the gap between researchers and the policy process … And we are committed to increasing diversity … to support more Black scholars and to fund more research based on the lived experience and legacy of structural racism … Since 2013, Equitable Growth has provided more than $6 million in grants to more than 200 researchers. In 2020, we announced a record $1.07 million in grant funding. The funds went to 19 faculty grants and 12 doctoral grants supporting Ph.D. student researchers. Separately, we awarded more than $250,000 in grants for new research on paid leave, with a focus on medical and caregiving leave and on employer responses to paid leave.”
2. We are now in the middle of an enormous transformation in the nature of work. I am very positive about its long-run impacts. And I think Adam Ozimek is correct here in focusing on the reduced deadweight loss of commuting. Read his “Economist Report: Future Workforce,” in which he writes: “Companies continue to be remote: Nine months into the pandemic, 41.8 percent of the American workforce remains fully remote. Companies say remote work is getting easier, not harder, as time goes on: 68 percent of hiring managers say remote work is going more smoothly now than when their company first made the shift to at the start of the pandemic. Remote work will continue through 2021: Managers believe that 26.7 percent of the workforce will be fully remote in one year suggesting that individuals will gradually continue to return to the office, but a significant share will remain remote in the near future. The number of remote workers in the next five years is expected to be nearly double what it was before COVID–19: By 2025, 36.2 million Americans will be remote, an increase of 16.8 million people from pre-pandemic rates. Increased productivity and flexibility continue to be key benefits of remote work: Hiring managers cite reduction of non-essential meetings, increased schedule flexibility, and no commute as aspects of remote work that have worked better than expected.”
This is a post we publish each Friday with links to articles that touch on economic inequality and growth. The first section is a round-up of what Equitable Growth published this week and the second is relevant and interesting articles we’re highlighting from elsewhere. We won’t be the first to share these articles, but we hope by taking a look back at the whole week, we can put them in context.
Equitable Growth round-up
As the U.S. economy begins to show signs of recovery from the coronavirus recession, it’s important to remember that many Americans are experiencing job displacement, where their prior positions no longer exist. This type of job loss occurs amid shifting economic and business conditions, such as business closures, corporate downsizing, or outsourcing, and is generally out of the control of individual workers. Kate Bahn and Carmen Sanchez Cumming look at the long-lasting and rippling effects of job displacement on workers and the broader economy, the especially severe labor market outcomes for those who are displaced during recessions, and the higher likelihood of being displaced for workers of color, especially Black workers. Bahn and Sanchez Cumming then present several policy ideas that would address these negative consequences for U.S. workers and job displacement, including ramping up the Short-Time Compensation and Unemployment Insurance programs, and bolstering unions and unionization efforts. Overall, they write, the critical element of these proposals is to maintain employee attachment to their jobs when possible and supplement their incomes when job loss can’t be avoided.
The economy continued to add new jobs in April, but much fewer than were expected. The latest Employment Situation Report from the Bureau of Labor Statistics indicates that many younger workers could face long-term harmful effects on future economic outcomes. Young workers tend to be among the most affected populations during and after recessions because early-career periods are typically characterized by strong earnings growth, which can be disrupted by slack business conditions. Bahn and Sanchez Cumming explain that the coronavirus recession has been no exception: At the height of the downturn last spring, young workers faced exceptionally high rates of joblessness. The co-authors pull together several graphics to highlight the trends in the BLS data, and also provide a more in-depth analysis of the data and its implications for the broader economy. They urge policymakers to make long-term investments in supports for workers and their families, particularly those programs that help those who are most vulnerable to economic shocks and those hardest hit by the current recession.
The Senate Judiciary Committee will soon consider a new bipartisan bill that modernizes and increases funding for antitrust enforcement. The Merger Filing Fee Modernization Act of 2021, introduced by Sens. Amy Klobuchar (D-MN) and Charles Grassley (R-IA), would boost enforcement funding and revamp the merger filing fee structure so that firms engaged in larger deals, which generally require more resources, have to pay their fair share of fees. Michael Kadesexamines the current funding streams and merger filing fee structures, why additional resources are needed, and how the new bill would impact antitrust enforcement. As Kades explains, the filing fee structure currently treats very differently sized mergers the same: A $1 billion deal pays the same filing fee as a $100 billion merger. Additionally, Congress has, for more than a decade, underfunded the antitrust enforcement agencies—the Federal Trade Commission and the U.S. Department of Justice’s Antitrust Division—even as their workloads have grown. Kades acknowledges that this bill will not address the serious market power problem in the U.S. economy, but he argues that it makes an important down payment on antitrust enforcement—and its bipartisan nature suggests that more comprehensive reforms may be possible.
Head over to Brad DeLong’s latest Worthy Reads column, where he provides his takes on recent must-read content from Equitable Growth and around the web.
Links from around the web
A recent report by the Federal Reserve Bank of New York finds that many small businesses that closed at the beginning of the coronavirus pandemic in 2020 may never reopen. The report finds that the restaurants, shops, and concert venues that shut their doors right when the public health crisis began are less likely to reopen than those that stayed open until July 2020. Marketplace’s Nancy Marshall-Genzer reports on the study’s findings, which argues that the longer a place remains closed, the more likely it is that customers forget they exist or move on to other businesses. These businesses also may have been ineligible for Paycheck Protection Program support—and often were owned by people of color, who not only had more difficulty accessing PPP loans but also less frequently have financial cushions to weather the recession due to longstanding systemic discrimination.
Systemic racism has entrenched a racial wealth divide in the United States so vast that even policies such as forgiving student debt and implementing baby bonds aren’t enough to close it. In a guest contribution for The New York Times, Duke University public policy professor William Darity Jr. looks at the realities of the disparities in wealth accumulation between Black and White Americans, including that the average wealth gap between Black and White households was $840,000 in 2019. Darity Jr., a member of Equitable Growth’s Research Advisory Board, urges, policymakers to consider instituting a reparations program for Black Americans whose ancestors were enslaved in the United States. This group makes up about 12 percent of the total U.S. population but own less than 2 percent of wealth in the United States, Darity Jr. continues, indicating that policies such as student loan forgiveness that have previously been proposed to close the wealth divide would help but won’t be sufficient.
It’s time to value care, writes Kristin Smith in an op-ed for the New Hampshire Union Leader. The coronavirus pandemic has laid bare the impossible choices many families face between providing care to their loved ones or earning a paycheck. Policymakers must invest in care infrastructure and family supports, argues the Dartmouth University professor, such as those proposals President Joe Biden put forth recently. These important investments would help workers who are crushed by competing demands on their time and lack of caregiving support. They also would bolster the care economy, which is the invisible engine that powers the overall U.S. economy by enabling workers to be productive, by properly paying and valuing those who perform care work. Considering the number of workers who have left the workforce due to caregiving responsibilities over the past year, Smith concludes, it is long past time to make these investments.
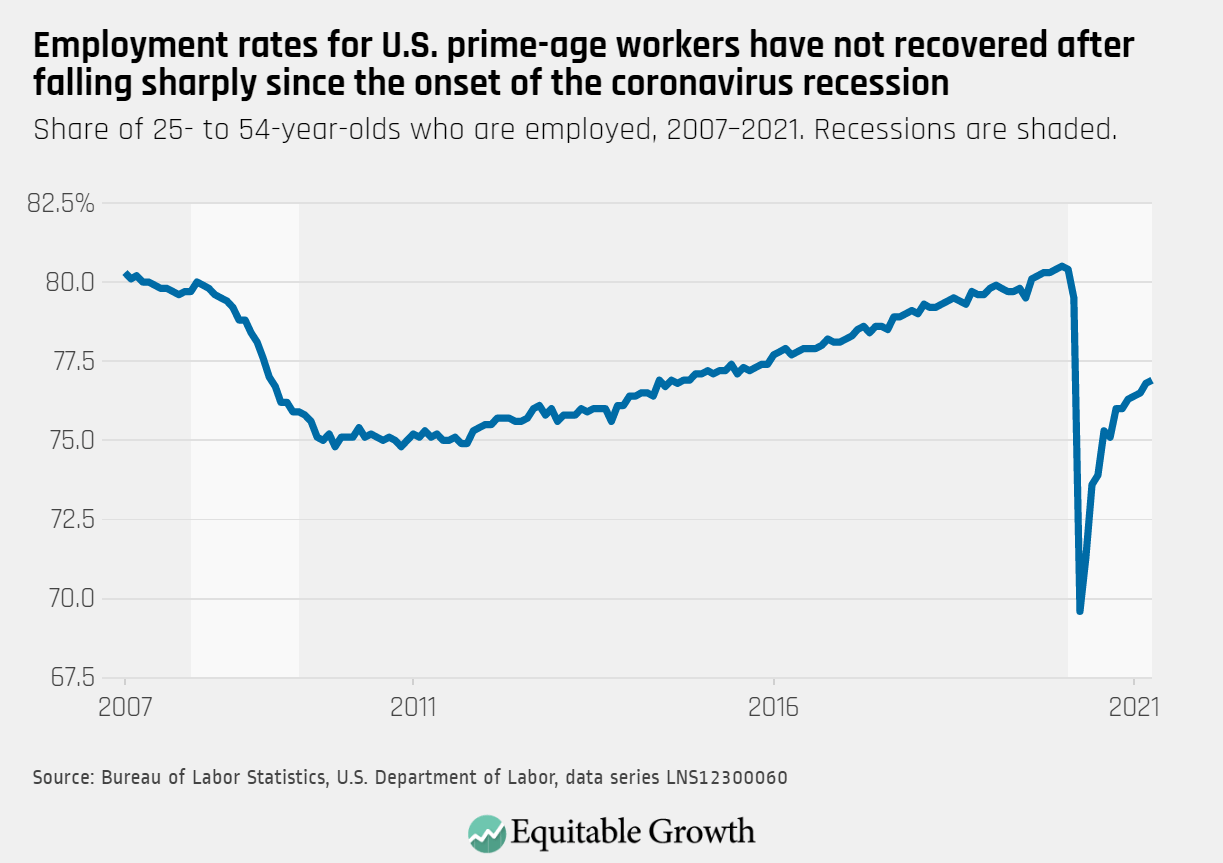
The U.S. labor market delivered employment gains that were far below expectations last month. According to the Employment Situation Summary released this morning by the Bureau of Labor Statistics, between mid-March and mid-April the U.S. economy added only 266,000 non-farm payroll jobs, and the share of the population between the ages of 25 and 54 that is employed—a measure economists call the prime-age employment to population ratio—increased only slightly, from 76.8 percent in March to 76.9 percent in April.
April’s Jobs report is a stark reminder that the U.S. labor market continues to be a long way from its pre-pandemic employment levels. The U.S. economy now has a jobs deficit of 8.2 million compared to February, 2020, before the coronavirus pandemic and resulting recession hit. For the millions of workers who have lost their jobs, including many young workers and those who experienced structural disadvantages in the labor market well before the coronavirus recession, this crisis may lead to long-term damage to their economic outcomes.
The modest net increase in employment was not spread evenly across the workforce. At 9.7 percent, the unemployment rate for Black workers is higher than for any of the other major racial or ethnic groups, followed by the jobless rate of Latinx workers (7.9 percent), Asian American workers (5.7 percent), and White workers (5.3 percent). Across race, ethnicity, and gender, Black women saw an important increase in employment, adding 135,000 jobs. Yet the number of Black women employed is still 7.7 percent below pre-coronavirus recession levels. Along with Latina women, Black women’s employment has declined more than for any other group. (See Figure 1.)
Figure 1
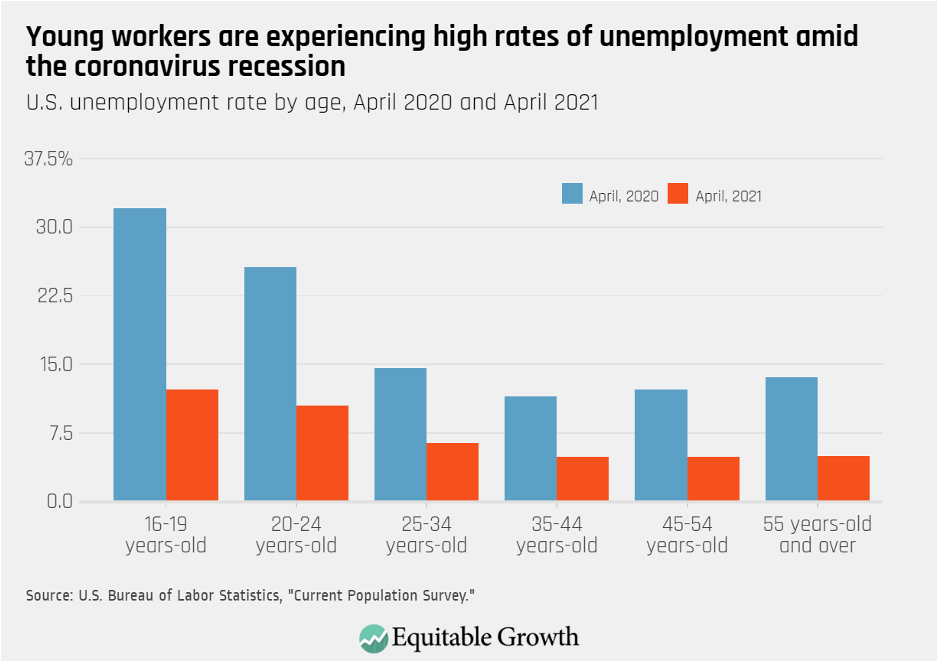
Young workers are another group that has been hard hit. As the health and economic crises hit the United States, the unemployment rate of workers between the ages of 16 and 19 skyrocketed, going from 11.5 percent in February 2020 to 32.1 percent in April 2020. For workers between the ages of 20 and 24 the jobless rate climbed from 6.3 percent to 25.6 percent during the same period. Currently at 12.3 percent and 10.5 percent, respectively, the jobless rate for the youngest subsets of workers in the U.S. economy is both above pre-pandemic levels and above the jobless rate of older workers. (See Figure 2.)
Figure 2
Research from the early months of the coronavirus recession shows that younger workers—along with workers of color, workers with lower levels of educational attainment, and women workers—experienced both particularly large decreases in hiring and particularly large employment losses. These results hold even when accounting for young workers’ occupational distribution, since they are overrepresented in positions that have been among the most exposed during this downturn, including lower-paying service jobs in the leisure and hospitality industry.
Moreover, at the height of the recession last spring young Black, Asian American, and Pacific Islander workers experienced especially high jobless rates, reaching nearly 30 percent according to an analysis by the Economic Policy Institute, compared to 24 percent among all workers between the ages of 16 and 24.
What makes younger workers so vulnerable to slack business conditions? For one, research shows that workers who first step into the U.S. labor force during a recession experience persistently harmful effects on their future labor market outcomes. Usually, early careers are periods of strong earnings growth—a process that can be disrupted by recessions. In addition, because earnings mobility has declined since the 1980s, where workers start off in the earnings distribution is increasingly important.
Research by Jesse Rothstein at the University of California, Berkeley, finds, for instance, that workers who graduated college during the Great Recession of 2007–2009 had lower employment rates and earnings than older college graduates. Likewise, research by Kevin Rinz of the U.S. Census Bureau shows that during the Great Recession, millennials (people born between 1980 and 1994), experienced especially large earnings losses that persisted even as the U.S. economy recovered.
In part, Rinz finds, these losses were driven by millennials’ lower likelihood to work for high-paying employers even as their employment rates recovered. Rinz also finds that millennials suffered from structural changes to local labor markets in hard-hit locations that caused persistent lower earnings and employment opportunities even as the overall national economy moved beyond the recession.
As the U.S. economy struggles to return to pre-pandemic levels, it is important to highlight the persistent negative economic consequences facing the hardest hit workers that could last well into the forthcoming economic recovery and exacerbate long-term trends of rising economic inequality and insecurity. A year after one of the worst months for the U.S. labor market, an important way to prevent young workers from the harmful long-term consequences of recessions is to promote healthy earnings growth through policies that increase wages, such as lifting the federal minimum wage floor and fostering unionization to offset the persistent downward pressure on wages facing these workers.
To ensure that happens, policymakers should make heavy long-term investments in the broader U.S. economy alongside economic relief to workers and families and greater access to Unemployment Insurance benefits to give affected workers a strong and stable foundation to build on during the eventual recovery. Specifically, under the current Unemployment Insurance system, self-employed workers, workers just stepping into the labor force, and workers who do not meet the minimum earnings thresholds are not eligible for regular jobless benefits, hurting both individual workers and the entire economy. To ensure the damages caused by the coronavirus recession can be overcome swiftly and sustainably, all young workers and other vulnerable workers need to be able to benefit from one of the country’s most important income support programs.
On May 7, the U.S. Bureau of Labor Statistics released new data on the U.S. labor market during the month of April. Below are five graphs compiled by Equitable Growth staff highlighting important trends in the data.
With fewer jobs added than expected in April, prime-age employment increased only slightly to 76.9 percent from 76.8 percent in March.
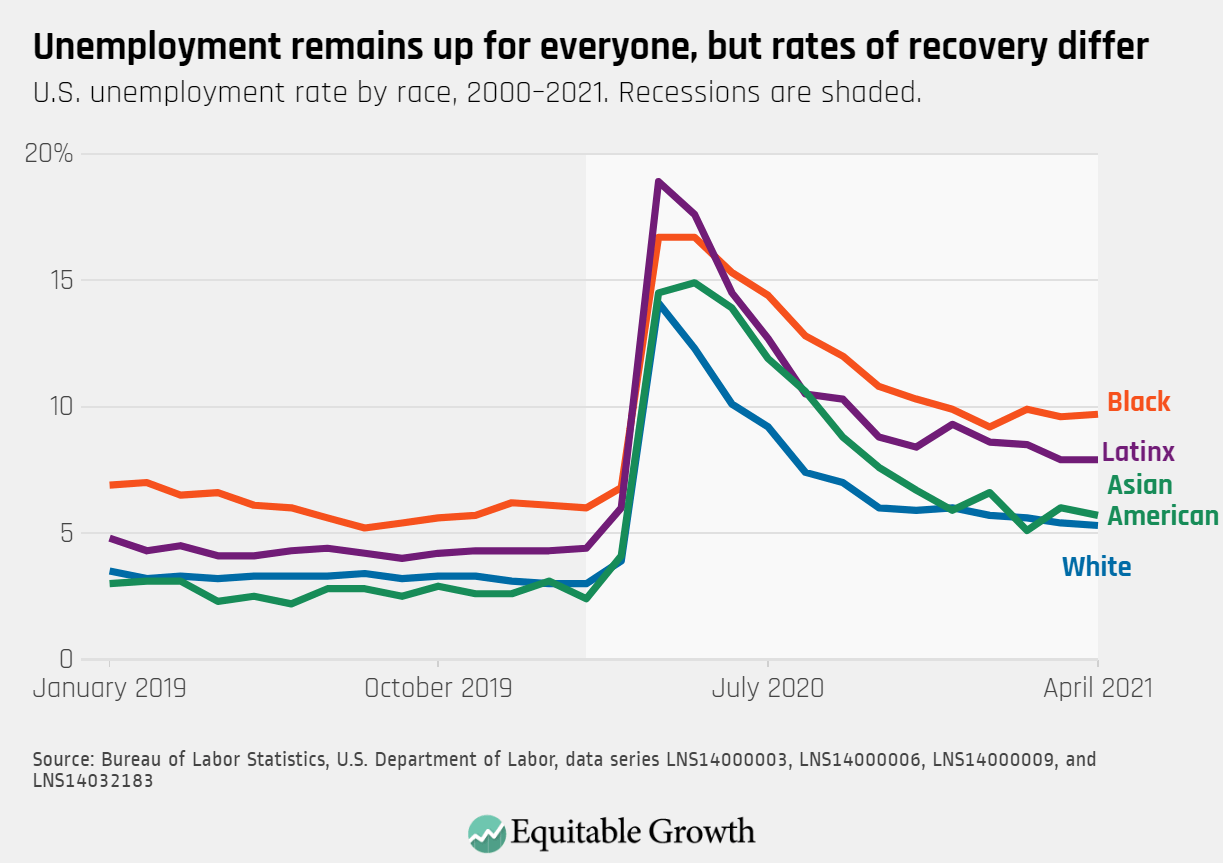
Unemployment rates were little changed among most racial and ethnic groups and remain persistently high for Black and Latinx workers.
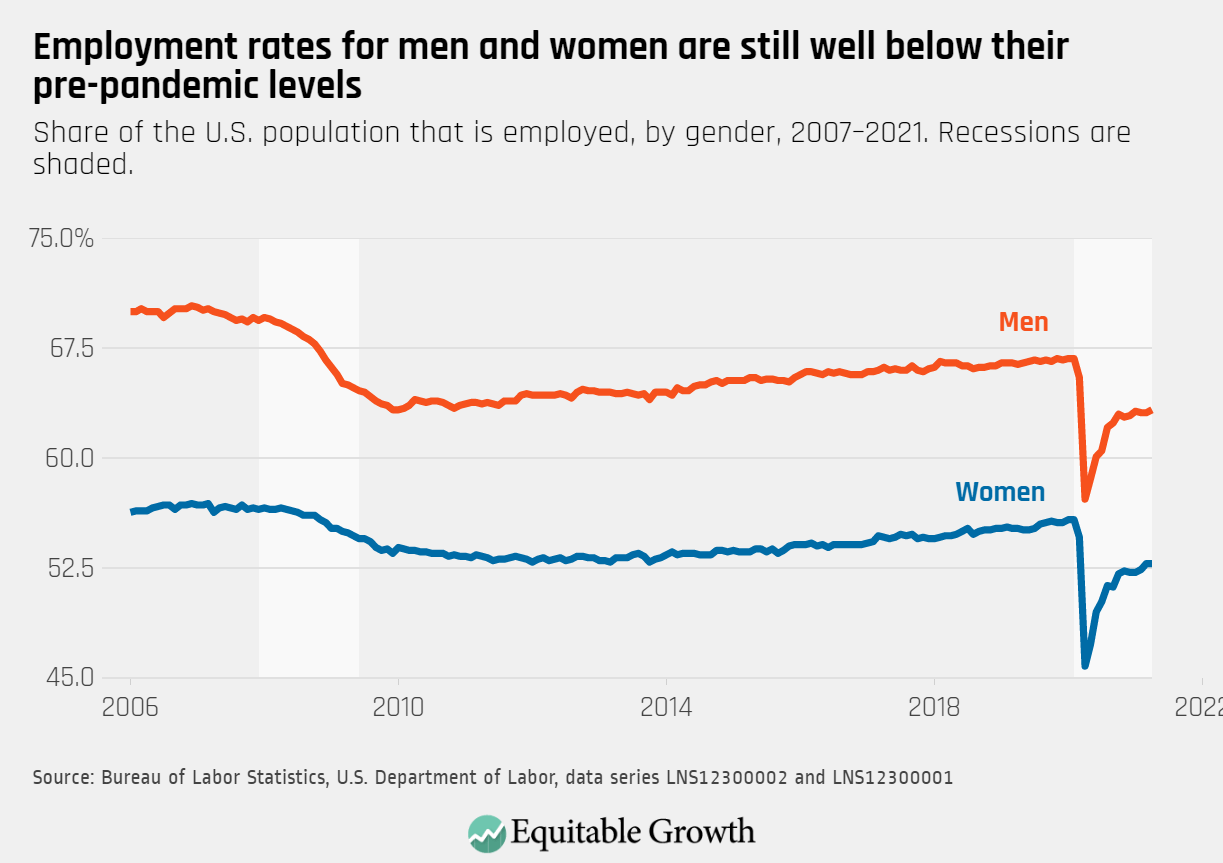
After stark declines in employment rates for both women and men amid the pandemic, men made small gains in April with no change to women’s employment rate.
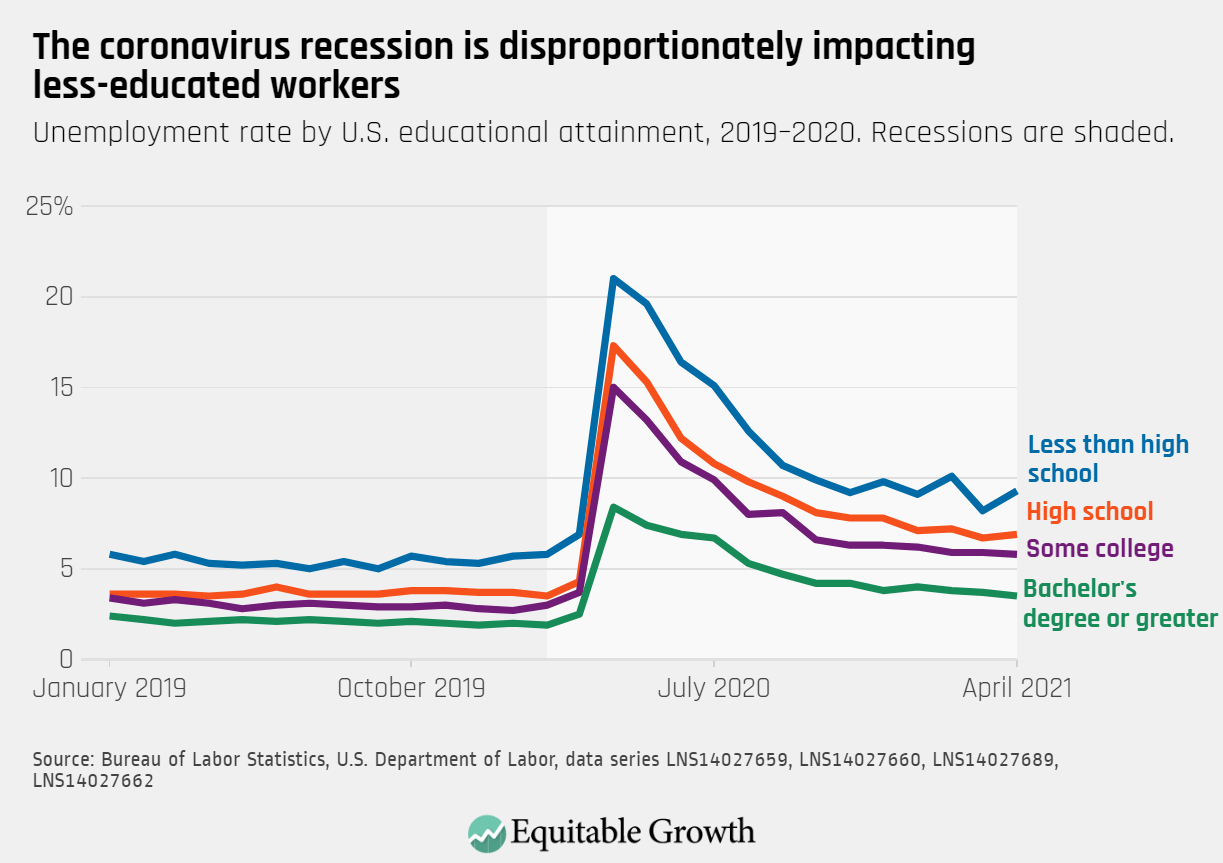
The unemployment rate for workers with less than a high school degree increased to 9.3 percent in April from 8.2 percent in March, while labor force participation also declined for this group of workers.
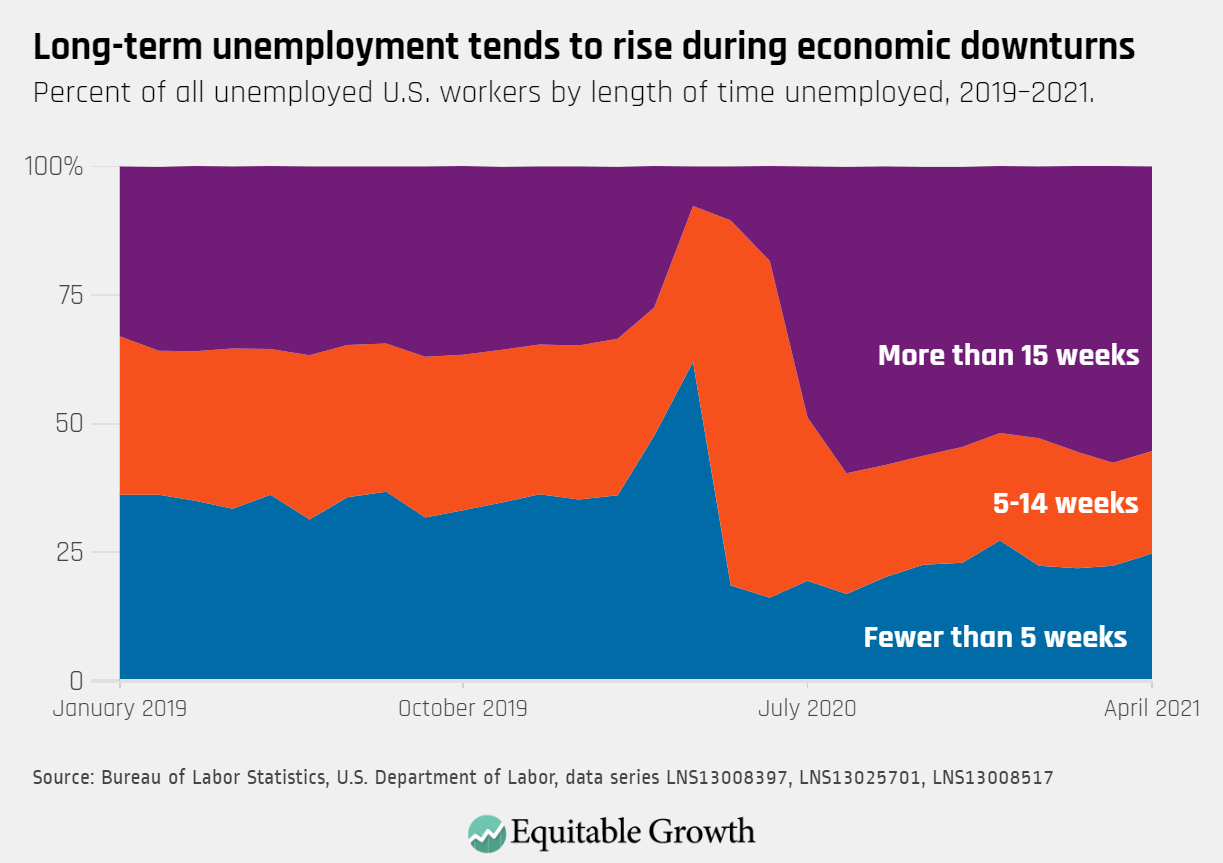
The proportion of unemployed workers who were out of work for fewer than 5 weeks increased in April, offsetting the recent trend of increasing long-term unemployment.
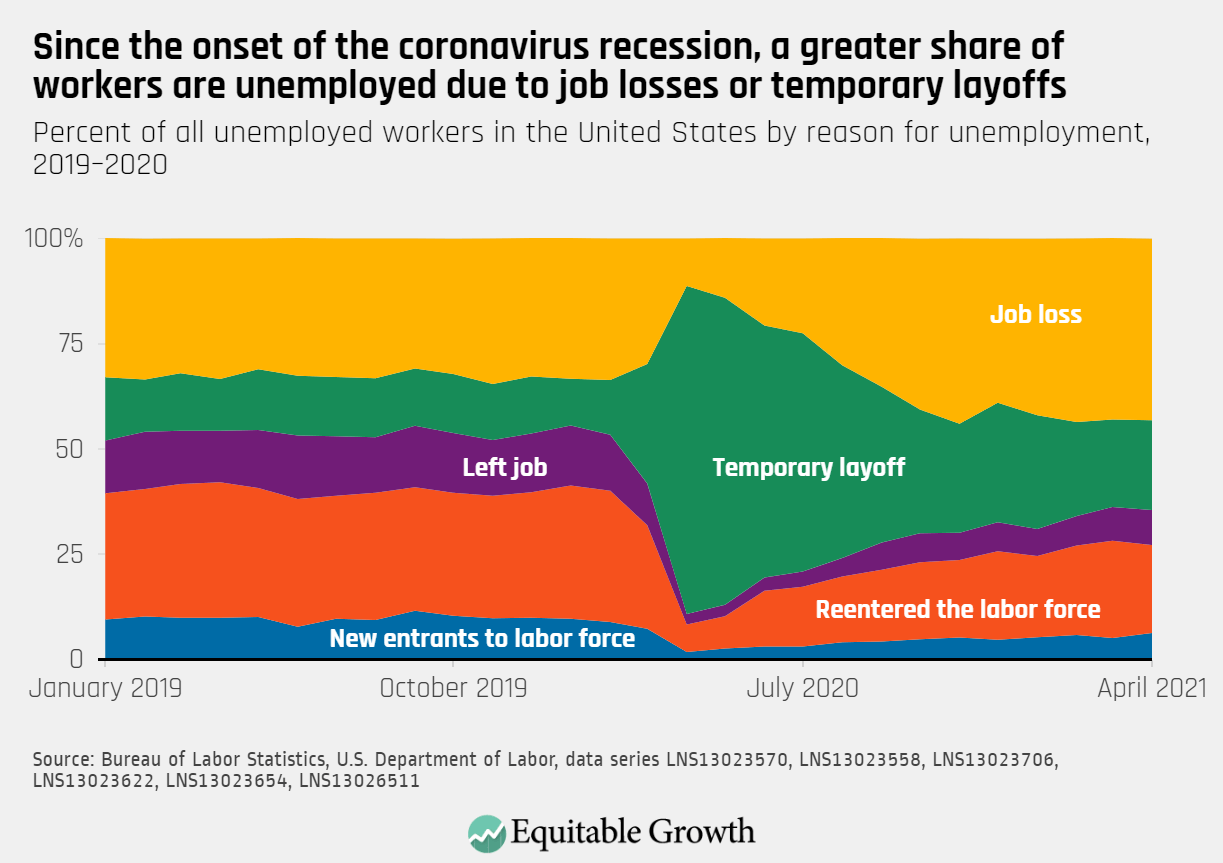
As the unemployment rate was little changed in April, an increasing proportion of those out of work were on temporary layoff, left their job, or were new entrants to the labor force.