The Senate Judiciary Committee is likely to approve a bipartisan antitrust bill soon that will be a down payment on reviving effective antitrust enforcement in the United States. The Merger Filing Fee Modernization Act of 2021, introduced by Sens. Amy Klobuchar (D-MN) and Charles Grassley (R-IA), would increase enforcement resources for the Federal Trade Commission and the Antitrust Division of the U.S. Department of Justice by more than $154 million, or almost 30 percent. It would also adjust the merger filing fees system so that fees would more equitably fall on larger deals.
Since early 2018, the Washington Center for Equitable Growth has focused on the need for policymakers to increase funding for antitrust enforcement. A 2019 report, titled “The state of U.S. federal antitrust enforcement,” explores the issue in detail and analyzes the inequities in the current funding system, which result in smaller deals paying a greater share, proportionately, of merger filing fees. And our 2020 report, “Restoring competition in the United States: A vision for antitrust enforcement for the next administration and Congress,” co-authored by seven antitrust experts, advocates for a substantial $600 million increase in funding for antitrust enforcement.
A growing body of evidence helps create broad consensus that the antitrust enforcement agencies need more resources to achieve their mission. Sen. Grassley’s co-sponsorship of the bill reflects new support from the right for allocating these badly needed resources. And the soon-to-be newest commissioner of the Federal Trade Commission, Lina Kahn, an associate professor at Columbia Law School, said in a recent confirmation hearing that measures like the Merger Filing Fee Modernization Act of 2021 “make sense.”
The bill alone will not solve the market power problem in the U.S. economy, but increasing the enforcers’ capacity to bring more cases is a necessary first step. This column explores current antitrust enforcement funding streams and merger filing fees structures, why policymakers must increase funding for and modernize antitrust enforcement, and how the new bill would impact funding for the antitrust agencies and the merger filing fee system.
Current antitrust enforcement funding streams and filing fees structures
The United States funds antitrust enforcement through two sources. Since the passage of the Hart-Scott-Rodino Act in 1976, the bulk of the funding—between 63 percent and 100 percent—comes from the fees that companies pay as part of the merger review process. Congress typically supplements those fees with additional funding.
In 2000, Congress created a three-tier fee structure based on the size of the transaction. For deals between $50 million and $100 million, the fee is $45,000. For those between $100 million and $500 million, the fee is $125,000. And for deals of $500 million or more, the fee is $280,000. (There is no reporting or fee required for deals less than $50 million). By statute, the thresholds adjust based on Gross National Product, but the fees do not. (See Table 1.)
Table 1

This essentially means that today, 20 years after this fee structure was implemented, parties in all mergers are paying far less in real terms. Furthermore, at this point, the thresholds themselves—particularly the third threshold—treat very differently sized mergers the same: A merger of $1 billion, for example, pays the same $280,000 filing fee as a $100 billion merger.
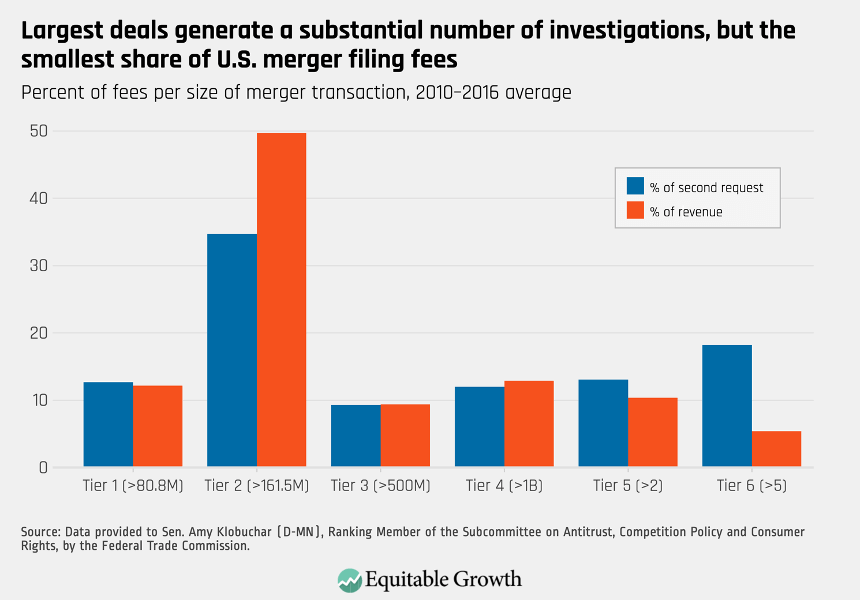
In theory, larger deals should pay higher fees because they generally require more resources. In practice, however, those larger deals, while being far more likely to raise antitrust concerns, account for a small percentage of the fees collected.
Between 2010 and 2016 (the most recent period for which data are available), the largest deals—those valued at more than $5 billion—accounted for only 7 percent of total merger fees but accounted for almost one-fifth of the merger investigations requiring second requests.1 (See Tier 6 in Figure 1.) By contrast, smaller deals subject to the $125,000 fee accounted for almost half of the fees collected but only one-third of second requests. (See Tier 2 in Figure 1.)
Figure 1
The need for increased funding and resources for antitrust enforcement
For more than a decade, Congress has not appropriated sufficient resources for the antitrust enforcement agencies to meet their responsibilities. As FTC nominee Lina Khan explained in her confirmation hearing, the economy and the economic activity that antitrust enforcers police have grown substantially faster than the resources Congress has provided them. Between 2008 and 2020, the economy grew twice as much as antitrust appropriations. And, even more striking, between 2010 and 2020, the economy grew almost 10 times more than antitrust enforcement appropriations. (See Figure 2.)
Figure 2

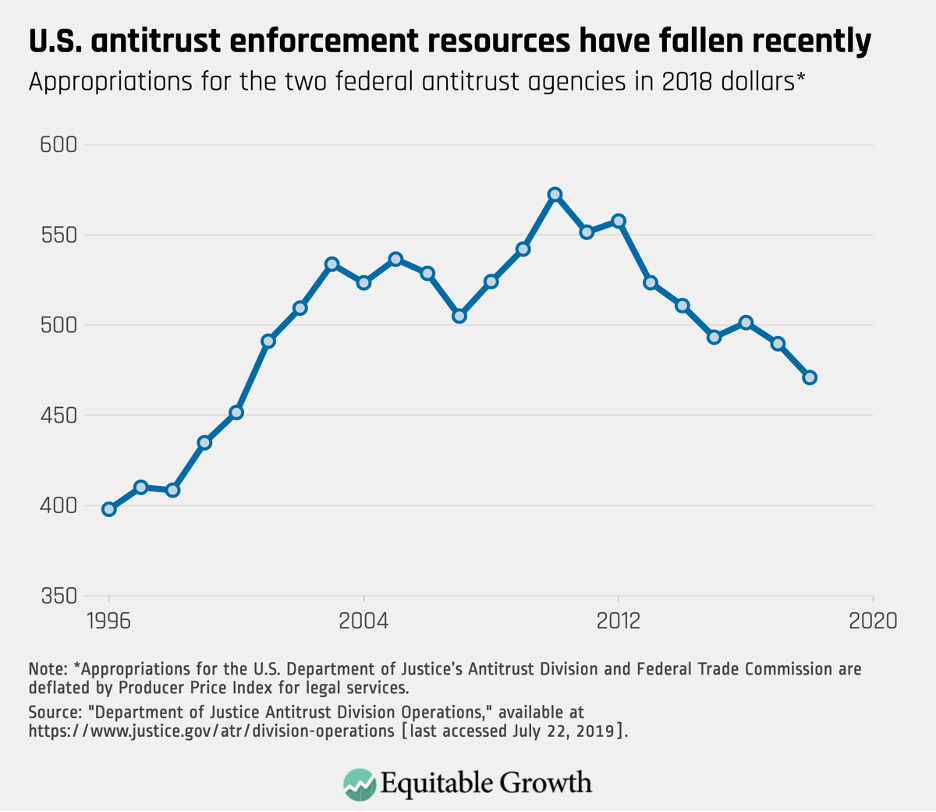
Looking at appropriations in real terms accounts for the changes in the actual costs of enforcement, such as salaries, discovery, and expert witnesses, among other things. In those terms, appropriations were 18 percent lower in 2019 than in 2010. (See Figure 3.)
Figure 3
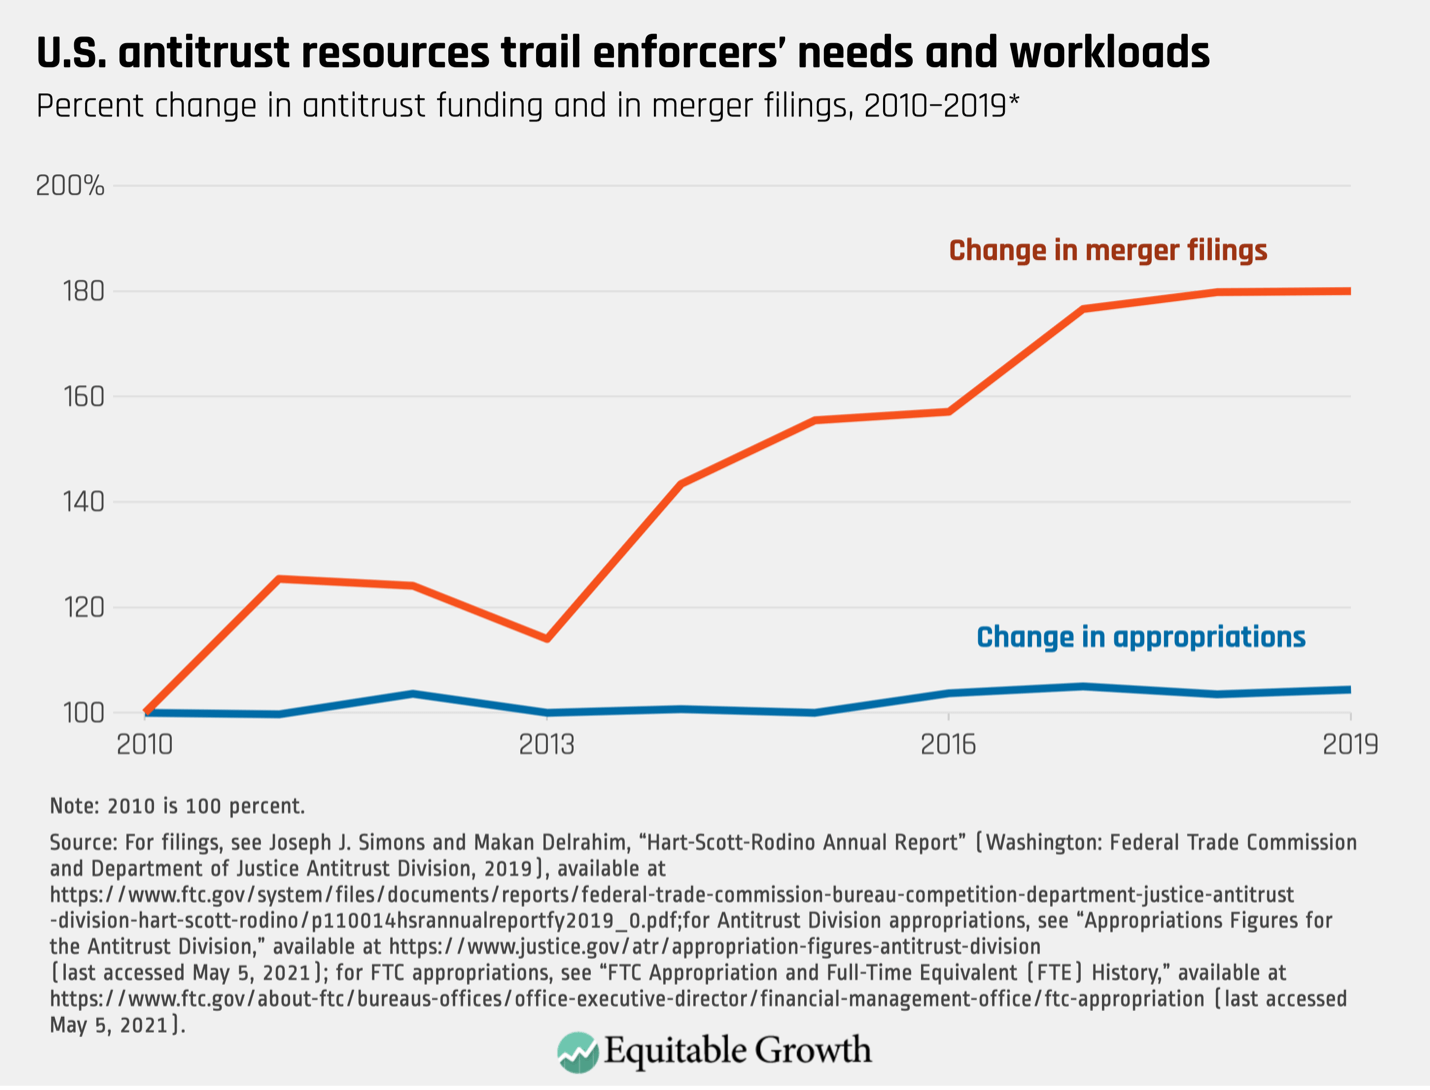
Congress did increase appropriations for the Federal Trade Commission in 2020 and 2021 and for the Antitrust Division of the Justice Department in 2020, but those increases—although necessary and welcome—do not address the agencies’ increased workload. Between 2010 and 2019 (the most recent year for which data breaking down the size of filings are available), merger filings increased significantly almost every year. By 2019, filings were almost 80 percent greater than in 2010, while appropriations were merely 5 percent greater than in 2010. (See Figure 4.)
Figure 4
The Merger Filing Fee Modernization Act updates and modernizes antitrust funding streams
The Merger Filing Fee Modernization Act of 2021, which the Judiciary Committee will consider soon, addresses the imbalances in fees and begins to correct the deficiency in antitrust enforcement funding.
The bill lowers fees on mid-size transactions, creates new fee categories for larger deals, and increases fees for larger deals. The highest fee would increase from $280,000 to $2.25 million. Table 2 below outlines the changes to the merger filing fee structure.
Table 2

The fees would also adjust on a yearly basis, based on changes in the Consumer Price Index. This provision prevents inflation from whittling away the real costs of the fees and solidifies the agencies’ antitrust funding.
According to the bill’s co-sponsors, the agencies would collect an estimated additional $135 million in revenue in the first year, which would be almost 50 percent more than the total merger fees collected in 2020, which are split evenly by the Federal Trade Commission and the Antitrust Division of the Justice Department.
The bill would also increase funding in 2022 of the Justice Department’s Antitrust Division and the Federal Trade Commission to roughly $670 million from $525 million, an almost 30 percent increase over the current appropriations. Although Equitable Growth’s 2020 transition report recommends increasing antitrust resources by a far greater amount, $600 million2, the bill provides a down payment toward the resources needed for optimally effective antitrust enforcement.
 report
Restoring competition in the United States
November 19, 2020
 report
The state of U.S. federal antitrust enforcement
September 17, 2019
 Vision 2020
Conclusion
The Merger Filing Fee Modernization Act of 2021 would immediately and substantially increase the capacity of the Federal Trade Commission and the Antitrust Division of the Department of Justice to investigate and litigate more antitrust actions. The bill’s filing fee reforms would also ensure that mega-mergers bear a fairer share of the burden.
Increasing the resources to fight antitrust violations is necessary, but it alone will not solve the United States’ market power problem. Bigger and more difficult challenges remain. Congress needs to reform the antitrust laws so that they effectively prevent anticompetitive abuses in the market. Enforcers must also more effectively use the resources they have—and hopefully receive more of—to maximize their efforts.
Nevertheless, the development of a bipartisan consensus on one important piece of competition policy signals that Congress is focused on this issue. This may be a sign that bolder reforms are possible.